ful establishment of Sherman big bluegrass were studied at the Manitou Experimental Forest, Colorado, from 1963 to 1965. Rec- ommendations for seeding areas having similar soil and climatic conditions are as follows:
1. Sherman big bluegrass should be planted into a moist seedbed in July or August. The seedlings can be expected to emerge 7 to 10 days after plant- ing and be well established with- in 2 to 3 months. Bluegrass emer- gence is poor if the seed must remain in the ground for a pro- longed period of time. Although spring seeding is less favorable, it is a possible alternative pro- viding soil moisture is good.
2. On sandy-loam or sandy- clay-loam soils, seed should be drilled as uniformly as possible to a 0.5- or %-inch depth. Five pounds per acre at a maximum la-inch row spacing is a sug- gested seeding rate. A double-
disc, depth-band or comparable grass drill is recommended for controlling seed placement depth. 3. Leave the soil rough plowed until just prior to seeding to re- duce the establishment of weeds and the interval the ground is susceptible to erosion.
1 Forest Service, U.S. Department of Agriculture, with headquarters at Fort Collins, Colorado, in coopera- tion with Colorado State Univer- sity.
2 Currie, Pat 0. and Dwight R. Smith. Response of seeded ranges to different grazing intensities in the Ponderosa Pine Zone of Colo- rado. 1966. (In preparation, Rocky Mountain Forest and Range Exp. Sta., U.S. Forest Serv., Fort Col- lins, Cola.).
3 Special seeding equipment used in the study was obtained from: a) Crops Research Division, Agricul- ture Research Service, Fort CoZ- lins. b) Forestry and Range Sec- tion, Colorado Agricultural Experi- ment Station, Colorado State Uni- versity, Fort Collins.
%
Effect of Grazing on Soil Compaction
as Measured by Bulk Density on
A
High Elevation Cattle Range
WILLIAM A. LAYCOCK AND PAUL W. CONRAD Plant ecologist and assistant range scientist, at the U.S. Forest Service Intermountain Forest and Range Experi- ment Station’s Forestry Sciences Laboratory, ‘Logan, Utah.
Highlight
Bulk density of fhe soil in grazed plofs was similar fo fhaf in ungrazed exclosures both in early summer be- fore grazing and in lafe summer affer grazing. Increases in bulk den- sify during fhe summer bofh in grazed and ungrazed areas were af- fribufed fo changes in soil moisture. Soils in early summer were moisf and swollen and fhus weighed less per unif volume fhan did fhe dry soils in laie summer.
Rotation and rest-rotation grazing systems are now being applied with increasing frequen-
-
1 In this paper the term “significant” will refer to the 5% level of proba- bility and “highly significant” will refer to the 1% level.
cy on the arid rangelands in the West. These systems require heavy concentrations of livestock during one grazmg season or por- tion thereof, followed by com- plete rest from grazing during the remainder of the season or the following year. Some land managers fear such concentra- tion of animals may cause seri- ous soil compaction that will not be overcome during the rest period.
Relatively few studies have been made to determine how trampling by grazing animals af- fects the soil. Studies conducted
LITERATURE CITED
BEMENT, R. E., R. D. BARMINGTON, A. C. EVERSON, L. 0. HYLTON, JR., AND E. E. REMMENGA. 1965. Seed- ing of abandoned croplands in the Central Great Plains. J. Range Manage. 18: 53-59.
COSPER, H. R., AND A. Y. ALSAYEGH. 1964. Can fertilizer aid in estab- lishing grass on native range. Range Improvement Notes 9 (3) : 5-9. U.S.D.A., Intermountain Re- gion, U. S. Forest Service.
HEDRICK, D. W., D. N. HYDER, AND F. A. SNEVA. 1964. Overstory-un- derstory grass seedings on sage- brush-bunchgrass range. Ore. Agr. Exp. Sta. Tech. Bull. 80. 31 p. HYDER, D. N., AND F. A. SNEVA. 1963.
Studies of six grasses seeded on sagebrush-bunchgrass range. Ore. Agr. Exp. Sta. Tech. Bull. 71. 20 p. MCGINNIES, W. J. 1962. Effect of seedbed firming on the establish- ment of crested wheatgrass seed- lings. J. Range Manage. 15: 230-234. MCGINNIES, W. J., D. F. HERVEY,
J. A. DOWNS, AND A. C. EVERSON. 1963. A summary of range grass seeding trials in Colorado. Colo. Agr. Exp. Sta. Tech. Bull. 73: 81 p.
9
in the more humid eastern or midwestern States have found bulk density is higher in grazed areas than in similar ungrazed areas (Lull, 1959; Reynolds and Packer, 1963; Linnartz, et al., 1966). Studies of soil compaction on arid rangelands, however, have produced somewhat con- flicting results. Daubenmire and Colwell (1942) and Meeuwig
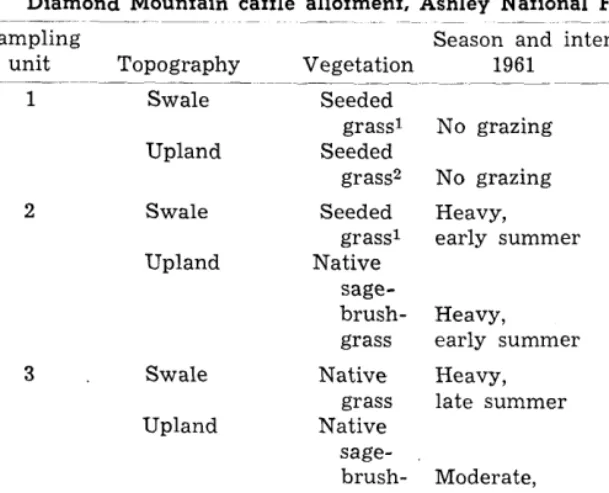
Table 1. Vegetation, topography, and grazing use af sampling locations, Diamond Mountain caffle allotment, Ashley National Forest, Utah. __~
~~ ~~ ._ -- -
Sampling Season and intensity of grazing
unit Topography Vegetation 1961 1962
^_ ___ _~~____ ~______ ~_~~____~ ~____ ___.~ ~ _-
1 Swale Seeded Moderate,
grass1 No grazing early summer
Upland Seeded Heavy,
grass2 No grazing early summer
2 Swale Seeded Heavy,
grass1 early summer No grazing
Upland Native
sage-
brush- Heavy,
grass early summer No grazing
3 . Swale Native Heavy, Moderate,
grass late summer midsummer
Upland Native
sage-
brush- Moderate, Moderate, grass late summer midsummer
4 Upland Native
sage-
brush- Light,
grass No grazing late summer
_______ __-. ___ ~ _~~_ _
1 These locations had native grass vegetation before seeding.
2 This location had native sagebrush-grass vegetation before seeding. needed to compact a dry soil than
to compact the same soil when it is moist (Lull, 1959). Thus, grazing on wet soils often causes soil compaction, but grazing on dry soils does not necessarily have the same effect.
In 1962 a study was conducted on the Diamond Mountain cattle allotment of the Ashley National Forest, Utah, to determine: (1) if grazing causes compaction, as measured by bulk density; and (2) the relation between bulk density and various soil char- acteristics. This paper presents the results of that study and points out some of the problems and limitations in the use of the bulk density method of measur- ing soil compaction on range- lands.
Study Area and Procedure The study area is on the Dia- mond Mountain Plateau, on the south slope of the Uinta Moun- tains, 25 mi. north of Vernal, Utah. This area
is
about 8,000 ft in elevation and receives 20 to 25 inches of precipitation annually. The soils are loams to clay loamsderived mostly from sedimen- tary rocks of the Browns Park and Morgan formations.
The Diamond Mountain allot- ment covers about 11,000 acres and is grazed by 510 cattle from June 1 through September 30. The allotment is fenced into range units, some of which have native sagebrush-grass vegeta- tion on upland sites and native grass in swales. Parts of other units were seeded to introduced grasses in the early 1950’s.
In 1959, several small exclo- sures (33 x 33 ft) were con- structed in each unit to exclude grazing. These exclosures and the adjacent grazed range were excellent study locations for de- termining the effect of grazing on soil compaction.
Four of the allotment’s range units were used in this study. In three of these units (1, 2, and 3)) soil samples were taken from both upland and swale areas from exclosures and adjacent grazed plots. In the fourth unit
(4)) however, soil samples could only be taken in an upland area because no exclosures had been
Table 2. Average bulk densify of soil at various depths in swale and upland locations sampled in early and lafe summer, 1962 (oven- dry soil g/cc),
___ ___-__ ___--
Location and
depth Grazed plots Exclosures (inches) Early Late Early Late
____ SWALE
o-1 0.95 1.03 1.02 1.01 l-2 1.01 1.06 1.04 1.08 2-4 1.07 1.11 1.10 1.12 4-6 1.12 1.14 1.14 1.18 Ave. 1.04 1.08 1.08 1.10 UPLAND
o-1 1.19 1.22 1.11 1.19 l-2 1.20 1.24 1.12 1.22 2-4 1.20 1.26 1.20 1.24 4-6 1.22 1.24 1.19 1.28 Ave. 1.20 1.24 1.16 1.23 -
constructed in a swale area with- in this unit. The characteristics of each location sampled, along with the season and intensity of grazing use each received in 1961 and 1962, are shown in Table 1. We did not know whether 3 years’ protection from grazing was long enough to overcome soil compaction that might have occurred before the exclosures were established. Therefore, in early summer we sampled areas inside and outside an old exclo- sure that had been protected from grazing about 15 years. The data from this sampling were not included in any of the com- parisons or analyses.
A hand-driven core sampler was used to take the samples, which were 3 inches in diameter. Samples were taken at depths of O-l, 1-2, 2-4, and 4-6 inches in early summer before grazing be- gan and again in late summer near the end of the grazing sea- son. Four to six samples were taken from each of the upper three depths and two samples were taken from the 4 to 6-inch depth inside and outside the ex- closures at every location.
Table 3. Change in average bulk density during fhe summer of 1962 (g/cc).1
Sam- Graz- Change
pling ing during summer unit period Grazed Excl. Ave. SWALE
1 Early
sum. to.06 $0.08 $0.07 2 None + .13 + .03 + .08 3 Midsum. - .05 - .04 - .04 Ave. + .04 + .02 + .03 UPLAND
1 Early
sum. + .16 + .18 + .17 2 None - .Ol + .08 + .03 3 Midsum. - .05 + .08 + .02 4 Late sum. + .06 - .02 + .02 Ave. + .04 + .08 + .06 Ave. all
locations + .04 + .06 + .05 IEach figure is an average of the
four sampling depths.
pressed as grams of ovendry soil per cubic centimeter. The sam- ples taken in early summer were screened to determine percen- tage of gravel (rock particles over 2 mm.). Amounts of sand, silt, and clay in the gravel-free portion were determined by the hydrometer method (Bouyoucos,
1937). A modification of the wet combustion method described by Walkley and Black (1934) was used to determine amount of organic matter.
Bulk densities were averaged for each depth at all locations (Table 2). Th e change in bulk density was then computed by subtracting the average bulk density obtained in early sum- mer from that for late summer. The average changes for all depths combined at each location were then determined (Table 3).
To compare actual bulk den- sity among different depths and sampling locations, the average bulk density was computed for each depth at every sampling location. The early and late bulk densities from both the grazed and ungrazed plots for each depth were pooled in figuring these averages.
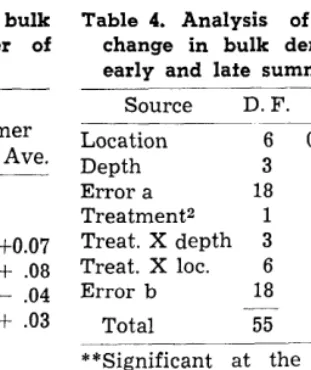
Table 4. Analysis of variance of change in bulk density between early and late summer. -
Source D. F. M. S. “F” Location 6 0.0370 ““10.0
Depth 3 .0008 lN.S.
Error a 18 .0037 Treatment2 1 .0018 lN.S. Treat. X depth 3 .0027 lN.S. Treat. X lot. 6 .0134 ** 4.5 Error b 18 .0030
Total 55
**Significant at the 1% level of probability.
INot significant at the 5% level of probability.
2Grazed plots vs exclosures.
Results
At most locations, bulk den- sities of the soil samples were similar in the grazed plots and exclosures, both in early and late summer (Table 2). The average bulk density in the grazed plots was less than .Ol gram per cubic centimeter higher than that in the exclosures. This difference was not significant.l In early summer bulk densities inside the old exclosure that had been pro- tected from grazing for 15 years were essentially the same as in the grazed plot outside the exclo- sure.
Bulk densities increased dur- ing the summer at almost every location-inside and outside the exclosures both in grazed and ungrazed units (Table 2). The average increase (0.5 g/cc) was highly significant.
Bulk densities increased slight- ly more in the unit grazed in early summer than in those grazed in mid and late summer
(Table 3). However, grazing evidently was not responsible for these increases because bulk den- sities increased as much in the exclosures as in the grazed plots.
An analysis of variance indi- cated that changes in bulk den- sity were highly significantly different among locations but not significantly different be- tween treatments (grazed plots vs. exclosures) nor among the
four depths (Table 4). The “Treatment X location” interac- tion was significant. Further analysis revealed that bulk den- sity increased significantly more in the exclosures than in the grazed plots in the upland loca- tions.
In the analysis discussed above, changes in bulk density were used. In an analysis of vari- ance using average bulk density for each location, the difference among locations was highly sig- nificant (Table 5). Most of the variation between locations was accounted for by the comparison between swale and upland loca- tions; average bulk density in the uplands (1.21) was signifi- cantly higher than in the swales (1.07). These differences in bulk density are related to basic soil characteristics such as moisture, texture, and organic matter, and not to differences in livestock trampling.
Average bulk density at the different depths was:
0-1” 1-2” 2-4” 4-6”
_._ __~ ____- _~
1.10 1.13 1.17 1.20 The increase with depth was also highly significant (Table 5). However, the increase was linear within the range sampled, and no further comparisons could be made between measured depths because the significance would be affected by the interval be- tween the depths.
Correlafion Between Bulk Density and Soil Characferisfics Some factors other than tram- pling by livestock evidently were responsible for the increase in bulk density during the summer because density increased in un- grazed areas as well as in those grazed. The correlation coeffi- cients between bulk density and some of the measured soil fac- tors are shown below:
Correl.
Soil factor coef.
$% soil moisture -.60 % organic matter -.72
LAYCOCK AND CONRAD
Table 5. Analysis of variance of average bulk density at differeni sampling locations and depths.
Degrees
of Mean
Source freedom square “F” Location 6 0.0331 **20.7
Depth 3 .0121 ** 7.6
Error 18 .0016
Total 27
**Significant at l-percent level of probability.
The coefficients for soil moisture and organic matter are highly significant.
Soil Moisture. - Soil moisture decreased from early to late sum- mer (Table 6). This probably caused the increase in bulk den- sity. Moist soils dried in sampling cylinders decreased in volume but no quantitative measure of amount was obtained. Soils in early summer were moist and swollen at the time of sampling. Therefore, these samples con- tained less soil mass and weighed less per unit volume than the dry soil samples taken in late sum- mer.
Swelling and shrinking of the soil in response to different mois- ture conditions evidently occurs in almost all soils (Perrier, et al., 1959) especially those containing montmorillonite clays. Much of the research in this field has been on heavy clay soils in which relatively large changes in vol- ume are common (Holmes, 1955; Fox, 1964). However, research by Haines (1923)) Lauritzen and Stewart (1941)) and Lauritzen
(1948) indicates that swelling is also common in soils that contain less clay. The volume change de- pends on texture, type of clay, and amount of moisture. Volume changes are greatest in a mois- ture range between field capacity and wilting point (Haines, 1923).
The high correlation between bulk density and soil moisture suggested the use of covariance analysis to separate the effects of soil moisture and grazing or trampling on bulk density. The relation between bulk density
Table 6. Average percentage of soil moisture, organic matter, gravel, clay, silt, and sand in the soil of swale and upland locations.
Moisture content
Depth Early Late Organic
(inches) summer summer content Gravel
Soil separates’
Clay Silt Sand
SWALE
O-l 26.4 l-2 23.1 2-4 22.8 4-6 22.4 Ave. 23.7 UPLAND
o-1 12.9 l-2 11.5 2-4 11.4 4-6 10.8 Ave. 11.7
9.0 8.1 4.2 23.7 36.6 39.7
10.2 7.6 6.3 24.8 37.1 38.1
11.9 6.4 4.5 27.0 37.3 35.7
12.8 5.2 3.6 31.5 32.3 36.2
11.0 6.8 4.7 26.8 35.8 37.4
4.5 5.6 8.8 19.6 36.4 44.0
5.8 4.8 9.4 22.0 34.7 43.3
6.6 4.4 9.6 23.4 33.0 43.6
7.8 3.8 I 10.2 24.9 30.4 44.7
6.2 4.6 9.5 22.5 33.6 43.9
IClay, silt, and sand are expressed as a percentage of the gravel-free portion of soil.
and soil moisture is not entirely linear, however, In addition, bulk density is also highly correlated with other soil factors, such as texture and organic matter. The lack of linearity and the interre- lations with other soil factors preclude the use of simple covari- ante for evaluating or adjusting bulk density data.
The following tabulation of soil moisture percentages reveals some interesting soil moisture relations in grazed plots and ex- closures:
Grazed Ex- plots closures EARLY SUMMER
Swale 22.0 25.4
Upland 11.3 12.0
LATE SUMMER
Swale 11.7 10.3
Upland 6.4 6.0
These figures include only loca- tions where the grazed plots and exclosures were sampled on the same or successive days. At the time of snowmelt, the soils in- side and outside the exclosures undoubtedly were saturated and had the same moisture content. However, the exclosures have more litter and live plant cover than the adjacent grazed plots. Such cover may retard evapora- tion and retain moisture in the soil in the exclosures longer in early summer. By late summer evapotranspiration had reduced
soil moisture to about the same low level inside and outside of most exclosures.
Organic matter.-The soil in swales contained more organic matter at all depths than that in the uplands (Table 6). This prob- ably is part of the reason that bulk density is lower in the swales than in the uplands. Or- ganic matter decreased with depth. This decrease probably is partly responsible for the in- crease in bulk density with depth because the correlation between organic matter and bulk density (-.72) was highly significant.
Soil texture.-The swale soils contained more silt and clay and less sand than the upland soils (Table 6). The amount of sand and the combined amount of silt and clay were similar for all depths but the amount of clay generally increased with depth, whereas silt decreased. The cor- relation between clay and bulk density (-.25) was not significant at the 5% level, but was signifi- cant at the 10% level of confi- dence. The correlation between gravel content and bulk density was quite low and computation of bulk density on a gravel-free basis did not appear to be justi- fied.
Conclusions
grazing on soil compaction unless soil moisture conditions are ap- proximately the same in the areas compared, or unless com- parative data are taken on both grazed and ungrazed areas, be- cause bulk density varies with amount of soil moisture. Differ- ences in bulk density caused by differences in soil moisture could be mistakenly attributed to other causes. For example, if only grazed areas had been sampled in this study, an erroneous con- clusion could have been reached that grazing caused a significant increase in bulk density when in fact no measurable compaction was caused by grazing.
Trampling can influence soil characteristics other than bulk density-structure, amount and distribution of pores, and rate of infiltration of water (Lull, 1959; Reynolds and Packer, 1963). However, amount of total pore space and rate of infiltration are highly correlated with bulk den- sity (Packer, 1953; 1963) so the precautions mentioned in the preceding paragraph probably should also be observed when making comparisons using any of these types of data.
Further studies are now being made on the Diamond Mountain cattle allotment to better define the relation between bulk den- sity and soil moisture, pore space, and infiltration rate and to deter- mine how time of sampling as well as grazing treatment affects all of these characteristics. The results should provide a better basis for measuring the effect grazing has on the soil in future studies.
Summary
In 1962, soils in exclosures and on the adjacent grazed range on the Diamond Mountain cattle allotment, Ashley National For- est, Utah, were sampled to deter- mine: (1) difference in compac- tion, as measured by bulk den- sity, on grazed and ungrazed areas, and (2) the relation be- tween bulk density and various
soil characteristics. Samples were taken at O-l, l-2, 2-4, and 4-6 inch depths in early summer before grazing began and again in late summer near the end of the graz- ing season.
The upland soils had higher average bulk density than the swale soils. Bulk densities in the grazed plots were similar to those in the exclosures both in early and late summer. However, bulk density increased significantly during the summer in both grazed and ungrazed areas.
Bulk density was significantly correlated with percentage of soil moisture and organic matter. Of these factors, only moisture changed during the summer. Soils were moist in early summer and dry in late summer. These soils swelled when wetted and shrank when dried, giving dif- ferent bulk density values.
Evidently almost all soils swell and shrink in response to dif- ferent moisture conditions. Be- cause of this, bulk density should not be used to compare effects of treatments on soil compaction unless soil moisture conditions at the time of sampling are ap- proximately the same in the areas compared. Difference in bulk density resulting from difference in soil moisture could be at- tributed mistakenly to other causes.
Studies are now being made to better define the relation be- tween bulk density and soil mois- ture and to determine how time of sampling affects bulk density, pore space, and infiltration of water into the soil. The results should provide a better basis for measuring the effect of grazing on the soil.
LITERATURE CITED
BOUYOUCOS, J. G. 1937. The hydrom- eter method for making a very detailed mechanical analysis of soils. Soil Sci. 44:245-256; 315-317. DAUBENMIRE, R. F., AND W. E. Col- WELL. 1942. Some edaphic changes due to overgrazing in Agropyron- Poa prairie of southeastern Wash- ington. Ecology 23: 32-40.
Fox, W. E. 1964. A study of bulk density and water in a swelling soil. Soil Sci. 98:307-316.
HAINES, WILLIAM B. 1923. The vol- ume change associated with varia- tions in water content in soils. J. Agr. Sci. 13: 296-316.
HOLMES, J. W. 1955. Water sorption and swelling of clay blocks. J. Soil Sci. 6: 200-207.
LAURITZEN, C. W. 1948. Apparent specific volume and shrinking characteristics of soil material.
Soil Sci. 65: 155-179.
LAURITZEN, C. W., AND A. J. STEWART. 1941. Soil volume changes and ac- companying moisture and pore space relationships. Soil Sci. Sot. Amer. Proc. 6: 113-116.
LINNARTZ, NORWIN E., CHUNG-YUN HSE, AND V. L. DUVALL. 1966. Graz- ing impairs physical properties of a forest soil in central Louisiana. J. Forest. 64: 239-243.
LODGE, R .W. 1954. Effects of grazing on the soils and forage of mixed prairie in southwestern Saskatch- ewan. J. Range Manage. 7: 166-170. LULL, HOWARD W. 1959. Soil compac-
tion on forest and range lands. U.S. Forest Serv. Misc. Publ. 768. 33 p.
MEEUWIG, RICHARD 0. 1965. Effects of seeding and grazing on infiltra- tion capacity and soil stability of a subalpine range in central Utah. J. Range Manage. 18: 173-180. ORR, HOWARD K. 1960. Soil porosity
and bulk density on grazed and protected Kentucky bluegrass range in the Black Hills. J. Range Manage. 13 (2) : 80-86.
PACKER, PAUL E. 1953. Effects of trampling disturbance on water- shed condition, runoff, and erosion. J. Forest. 51: 28-31.
PACKER, PAUL E. 1963. Soil stability requirements for the Gallatin elk winter range. J. Wildlife Manage. 27: 401-410.
PERRIER, E. R., D. R. NIELSEN, AND J. E. DOAN. 1959. Adjustment of bulk density to an oven-dry vol- ume basis. Soil Sci. 88: 291-293. REED, M. J., AND R. A. PETERSON. 1961.
Vegetation, soil, and cattle re- sponses to grazing on northern Great Plains range. U.S. Dep. Agr. Tech. Bull. 1252. 79 p.
REYNOLDS, HUDSON G., AND PAUL E. PACKER. 1963. Effects of trampling on soil and vegetation. In Range Research Methods. U.S. Dep. Agr. Misc. Publ. 940: 117-122.