EFFECT OF SOIL AND WATER CONSERVATION TECHNOLOGIES ON
SOIL PROPERTIES IN MAZIBA SUB CATCHMENT,
KABALE
__UGANDA
NDEMERE JULIUS
REG NO: I56EA/27484/2014
A Thesis Submitted in Partial Fulfillment of the Requirement for the award of the
Degree of Master of Science (Integrated Watershed Management) in the School of
Pure and Applied Sciences, Kenyatta University
Declaration
This research thesis is my original work and has never been presented for a degree or any other award in any University.
Signature………..Date……… Ndemere Julius
Department of Geography Kenyatta University
SUPERVISORS
We confirm that the work reported in this thesis was done by the candidate under our supervision.
Signature……….……….…Date………..
Dr. Mary Makokha
Department of Geography Kenyatta University
P.O Box 43844-00100 Nairobi, Kenya.
Signature………Date………..
Professor Moses Makooma Tenywa
Dedication
Acknowledgment
Table of contents
Declaration ... ii
Dedication ... iii
Acknowledgment ... iv
Table of contents ... v
List of Figures ... viii
List of Tables ... ix
List of Plates ... x
List of Equations ... xi
List of Abbreviations and Acronyms ... xii
Abstract ... xiii
CHAPTER ONE: INTRODUCTION ... 1
1.1 Background to the study ... 1
1.2 Statement of the research problem ... 3
1.3 Justification of the study ... 3
1.4 Research questions ... 4
1.5 General objective ... 5
1.5.1 Specific objectives ... 5
1.6 Significance of the study ... 5
1.7 Scope of the study ... 6
1.9 Conceptual framework ... 6
CHAPTER TWO: LITERATURE REVIEW ... 8
2.1 Soil and water conservation technologies ... 8
2.2 Effects of soil and water conservation technologies on soil properties ... 10
2.3 Factors influencing farmers use of soil and water conservation technologies ... 13
CHAPTER THREE: MATERIALS AND METHODS ... 15
3.2 Research design ... 17
3.3 Indemnification of soil and water conservation technologies ... 17
3.4 Evaluation of the effects of selected SWC technologies onKsat, OM and BD ... 17
3.4.1 Field experimental design ... 17
3.4.2 Soil sampling procedure and sample preparation ... 19
3.4.3 Laboratory analysis ... 20
3.4.3.1 Bulk density ... 20
3.4.3.2 Organic matter ... 20
4.4.4 In situ saturated hydraulic conductivity analysis ... 21
3.5 Determination of the factors influencing farmers’ use of soil and water conservation technologies ... 23
3.5.1 Population sample size determination ... 23
3.5.2 Sampling procedure ... 24
3.6 Data analysis ... 25
3.7 Pilot study ... 25
3.8 Selection and training of research assistants ... 26
3.9 Data management ... 26
3.10 Ethical consideration ... 26
CHAPTER FOUR: RESULTS AND DISCUSSIONS ... 28
4.0 Introduction ... 28
4.1. Soil and Water Conservation Technologies used in Maziba Sub-catchment ... 28
4.2 Effects of selected SWC technologies onKsat, organic matter and bulk density ... 36
4.2.1. Effects of trenches onKsat, organic matter and bulk density ... 36
4.2.2. Effects of mulching onOM, BD and Ksat ... 38
4.3. Factors influencing farmers use of soil and water conservation technologies. ... 40
4.3.1. Gender of respondents ... 41
4.3.3 Marital status of respondents ... 43
4.3.4 Education level of respondents ... 44
4.3.5. Size of land ... 45
4.3.6 Source of labour of respondents... 46
4.3.7. Land tenure ... 47
4.3.8. Farmland slope ... 48
4.3.9. Distance from home to farmland of respondents ... 50
4.3.10. Off-farm activities ... 51
4.3.11. Access and Sources of information to respondents ... 53
4.3.12 Causes of soil erosion ... 54
4.3.13. Rate of soil fertility ... 55
4.3.14: Farmers’ suggestion on use of soil and water conservation technologies ... 56
CHAPTER FIVE: ... 58
SUMMARY OF FINDINGS CONCLUSIONS AND RECOMMENDATIONS ... 58
5.0 Introduction ... 58
5.1 Objectives and Methodologies ... 58
5.2 Summary of Study Findings ... 58
5.3 Conclusions ... 59
5.4 Recommendations ... 60
5.5 Suggestions for Further Research in the study area ... 60
References ... 62
Appendix 1: Structured Questionnaire ... 69
Appendix 2: Key Informant Questionnaire ... 75
List of Figures
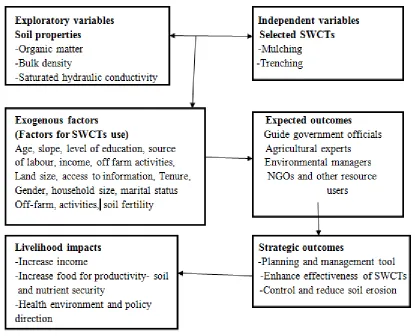
Figure 1.1: Conceptual and theoretical framework of soil and water conservation technologies
and soil properties………..………...7
Figure 3. 1: Map of maziba sub-catchment………...16
Figure 3. 2: Showing different landscape positions………...…18
Figure 3. 3: Experimental layout………...18
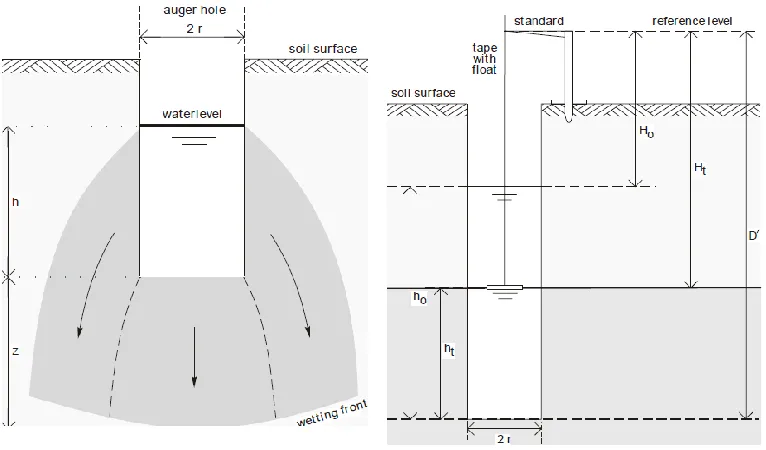
Figure 3.4: Inversed auger-hole method ………..22
Figure 4.1: Soil and Water Conservation Technologies identified in the study area……,..….…35
Figure 4. 2: Gender of respondents………....41
Figure 4. 3: Marital status of respondent………...44
Figure 4. 4: Education level of respondents………...………45
Figure 4. 5: Land tenure……….………..………..……48
Figure 4. 6: Slope of farmlands in maziba sub-catchment………...…………..…49
Figure 4. 7: Percentage of farmers’ involvement in off-farm activities………..…...52
Figure 4. 8: Access to information………..……...54
Figure 4. 9: Farmers response on the causes of soil erosion………..…....55
List of Tables
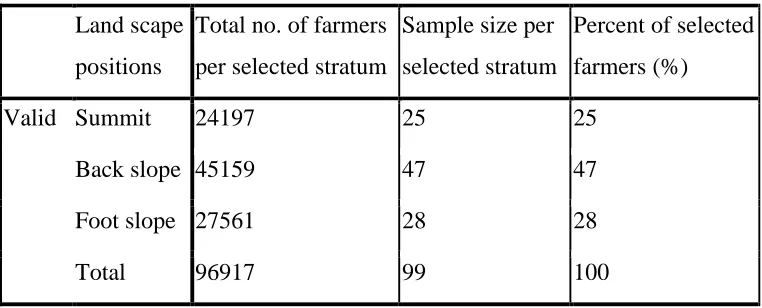
Table 3.1: Number of farmers selected per stratum………..24
Table 4.1: Farmers response on benefits of soil and water conservation technologies in %...35
Table 4. 2: Effects of trenches onOM, BD and Ksat………...38
Table 4.3: Effects of mulching onOM, BD and Ksat………..40
Table 4.4: Age of respondents………...42
Table 4.5: Size of land in Maziba sub catchment………..46
Table 4.6: Sources of labour on your farmlands………47
Table 4.7: Distance from home to farmland of respondents………..51
Table 4.8: Off-farm activities…...………...………..54
Table 4.9: Source of information of respondents.………..54
List of Plates
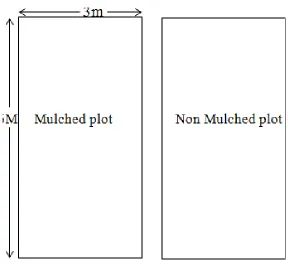
Plate 3. 1: Plate (A) shows mulched and (B) none mulched experimental plots…...………19
Plate 3. 2:Saturated hydraulic conductivity determination (in-situ)...23
Plate 4. 1: Terraces………..……….………..…………29
Plate 4. 2: Trench constructed on foot slope………..……...….……30
Plate 4. 3: Water catchment banks……….…...….31
Plate 4. 4: Level ditch……….…...32
Plate 4. 5: Tree plantations…….……….……….…..33
Plate 8:6 Distribution of Napier grasses (A) and Stalia grass (B)………...…34
Plate 4. 7: Mulching………...35
List of Equations
Equation 3.1………..……….……….…..20
Equation3.2………...………21
Equation 3.3……….………..………22
List of Abbreviations and Acronyms
AHI African Highland Initiative
BD Bulk Density
DWRM Directorate of Water Resources Management
FAO Food and Agriculture Organization
KIRBMD Kagera Integrated River Basin Management and Development
KRBMP Kagera River basin Management Project
Ksat Saturated hydraulic conductivity
MDGs Millennium Development Goals
MWE Ministry of Water and Environment
NBI Nile Basin Initiative
NEMA National Environmental Management Authority
NEPAD New Partnership for Africa’s Development
OM Organic Matter
SSA Sub-Saharan Africa
SWCTs Soil and Water Conservation Technologies
UBOS Uganda Bureau of Statistics
WCB Water catchment bank
Abstract
Soil and water resources are important for sustaining life on earth since they are the main components of sub catchment, however they are under threat of deterioration due to human activities (NEMA, 2011). Maziba sub catchment have high population pressure which have led to deforestation, over cultivation and wetland encroachment leading to soil erosion problems causing severe tension on soil and water resources while little attention is paid to their effects (NEMA, 2011). The purpose of the study was to analyze the effect of soil and water conservation technologies on soil properties in Maziba sub catchment of Kabale District, Uganda.The specific objectives of the study were to: (i) Identify soil and water conservation technologies used at different landscape positions by farmers in Maziba sub catchment, (ii) Evaluate the effects of selected soil and water conservation technologies on saturated hydraulic conductivity, organic matter and bulk density and (iii) Determine the factors influencing farmers’ use of soil and water conservation technologies in Maziba sub catchment. The study employed both descriptive and analytical research designs utilizing mixed methodologies. Probability sampling technique was used to select 99 respondents, who were selected to obtain predominantly used soil and water conservation technologies and socio-economic data using semi-structured questionnaire. Thirty six soil samples were collected from mulched and trenched plots at 0-5 cm depth using soil core to analyze BD and OM from the laboratory and Ksatwas measured in situ using inversed augur
hole technique. Statistical analysis of the data collected was done using statistical packages for social scientists (SPSS 16.0) and Microsoft Excel 2007. The results obtained from treatment (mulched plots) were compared to those of control (none mulched plots) from the same sub catchment and conclusions regarding the soil properties were drawn based on internationally acceptable standards. Descriptive statistics were used to describe soil and water conservation technologies practiced in the study area. Chi-square tests were used to test the association between socio-economic data and soil and water conservation technologies used by farmers. The study revealed that terracing (36.4%), mulching (21.2%) and trenching (13.1%) were the predominant soil and water conservation technologies reported. The study results indicated that plots under mulching and trenching (treatment) significantly affects the soil OM(4.45 %), Soil
BD(1.32 g /cm3) and Ksat(6.1310-2 cm/s) compared to results obtained from control plots
OM(3.31%), BD (1.45 g/cm3) and Ksat (11.9210-2 cm/s) which was all within acceptable range. The study further revealed that marital status of respondents, age of respondents, level of education, fertility of the soil, farmland slope, size of land and land tenure influenced farmers’ use of soil and water conservation technologies. The study recommends extensive use of mulching and trenching since they were proved to be effective in improvingOM, BDand Ksat
CHAPTER ONE: INTRODUCTION
1.1 Background to the study
Soil and water conservation technologies play a pivotal management role in many catchments of the world (Ouedraogo & Tiganadaba, 2015). This is simply because soil and water are the main natural resources in catchment areas essential to sustain life on earth. The reliable and scientifically proven soil and water conservation technologies include; ridge planting, zero tillage, crop rotation, strip cropping, grass strips, mulching, agroforestry, terracing, contour planting, cover crops, water harvesting, tree planting, digging trenches worldwide (Zlati & Todosijevi, 2012; World Overview of Conservation Approaches and Technologies (WOCAT), 2015).
New Partnership for Africa’s Development (2010), reported that soil and water resources in sub catchments greatly support various socio-economic developments such as agriculture, livestock keeping, food production, industrial production and rural development in most developing countries. Regardless of all these, degradation of soil and water resources is a major threat in many catchments of developing countries. Food and Agriculture Organization (FAO), 2010) reported that degradation of soil and water resources in Africa was at alarming phase. In a related study by Huckett (2013), noted that Sub-Saharan Africa (SSA) is characterized by high soil erosion and water quality degradation problems than any other part of the world. Economically, the problem of soil erosion in Africa is estimated to cause a damage of $26 billion each year to the productive soils of the continent (Lal, 2014). According to Angima et al. (2010), 5 million grams per hectare of productive soils are lost each year because of soil erosion on the continent. Uganda is among the countries mostly affected by soil erosion and water quality problems (AHI, 2009).
properties to support agricultural activities such as farming which is the source of livelihood to support farmers income (Okeyo et al., 2014).
In Uganda, land degradation is categorized into three main classifications namely: soil erosion, soil infertility, and soil pollution. These have been the major environmental problems since colonial rule (WOCAT, 2015). Factors such as population pressure, deforestation, overstocking of animals which lead to overgrazing, wetland encroachment, soil erosion, and climate change are regarded as major sources of catchment resource degradation. According to Ellis (2010), conservation technologies on soil and water resources began long ago over the last 50 years. This is evidenced by a large number of soil and water conservation technologies projects implemented in many developing countries including Uganda among others (AHI, 2009).
In Kigezi region south western Uganda, 90% of the total population depends on agriculture to sustain their livelihood which has increased cases of land degradation (NBI, 2014). This makes the area mostly affected than any other parts of the country. In a related study byFAO (2011) reports that, water catchment areas located in Kigezi highlands are hot spot zones for degradation because of raised terrain which is prone to soil erosion problems compared to flatter areas.
1.2 Statement of the research problem
Soil and water resources are important for sustaining life on earth since they are the main components of sub catchment, however they are under threat of deterioration due to human activities (NEMA, 2011). Maziba sub catchment have high population pressure which have led to deforestation, over cultivation and wetland encroachment leading to soil erosion problems causing severe tension on soil and water resources while little attention is paid to their effects (NEMA, 2011). This has posed threats to farmers’ economic development thus leading to low economic development of the country. Additionally, soil erosion has raised serious concerns on the future ecological functioning of ecosystems as well as sustainability of farmers’ livelihood in the region.
Despite the various soil and water conservation technologies introduced in the study area, farmers have variations in technology acceptance because of financial constraints and lack of adequate knowledge on how to use them. All the technologies such as mulching, water catchment banks, level ditches, grasses and tree planting are practiced under terraced farms but their contribution towards controlling soil erosion and improving soil properties have less been analyzed. It was against this background that the study analyzed the effect of soil and water conservation technologies on soil properties in Maziba Sub-catchment, Kabale-Uganda.
1.3 Justification of the study
The current research study contributes to the Government of Uganda’s campaign on conservation of soil, water, and other environmental resources meanwhile putting forward sustainable development goals in practice for the country (KRBMP, 2012). This enhances soil and water management of the sub catchment to increase agricultural productivity, direct policy makers and environmental protection for sustainable development targets to be achieved.
The basis of conducting this research was guided by a number of reasons. First, Maziba sub catchment has rapid population growth rate of 0.6% to 8.1% from 1969 to 2014 respectively (UBOS, 2014). Therefore, this situation increases soil and water degradation for land use activities in the study area. Secondly, the sub catchment generally experiences the problem of soil erosion due to its nature of the terrain being steep, with sharp sided valleys and heavy downpour during rainy seasons (Kabale District Local Government, 2012). Thirdly, Maziba sub catchment has little been researched on the aspect of the analysis of effect of soil and water conservation technologies on soil properties in maziba sub catchment. Hence, data on soil and water conservation technologies and their effects on selected soil properties are paramount in achieving efficient management of soil and water resources in Maziba sub-catchment.
1.4 Research questions
i. What are soil and water conservation technologies used on different landscape positions by farmers in Maziba Sub catchment?
ii. What are the effects of selected SWC technologies on saturated hydraulic conductivity (Ksat), organic matter (OM) and bulk density (BD) in Maziba Sub catchment?
1.5 General objective
The general objective of this study was to analyse the effect of soil and water conservation technologies on soil properties in Maziba sub catchment, Kabale District-Uganda.
1.5.1 Specific objectives
This study was based on the following specific objectives:
i. To identify soil and water conservation technologies used on different landscape positions in Maziba Sub catchment.
ii. To evaluate the effects of selected soil and water conservation technologies on (Ksat),
(OM) and (BD) in Maziba Sub catchment.
iii. To determine the factors influencing farmers’ use of soil and water conservation technologies in Maziba Sub catchment.
1.6 Significance of the study
To ensure sustainability of Maziba Sub catchment, analysis of soil and water conservation technologies in agricultural and environmental point of view is essential for proper planning and management of soil and water resources.
The result of this research would be beneficial to local and district officials as it will generate baseline information for further studies, research, and policy dialogue. The findings would facilitate monitoring and evaluation of soil and water conservation technologies being used in regards to their effects on soil properties in maziba sub catchment.
other resource users to control soil erosion from farmlands, improve the productivity of their agricultural land and sound performance of the environment.
1.7 Scope of the study
This study focused on the analysis of soil and water conservation technologies and their effects on saturated hydraulic conductivity, organic matter and bulk density in Maziba Sub catchment. Farmers, experts and unselected soil and water conservation technologies outside the study area and unselected soil properties were not considered for this study.
1.9 Conceptual framework
The conceptual framework (Figure 1.1) was used to analyze soil and water conservation technologies and their effects on selected soil properties (Ksat, OM andBD). Soil and water
conservation technologies were used as dependent variables. Exogenous factors were used as independent variables. The rate at which soil and water conservation technologies affect hydraulic conductivity, organic matter and bulk density greatly play a significant role in improving soil and water properties (Bagdi et al., 2015). According to FAO (1987), soil organic matter, bulk density and hydraulic conductivity play a significant role in improving water infiltration, maintains soil moisture, soil erosion control, run offs and land stabilization and soil fertility management in most parts of African highlands.
outcomes expected are; planning and management tool, enhance the use of soil and water conservation technologies, control and reduce soil erosion. The livelihood impacts expected are: increase income, food productivity and soil nutrient security.
CHAPTER TWO: LITERATURE REVIEW
This chapter reviewed past studies conducted on the Soil and water conservation technologies, effects of selected soil and water conservation technologies on selected soil properties and factors influencing farmer’s use of soil and water conservation technologies.
2.1 Soil and water conservation technologies
Soil and water conservation technologies play a big role in reducing the effects of soil erosion in many catchments while maintaining soil and water quality and quantity (Adimassu et al., 2013). Soil and water conservation technologies are made up of any set of measures and practices in order to ensure soil functions for long-term by humans and nature. Soil and water conservation technologies can be divided into mechanical, biological and vegetative technologies ( Nyborg & Paudel, 2008; Schmidt & Zemadim, 2015). Mechanical technologies control soil erosion after the soil starts moving. Vegetative technologies prevent erosion by intercepting raindrops and thus prevent erosion process to take place. Vegetative technologies commonly used as soil and water conservation technologies include; grass strips planted perpendicular to the hill slope or associated with terraces and tree rows. Agroforestry practices consist planting trees with crops and bushes for fodder and wood products. These are widely adopted and play a great role to enrich soils by fixing atmospheric nitrogen (Khanal, 2011).
2015). One-time investments are mainly mechanical in nature (Schmidt & Zemadim, 2015). They require a one-time investment of labour, capital and afterward recurrent maintenance activities. It often involves modification of the slope such as; terracing, and prevent runoff water through infiltration ditches, benches, trenches, hedgerows among others. The major benefits of erosion control are to conserve water, retain soil nutrients, soil moisture, and organic matter as well as maintain soil depth and soil structure (Alemu et al., 2013).
Generally, there are soil and water conservation technologies on erosion control, soil fertility management and quality enhancement practices that are used by agriculturalists across many continents in the world including Africa. Mugonola et al. (2013) report mulching, tied ridges, agroforestry as the predominantly used SWC technologies in Rwizi sub catchment in Mbarara district, Uganda. This has been also emphasized by other studies Barungi et al. (2013) from other parts of the country. According to the studies by Huckett (2013) and Obando et al. (2012) in Njoro and Ngaciuma Sub catchments respectively, it was found out that crop residues, fanya juu, tree planting, and terraces are the main soil and water conservation technologies used.
In Rwanda, the main soil and water conservation technologies commonly used by most of the farmers are; terraces, growing of grass strips (Stalia) along the contours, agroforestry, crop rotation, mulching and fertilizer application (Teshome et al., 2013). In Ethiopian highlands, stone lines, Stover bounding, and terraces have been reported as predominantly used soil and water conservation technologies (Kato & Bryan, 2009; Alemu et al., 2013).
al., 2012). The study, however, did not characterize soil and water conservation technologies in Usambara highland and the current study, therefore, seeks to fill the gap with the information.
2.2 Effects of soil and water conservation technologies on soil properties
Soil organic matter and bulk density is the main indicator of soil quality both as a single soil or compound (SOM) attribute was reported (FAO, 1987). The total organic carbon is the carbon stored in soil organic matter; organic carbon enters the soil through the decomposition of plant and animal residues, root exudates, living and dead microorganisms, and soil biota (Nelson & Sommers, 1982). SOM is the organic fraction of soil exclusive of non-decomposed plant and animal residues. USDA (1998) has indicated that the distribution of SOM, expressed as organic carbon, is 38% in trees and ground cover, 9% in the forest floor and 53% is in the soil including the roots plus the SOM associated with soil particles. Soil organic matter is about 58% carbon; therefore, soil organic matter conversions can be made by taking soil C values and dividing by 0.58 or multiplying by 1.72.
Wheaton & Monke (2011) reported that soil and water conservation technologies are promoted as the best soil and water management practices for effective soil and water conservation. The effects of soil and water conservation technologies in sub catchments have long been studied. Results suggest that these technologies generally reduce agricultural surface runoff and soil erosion, improve soil properties as well as decrease the need for fertilizer and pesticide application (Adgo et al., 2013). For instance, terracing changes the landscape, directly affect local hydrology and runoff characteristics. In addition, terraces indirectly affect soil organic matter and other soil characteristics (Chow et al., 2011). Terracing has only an effect on water erosion; it does not stop or reduce the impacts of wind erosion.
Mulching has for long been recommended by different scholars as the one of the best soil and water conservation technology. It is a useful technology in soil erosion control, control soil temperature by providing a shield for the soil, reduces water loss through evaporation, improve soil bulkiness and increases soil organic matter (Diaz et al. (2005; Maiga, 2012; Kaliisa et al. 2012; (Okeyo et al.
2014; Zhang et al. 2016) noted that mulching reduces water loss through evaporation by 92% and 52% on 10 and 2 cm mulch thickness respectively. Mulch thickness has an effect on the amount of moisture retained in the soils hence improving hydraulic conductivity.
A study by Njomo (2013) reported that the hydraulic or water content of soil mulched with artificial materials ranged from 37 cm2 to 45 cm2 at 15-30 cm soil depth. In the control experiment, moisture content values ranged from 27 cm2 to 31 cm2. Chiroma et al. (2008) revealed 22.2 cm2 as the highest soil moisture retained at 7.5 cm depth using artificial mulches.
productivity (Nyombi, 2013). A study by Rubaihayo et al. (2000), ranked soil moisture from mulching ahead of soil fertility and pest management as an important supplier to food productivity. The study further showed high production (66%) due to high soil moisture because of mulching. However, none of the studies established the effects of mulches and trenches on saturated hydraulic conductivity, bulky density, and organic matter.
Trenches are excavated at selected landscape positions to control soil erosion at a slope above 5 %. Trenches are reported successful technologies in controlling water erosion in affected regions (Sussman, 2007). They are usually set up above valleys to divert runoff from runways, farms, hill tops, buildings and plantations (Sussman, 2007). The collected runoff slowly percolate into the soil via sides and bottom of the trenches for a period not more than three days in hilly or mountainous areas (Sussman, 2007).
A study conducted by Widomski (2009) on Japanese fruit farm cultivating Satsuma mandarin seedlings revealed that trenching was a successful technology in controlling erosion by approximately 88.2%. According to Widomski (2009), the highest efficiency of trenches in controlling soil erosion was 88.2% in 2002 and 94.7% in 2003 in the same area of study.
2.3 Factors influencing farmers use of soil and water conservation technologies
There are several factors influencing farmers use of soil and water conservation technologies which are analyzed by different scholars ( Huckett, 2013; Abdul-hanan et al., 2014). Their studies show that farmers use soil and water conservation technologies are influenced by socio-economic factors such as education, age, labour availability, income and household size of different farmers. Chomba (2004) considered investments in education by building management capacity through farmer field schools as this would improve the use of soil and water conservation technologies.
A study by Pedzisa et al. (2015) also reported that education of farmers’ increases experience to technology users and this reduces labour supply in conservation agriculture. The major outputs show that the experienced farmers in conservation agricultural were able to save five days of basin management time compared to inexperienced farmers. Pedzisa et al. (2015) pointed out that conservation agricultural technologies are knowledge intensive and hence complex technologies. Therefore, the level of education was hypothesized to be positively associated with the use of soil and water conservation technologies.
A study by Obando et al. (2012) in Ngaciuma sub catchment revealed that older farmers were using SWC technologies than their younger counterparts. This was attributed to the fact that old farmers are more experienced in conservation agriculture than younger farmers. Therefore, the age of farmers has a direct influence on the use of soil and water conservation technologies.
off-farm activities creates competition for resources such as time, labour and interest required to install and maintain conservation technologies. Workineh et al. (2015) established that lack of access to cash or financial credit may hamper smallholder farmers from using soil and water conservation technologies that require initial capital.
According to FAO (2011), the settlement of farmers at one place has an important implication on access or control of resources and long term investment on the farm. A migrant with short stay on the land will be unwilling to invest capital and labour in practices of which the effects can only be realized after a long period of time. Farmers are not likely to invest on a land whose long term access is not secured. The hired land especially when it is rented for 2-3 years can be a constraining factor for use of soil and water conservation practices because the land owner might need the land back when the soil fertility has distinctly improved and crop production has increased (Njomo et al., 2013). A study by ICRAF Uganda in 2005 on the policy environment of Conservation Agriculture with Trees (CAWT) in Western Uganda, found that security of land tenure offered the best motivation for them to use of soil and water conservation practices.
CHAPTER THREE: MATERIALS AND METHODS
3.0 Introduction
This chapter describes materials and methods used during the study, and they include: the study area, experimental design, field data collection methods, statistical and laboratory analysis techniques.
3.1 Study area
The study was carried out in Maziba sub catchment, kabale district southwestern Uganda covering a total area of 144 km2 (Figure 3.1). The sub catchment lies between latitude of 1o15.30'' South and 29o 56''East, towards the southern boundary of Uganda with Rwanda. It has a total population of 96,917 with 6,975 households (UBOS, 2014). Approximately 90% of the population are small-scale farmers (NBI, 2014). The sub-catchment has a mean annual temperature of 19oC and experiences bimodal rainfall with less than 1,200 mm mean annual rainfall (NEMA, 2012).
The terrain is characterized by high hills dissected by steep-sided valleys, with altitude ranging between 1,200 - 3,600 m above sea level (KDLG, 2012). With such steep gradients and high altitude, there is a generation of high and erosive run-off resulting in severe soil erosion. This soil erosion process has been largely accelerated by human activities such as over-cultivation of land, overstocking of animals, bush burning, deforestation, and wetland encroachment (KDLG, 2012).
Figure 3.1: Map of maziba sub-catchment
3.2 Research design
The research involved both field and laboratory experiments for objective two and socio-economic survey for objectives one and three.
3.3 Indemnification of soil and water conservation technologies
To identify soil and water conservation technologies used by farmers in maziba sub catchment, the study used observation research guide (Appendix 3.0) and structured questionnaires to 99 farmers (Appendix 1.0). Furthermore, a digital camera was used to capture predominantly used soil and water conservation technologies from the study area. This gave the researcher an opportunity to identify the predominantly used soil and water conservation technologies in the study area.
3.4 Evaluation of effects of selected SWCTs onKsat, OM and BD
3.4.1 Field experimental design
laboratory. Ksat was determined in-situ on experimental plots using inversed auger hole method as described by (Mulqueen & Rodgers, 2001).
Figure 3.2: Showing different landscape positions
Plate 3.1: Plate A shows Mulched and B shows None Mulched experimental plots
3.4.2 Soil sampling procedure and sample preparation
Soil samples were collected randomly at the depth of 0-5 cm using soil core at 18 sampling points on the 18 selected experimental plots measuring 36m from the three slopes. The collected soil samples were carefully placed in polyethene bags and transported to Makerere University soil science laboratory for analysis. Soil samples were oven-dried at 105 ºC for 24 hours in shallow wooden trays in a well-ventilated place protected from rain and contamination. All soil samples were ground and made to pass through a 0.5 mm sieve after all the gravel, live and dead organic residues have been removed. A representative soil sample of approximately 500 g was retained by cone and quartering. This representative sample was then analyzed of organic matter and bulk density.
3.4.3 Laboratory analysis
3.4.3.1 Bulk density
A total of 18 composite soil samples were collected from the field using soil core and taken to the laboratory for analysis of bulk density using the core method as described by (Okalebo et al., 2002). The soil around soil core was removed and the soil beneath the core was cut off using a knife. Both ends of the soil core were trimmed and flushed with a straight edge knife. The soil samples were oven dried to a constant heat using the WTC Binder Oven at 105oC for 24 hours. The soil bulk density was then calculated using the formula in equation 3.1 as shown below:
V M
BD ……….…………...………….3.1
Where by:
“BD” is bulk density in g/m3
“M ” is mass of oven dry soil in g and
“V ” is volume of core cm3
3.4.3.2 Organic matter
the stream into the suspension. The flasks were swirled gently at first until all soil and reagents mixed and then more vigorously for about one minute. They were then allowed to stand for exactly 30 minutes. About 150 ml of distilled water was added and allowed to cool, after which 10 ml 85% ortho-phenanthroline monohydrate and finally 10 drops diphenylamine indicator were added. The solutions were titrated with 0.5 N ferrous ammonium sulphates. Organic matter was then calculated (Cottenie, 1980; Okalebo, 1990; Ali & Jenkins, 1995) using Equation 3.2.
OM ( bt x0.3x conc.FeSo4 x1.72x1.22)0.5………...3.2
Where by:
“OM” is organic matter
“bt” is black titre
“conc.FeSo4” is concentrated ferrous ammonium sulphate
4.4.4 In-situ saturated hydraulic conductivity analysis
of water in the hole is equal to the amount of water flowing out of the hole with a unit gradient and this through the bottom and the sidewalls of the hole, Ksat was calculated as per the equation 3.3.
r Ksat1.15
t
r ht r
ho /2) log( /2)
log(
………3.3
Where by:
“Ksat” is saturated hydraulic conductivity
“t” = time since the start of measuring (s)
“ht”= the height of the water column in the hole at time t (cm)
“ho”= ht at time t = 0 (Nwokocha et al., 2007; Torfs, 2008)
.
Plate 3.2:Saturated hydraulic conductivity determination (In-situ)
3.5 Determination of factors influencing farmers’ use of soil and water conservation technologies
3.5.1 Population sample size determination
……….………. …….3.4
Where: “n” is the desired sample size, “N” is the population size 96917 (UBOS, 2014), and “e”
is the precision level (10 % [standard value of 0.01] at 90 % confidence level). Therefore:
) 01 . 0 ( 96917 1 96917 n 99
3.5.2 Sampling procedure
The study adopted probability sampling technique in which stratified random sampling was used to select sample population from the area of study. Then, simple random sampling was conducted from each stratum to select sample size. The basis of the study to form strata was the fact that the population within the sub catchment is distributed on different landscape positions which are foot slope, back slope, and summit. With this sampling procedure, a proportionate stratified random sampling based on equal proportions of each landscape was employed as shown in table 3.1.
Table 3.1: Number of farmers selected per stratum
Land scape positions
Total no. of farmers per selected stratum
Sample size per selected stratum
Percent of selected farmers (%) Valid Summit 24197 25 25
Back slope 45159 47 47 Foot slope 27561 28 28 Total 96917 99 100
researcher also interviewed 10 key informants who are well informed about soil and water conservation technologies used in the study area for example agricultural officers (Appendix 2.0). This gave the researcher an opportunity to determine the factors influencing farmers’ use of soil and water conservation technologies in the study area.
3.6 Data analysis
The data obtained from the socio-economic survey, field and laboratory experiments was entered in Microsoft office Excel 2007 and SPSS 16.0 for statistical analyses. The Summary statistics such as frequencies, percentages, error bar graph and pie charts were generated for interpretation and analysis. Descriptive statistics were used to explain the soil and water conservation technologies and socio-economic data from the Maziba Sub catchment. Chi-square tests were used to test the association between socio-economic factors and the soil and water conservation technologies used by farmers.
3.7 Pilot study
3.8 Selection and training of research assistants
Three research assistants were identified and selected from Maziba Sub catchment. The condition for selection was based on knowledge about the subject matter, fluency in English and local language (Runyankore-Rukiga) and being familiar with the geographical location of the study area to ease movement. The research assistants were trained for two days on the techniques of questionnaire interpretation and administration. The training also involved translating the questions into the local language (Runyankore-Rukiga) which was also followed by a pairwise testing exercise of the interview in order to ensure consistency in the way questions was to be administered.
3.9 Data management
Filled questionnaires were checked for completeness at the end of each data collection day to identify any missing data before leaving the field. Soil samples were diligently labeled and transported to the laboratory for analysis. Soil samples were stored at room temperature before they were analyzed.
3.10 Ethical consideration
CHAPTER FOUR: RESULTS AND DISCUSSIONS
4.0 Introduction
This chapter presents the results and discussion of findings from the field survey, in situ
experiments and laboratory analyses conducted in Maziba sub catchment Kabale District southwestern Uganda. Results on the predominantly used soil and water conservation technologies and their effects on saturated hydraulic conductivity, bulk density, and organic matter and factors for their use are discussed in this chapter.
4.1. Soil and Water Conservation Technologies used in Maziba Sub catchment
This section describes the predominantly used soil and water conservation technologies in Maziba Sub catchment and seeks to respond to the first objective of the study.
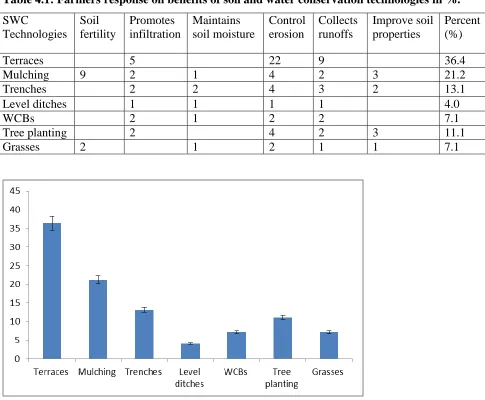
The findings of the study revealed that majority of respondents were using terracing (36.4%). Other technologies reported include mulching (21.2%), trenching (13.1%), water catchment banks (7.1%), level ditches (4%), tree plantations (11.1%) and Grasses (7.1%) as shown in table 4.1 and figure 4.1.
is one of the productive parts of Kabale district. These findings are in line with Kaliisa et al.
(2012), who reported that terraces (53%) were the dominant form of mechanical SWC technology along the different slope positions of Bufundi Sub-catchment in Kabale district. Amsalu and Graaff, (2006) also revealed that terraces are a good measure for conserving soil and water resources in Ethiopian highland watersheds.
Plate 4.1: Terraces (Source: Author 2016)
Plate 4.2: Trench constructed on foot slope (Source: Author 2016).
Plate 4.3: Water catchment banks (Source: Author 2016).
Plate 4.4: Level ditch (Source: Author 2016)
Plate 4.5: Tree plantations (Source: Author 2016).
The study findings again indicated 7.1% of respondents were using grasses in the study area to stabilize terraced lands by promoting water infiltration and reducing water rate that can result into soil erosion on their land hence conserving soil and water resources against soil erosion.
Plate 4.6: Distribution of Napier grasses (A) and Stalia grass (B) (Source: Author 2016)
The study findings further revealed that 21.2 % of respondents they use mulching to reduce soil erosion on their land resources, hence conserving soil and water resources against soil erosion. The reported benefits of mulching were; it controls erosion and runoffs from washing off the top soils, soil fertility management, improve soil properties, reduce evaporation, soil moisture retention and promote infiltration. Zhang et al. (2016) asserted that mulching is effective in controlling soil erosion once integrated with other technologies such as terracing. In a related study, Mtambanengwe et al. (2015) observed that 41% farmers did not use Tephrosia candida because it was only used as mulch and had no direct benefit as fodder.
Plate 4. 7: Mulching.
Table 4.1: Farmers response on benefits of soil and water conservation technologies in %.
SWC
Technologies Soil fertility
Promotes infiltration
Maintains soil moisture
Control erosion
Collects runoffs
Improve soil properties
Percent (%)
Terraces 5 22 9 36.4
Mulching 9 2 1 4 2 3 21.2
Trenches 2 2 4 3 2 13.1
Level ditches 1 1 1 1 4.0
WCBs 2 1 2 2 7.1
Tree planting 2 4 2 3 11.1
Grasses 2 1 2 1 1 7.1
4.2 Effects of selected SWC technologies onKsat, organic matter and bulk density
This section of research seeks to respond to the second objective of the study. For this matter, therefore, trenching and mulching soil and water conservation technologies were selected because they were repeatedly reported by majority of respondents, 34.3 % during the field study survey in the study area. Their effects on selected soil properties, for example, saturated hydraulic conductivity; bulk density and organic matter are discussed in subsequent sub-sections.
4.2.1. Effects of trenches onKsat, organic matter and bulk density
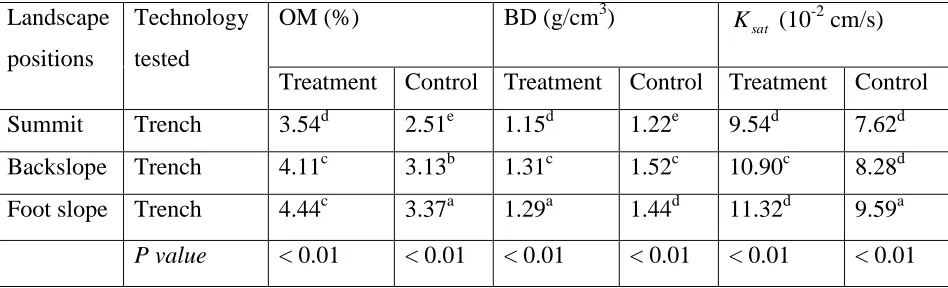
As shown in table 4.2, trenches significantly affectedOM, BD and Ksat at the foot slope, back slope, and summit (0.01). The mean OMvalues recorded on treatment sites at foot slope, back slope and summit were 4.44%, 4.11%, and 3.54%, respectively. Whereas on the control sites, the mean values recorded were 3.37%, 3.13% and 2.51% at foot slope, back slope, and summit respectively. OM values for both treatment and control experimental sites were within the set standards for retaining water in soils (>3%) ( Cottenie, 1980; Okalebo et al. 2002; Loveland &Webb, 2003; Musinguzi et al., 2013). Organic matter is important for retaining water in the soils, adsorb and hold positively charged ions, maintain soil structure and maximize nutrient retention.
The mean BDvalues on treatment sites recorded were 1.29 g/cm3, 1.31 g/cm3 and 1.15 g/ cm3 at the foot slope, back slope, and summit, respectively. Whereas the mean BDvalues recorded on control sites were 1.44 g/cm3, 1.52 g/cm3, and 1.22g/cm3 at foot slope, back slope, and summit, respectively.
The bulk density values on both treatment and control experimental sites were below critical values (<1.7 g/cm3). Bulk density (<1.7 g/cm3) allows water infiltration, root penetration improves soil porosity and soil organisms’ activity which influence soil properties and productivity (USDA, 1998; George et al., 2013). According to Chaudhari et al. 2013), the decrease in bulk density increases the value of soils in terms of productivity and quality because plant roots and water penetrates easily in soils with low bulk density than compacted soils. All the values recorded for bulk density are within the guideline values of <1.7 g/cm3 for soils predetermined by (Cottenie, 1980; USDA, 1998; Okalebo et al., 2002). The study findings concur with Reichert et al. (2009) who reported that bulk density was found to be highly on top slope soils for crop production in tropics than on lowland plots with soil and water conservation technologies.
The mean Ksatvalues recorded on treatment sites were 11.3210 -2
cm/s, 10.9010-2 cm/s and 9.5410-2 cm/s at the foot slope, back slope, and summit, respectively. Whereas, the mean
sat
K values recorded on control sites were 9.5910-2 cm/s, 8.2810-2 cm/s and 7.6210-2 cm/s at foot slope, back slope, and summit, respectively in the study area. The saturated hydraulic conductivity (Ksat) values on both treatment and control experimental sites were within set
All the values recorded for saturated hydraulic conductivity are below critical values <20 cm/s for soils in highland areas (USDA, 1998).
Table 4. 2: Effects of trenches onOM, BD and Ksat
Landscape positions
Technology tested
OM (%) BD (g/cm3) Ksat (10-2 cm/s)
Treatment Control Treatment Control Treatment Control Summit Trench 3.54d 2.51e 1.15d 1.22e 9.54d 7.62d Backslope Trench 4.11c 3.13b 1.31c 1.52c 10.90c 8.28d Foot slope Trench 4.44c 3.37a 1.29a 1.44d 11.32d 9.59a
P value < 0.01 < 0.01 < 0.01 < 0.01 < 0.01 < 0.01
Means with the same letter in each column are not significantly different at p<0.01
4.2.2. Effects of mulching onOM, BD and Ksat
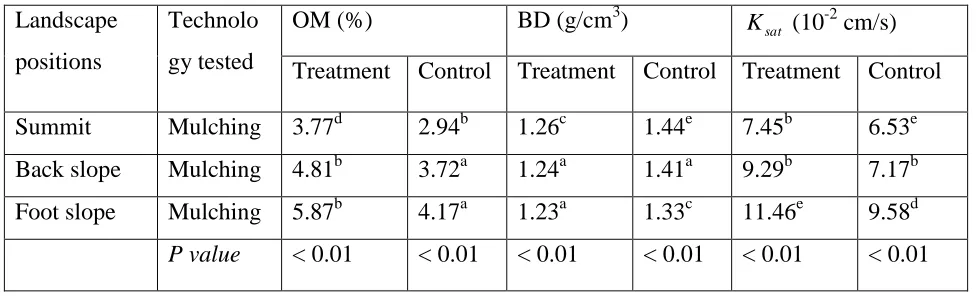
Table 4.3 presents the effect of mulching onOM, BD andKsat. The mean values of OMrecorded
on treatment sites at foot slope, back slope and summit were 5.87%, 4.81%, and 3.77%, respectively. Whereas on the control sites, the mean OMvalues recorded were 4.17%, 3.72% and 2.94% at foot slope, back slope, and summit respectively. OM is one of the important parameters used to assess the quality of soils. The OMlevels in all the sampled experimental sites were above 3% guideline value prescribed by (FAO, 1987).
increase in organic matter at the bottom slope could be attributed to the accumulation of minerals that have been eroded from the summit and back of sloppy positions.
The study further recorded 1.23 g/cm3, 1.24 g/cm3, and 1.26 g/cm3 as the mean BDvalues recorded at the foot slope, back slope, and summit, respectively. The mean BDvalues recorded on control sites were 1.33 g/cm3, 1.41 g/cm3, and 1.44 g/cm3 at foot slope, back slope, and summit, respectively. The findings of the current study lie within the ideal bulk density for controlling soil erosion since it has the capacity to improve infiltration (Table 4.3). This reveals that soils within the study area are considered to be good and health since the measured bulk density is within set standards <1.7 g/cm3 (Cottenie, 1980; Chaudhari et al. 2013). The study findings agree with Agim (2015) who reported that bulk density was found to be higher at the upper sloppy lands than bottom lands. Jacobs et al. (2015) reported that the increase in bulk density at the top of slopes could be attributed to the low levels of organic matter, and high organic matter levels at the bottom slope are caused by the accumulation of organic minerals eroded from the top and middle slopes.
Saturated hydraulic conductivity is essential to measure infiltration in order to know drainage, infiltration level and pollutant transport in agricultural fields (USDA, 1998). However saturated hydraulic conductivity improves nutrient flow and water storage in sub catchments (Dumanski & Peiretti, 2013). The Saturated hydraulic conductivity level in all the sampled experimental sites was below 20 cm/s guideline value prescribed by (USDA, 1998).
The mean Ksatvalues recorded on treatment sites were 11.4610-2 cm/s, 9.2910-2 cm/s and 7.4510-2 cm/s at the foot slope, back slope, and summit, respectively. The mean Ksatvalues on
control sites recorded were 9.5810-2 cm/s, 7.1710-2 cm/s and 6.5310-2 cm/s at foot slope, back slope, and summit, respectively in the study area. The saturated hydraulic conductivity (Ksat)
1998). The low levels of saturated hydraulic conductivity 6.5310-2 cm/s in the sampled experimental sites may be due to presence of soil and water conservation technologies. These findings are in agreement with Zhang et al. (2015) who reported that soil properties were found to be minimal at the summit of slopes compared to the accumulation zone of sloppy areas. Xiukang et al. (2015) noted that mulching is efficient in maintaining water infiltration in tropics.
The high mean values ofOM, BD and Ksat in the accumulation zone could be attributed to the presence of soil and water conservation technologies that control and collects eroded organic minerals and sediments from the summit and back slopes. Basing on the study results, all the plots visited can be classified as good and health since the sampled soils are within the set guidelines.
Table 4.3: Effects of mulching onOM, BD and Ksat
Landscape positions
Technolo gy tested
OM (%) BD (g/cm3) Ksat (10-2 cm/s)
Treatment Control Treatment Control Treatment Control Summit Mulching 3.77d 2.94b 1.26c 1.44e 7.45b 6.53e Back slope Mulching 4.81b 3.72a 1.24a 1.41a 9.29b 7.17b Foot slope Mulching 5.87b 4.17a 1.23a 1.33c 11.46e 9.58d
P value < 0.01 < 0.01 < 0.01 < 0.01 < 0.01 < 0.01
Means with the same letter in each column are not significantly different at p<0.01
4.3. Factors influencing farmers use of soil and water conservation technologies.
4.3.1. Gender of respondents
The findings revealed that majority of respondents 64.6 % were females and the remainder 36.4 % was males (Figure 4.2). The high dominance of female respondents can be linked to the belief that female farmers are caretakers of land resources in the study area since they are actively involved in agricultural activities and management of water resources such as water harvesting and tree planting. The small percentage of male farmers 36.4 % in soil and water conservation can be linked to engagement in off-farm activities such as teaching, providing security services, trade, and commerce which are time demanding and leaves little or no time to participate in soil and water conservation. The study findings showed no relationship between gender and the use of soil and water conservation technologies in the sub-catchment (2 = 2.837, d.f = 6, p = 0.829). This is in agreement with Tenywa &bekunda (2008), who reported no evidence relationship between gender and use of terraces for soil and water conservation in sub-Saharan Africa. The findings further support the idea suggested by John & Tenge (2015) who reported that if women were to be given equal opportunity to resource access and information on soil and water conservation, they would contribute much towards erosion control than men.
4.3.2. Age of respondents
As shown in Table 4.4, majority respondents 96% were aged between 18−49 years compared to 4 % that were above 50 years. This shows that farmers within the age bracket of 18 − 49 are seen as very active inhabitants in soil and water conservation than those above 50 years of age (FAO, 2011). Miiro (2011) reported that age is one of the social factors influencing farmers to use soil and water conservation technologies in Kigezi highlands. This disagrees with the perception that older farmers are more likely to use soil and water conservation technologies because of their experience in farming and having benefited from them before than young farmers (Beatrice et al., 2014). On the other hand, it is also possible that because of the technologies being time and labour demanding, older farmers may not be possible to use them because they are not likely to get actively involved in long-term technologies since their planning horizon is limited compared to young ones. The study findings showed evidence relationship between age and use of soil and water conservation technologies in the study area (χ2 = 22.135, d.f = 18, P = 0.026). This means that age of farmers is correlated to the use of soil and water conservation technologies used in the study area. The study findings agree with Obando et al. (2012) who reported a relationship between age and use of soil and water conservation technologies in Ngaciuma sub-catchment in Kenya.
Table 4.4: Age of respondents
Frequency Percent
Valid Percent
Cumulative Percent Valid 18-28 26 26.3 26.3 26.3
4.3.3 Marital status of respondents
Figure 4.3: Marital status of respondents
4.3.4 Education level of respondents
The study findings revealed that 39.4% of respondents had not attained any form of education, 45.5% completed primary level, 10.1% completed secondary school and 5.1% attained tertiary education (Figure 4.4). The level of education is related to use of soil and water conservation technologies whereby educated farmers 59.6% could be more informed on the best soil and water conservation technologies than uneducated farmers 39.4% since they are assumed to be aware of the benefits coming from soil and water conservation technologies. The chi-square test showed a significant relationship between education and the use of soil and water conservation technologies (χ2
=18.457, d.f= 18, P = 0.026). This implies that the level of education is related to the use of soil and water conservation technologies by farmers. The study findings concur with Nkonya & Andersson (2015) who reported that level of education significantly influenced the use of technological innovations in agriculture in Nepal. In a related studies by Miiro (2011) and Teshome
Figure 4.4: Education level of respondents
4.3.5. Size of land
Table 4.5: Size of land in Maziba sub catchment
Frequency Percent
Valid Percent
Cumulative Percent Valid Below 1 ha 59 59.6 59.6 59.6
1-2ha 30 30.3 30.3 89.9 3-4ha 7 7.1 7.1 97.0 5ha above 3 3.0 3.0 100.0 Total 99 100.0 100.0
Source: Author, 2016
4.3.6 Source of labour of respondents
Table 4.6: Sources of labourof respondents
Frequency Percent
Valid Percent
Cumulative Percent Valid Family labour 86 86.9 86.9 86.9
Hired labour 11 11.1 11.1 98.0 Community
labour 2 2.0 2.0 100.0 Total 99 100.0 100.0
Source: Author, 2016
4.3.7. Land tenure
reported that land tenure influences farmers’ decision to use soil and water conservation technologies in Ngaciuma-Kenya and Kabale-Uganda, respectively. Additionally, the study findings agree with Chilot & Hassan (2013) who reported no relationship between land tenure and use of soil and water conservation technologies in central Ethiopian highlands.
Figure 4.5: land tenure
4.3.8. Farmland slope
conservation technologies on the identified slopes depends on the land position. For example, trenches 13.1% were dominating on the back slopes and terraces 36.4% dominated on the three identified landscape positions while mulching 21.2% was also dominate on the foot and back slopes of the sub-catchment. The study results are supported by Barungi et al. (2013) and Teshome et al. (2012), who reported that, the nature of slope is linked with the use of soil and water conservation technologies in eastern Uganda and Ethiopian highlands, respectively. When subjected to chi-square test, it yielded a significant relationship at 90 percent confident interval (χ2 = 13.917, 12, p = 0.006). This implies that use of soil and water conservation technologies in the sub catchment dependent on farmland slope.
Plate 3.8: Farmland slope (source: Author, 2016)
4.3.9. Distance from home to farmland of respondents
farmlands had cases of soil erosion than farmlands nearness to farmers homes. For example, results reported by Nkonya & Anderson (2015) show that farmers are less likely to use mulching or household wastes on distant farmlands than closer farmlands to their homes.
Table 4.7: Distance from home to farmland of respondents.
Frequency Percent
Valid Percent
Cumulative Percent Valid Less than 1Km 60 60.6 60.6 60.6
1-2Km 23 23.2 23.2 83.8 3-4Km 11 11.1 11.1 94.9 Above 5Km 5 5.1 5.1 100.0 Total 99 100.0 100.0
Source: Author, 2016
4.3.10. Off-farm activities
which is used in paying school fees for their children, buying cloth and other human needs since agriculture is seasonal in nature and could not help them during off season in Bufundi sub-catchment Kabale district, Uganda. This indicates that any category of off-farm activity is independent of neither invest time nor finance in soil and water conservation technologies.
Figure 4.7: Percentage of farmers’ involvement in off-farm activities Table 4.8: Off-farm activities of respondents
Frequency Percent
Valid Percent
Cumulative Percent Valid Minibuses 9 9.1 9.1 9.1
Civil services 4 4.0 4.0 13.1 Charcoal
burning 2 2.0 2.0 15.2 Brick making 2 2.0 2.0 17.2 Security services 3 3.0 3.0 20.2 Agriculture only 79 79.8 79.8 100.0 Total 99 100.0 100.0
4.3.11. Access and Sources of information to respondents
As shown in figure 4.8, majority respondent 96% had no access to information only 4% of respondents reported they had access to information on soil and water conservation services when needed. Although 4% of the farmers had access to information, its transfer and dissemination were limited due to the fact that the ration of farmers to extension agents is significantly high. Basing on the results of the study, it is observed that 96% of farmers do not have access to information which means they are still using either indigenous knowledge or traditional practices which are not sustainable to environmental conservation and management against soil erosion.
Figure 4.8: Access to information of respondents Table 4.9: Sources of informationof respondents
Frequency Percent
Valid Percent
Cumulative Percent Valid Fellow farmers 63 63.6 63.6 63.6
Extension agents 26 26.3 26.3 89.9
NGOs 6 6.1 6.1 96.0
Non 4 4.0 4.0 100.0
Total 99 100.0 100.0
Source: Author, 2016
4.3.12 Causes of soil erosion
Satriawan, Harahap & Karim (2015) who reported that sheet and rill erosion are considered as the most common types of soil erosion on cultivated farmlands in the steep slopes of Rwanda and Ugandan highlands. Morgan (2009) also confirmed that heavy rainfall causes soil erosion on agricultural lands where soil and water conservation structures are not installed most especially in steep and gentle slopes.
Figure 4.9: Farmers response on the causes of soil erosion
4.3.13. Rate of soil fertility
water conservation technologies in the study area. When subjected to chi-square test, it showed a relationship at 90 percent confident interval (χ2 = 23.033, 18, p = 0.149). This implies that use of soil and water conservation technologies in the sub catchment dependent on fertility of the soils.
Figure 4.10: Rate of soil fertility
4.3.14: Farmers’ suggestion on use of soil and water conservation technologies
Table 4.10: Farmers’ suggestion on use of soil and water conservation technologies
Frequency Percent
Valid Percent
Cumulative Percent Valid Technical support 28 28.3 28.3 28.3
Training and education 50 50.5 50.5 78.8 Provision of Incentives 11 11.1 11.1 89.9 Awareness and
sensitization 6 6.1 6.1 96.0 Demonstration farms
and loans 4 4.0 4.0 100.0 Total 99 100.0 100.0
CHAPTER FIVE:
SUMMARY OF FINDINGS CONCLUSIONS AND RECOMMENDATIONS 5.0 Introduction
This chapter is divided into four major sections. The first section presents a summary of the research objective and methodology used in this study. The second section summarizes major key findings of the study and is presented as per objective of the research study. The third section concludes the study and finally, the fourth section provides major recommendations for further research.
5.1 Objectives and Methodologies
The general objective of this study was to analyse the effects of soil and water conservation technologies on selected soil properties in Maziba sub-catchment of Kabale District, Uganda. Specific objectives were (i) to identify soil and water conservation technologies at different landscape positions by farmers in Maziba sub-catchment, (ii) to evaluate the effects of selected soil and water conservation technologies on saturated hydraulic conductivity, organic matter and bulk density, and (iii) to determine the factors influencing farmers’ use of soil and water conservation technologies in Maziba sub-catchment. Research objectives were achieved by using semi-structured questionnaires, researcher observation guide.
5.2 Summary of Study Findings
identified various factors that influence farmers to use of soil and water conservation technologies in the study area. These were; age, soil fertility, farmland slope, the source of labour, and level of education of farmers. Other factors were not influencing farmers’ use of soil and water conservation technologies: the marital status, land tenure system, source and access to information, distance from home to farmland and gender of respondents.
5.3 Conclusions
The study findings reported that majority respondents were using terracing and mulching as the soil and water conservation technologies. It was also revealed that technologies such as water catchment banks, level ditches terraces were also used to a small extent in the study area. The study further confirmed that landscape positions significantly influence the type of soil and water conservation technologies used on farmland.
The study findings revealed that the selected soil and water conservation technologies affected organic matter, bulk density and saturated hydraulic conductivity of the soils at the foot slope, back slope, and summit. The study findings further confirmed that mulching and trenching significantly influence the level of organic matter, bulk density and hydraulic conductivity at the foot slope, back slope, and summit.