Scholarship@Western
Scholarship@Western
Electronic Thesis and Dissertation Repository
8-26-2019 10:30 AM
A Study in Three Practical Management Science Problems
A Study in Three Practical Management Science Problems
John S.F. Lyons
The University of Western Ontario Supervisor
Peter C. Bell
The University of Western Ontario Mehmet A. Begen
The University of Western Ontario Graduate Program in Business
A thesis submitted in partial fulfillment of the requirements for the degree in Doctor of Philosophy
© John S.F. Lyons 2019
Follow this and additional works at: https://ir.lib.uwo.ca/etd
Part of the Management Sciences and Quantitative Methods Commons
Recommended Citation Recommended Citation
Lyons, John S.F., "A Study in Three Practical Management Science Problems" (2019). Electronic Thesis and Dissertation Repository. 6460.
https://ir.lib.uwo.ca/etd/6460
This Dissertation/Thesis is brought to you for free and open access by Scholarship@Western. It has been accepted for inclusion in Electronic Thesis and Dissertation Repository by an authorized administrator of
i
Abstract
This study of practical problems in Management Science (MS) describes novel mathematical models for three different decision settings. It addresses questions of: (a) what optimal route should be taken through a time-windows and topographically complex network; (b) what optimal sequencing of scheduled surgeries best coordinates flow of patients through central recovery; and (c) what prices should be charged and what stock amounts should be produced for two markets or channels to maximize profit explicitly, given various capacity and uncertainty conditions.
The first problem is in a sport analytics context, using a novel Integer Programming and big data from Whistler-Blackcomb ski resort. The second is to coordinate dozens of surgeries at London Health Sciences Centre, using a novel Constraint Programming model mapped to and
parameterized with hospital data, including a tool for visualizing process and patient flow. The third problem is relevant to almost any business with a secondary market or sales channel, as it helps them identify profit optimal prices based on simple demand estimates and cost information they can easily provide for their own setting.
The studies use fundamentally different operational research techniques, in each case uniquely extended to the problem setting. The first two are combinatorial problems, neither one extremely beyond human cognitive ability, and both involving lots of uncertainty, and thus the sort of problem managers tend to dismiss as not efficient or practical to solve analytically. We show in the first study that vastly more skiers could achieve the challenge by following our route
recommendation, unintuitive as are some of its elements, initially. In the second study, our scheduling model consistently outperforms currently unstructured-independent approach at the hospital. The final study is mathematical but demonstrates that by considering distinct market costs in pricing a firm can invariably earn more profit.
Keywords
Dedication
This thesis dissertation is dedicated first and foremost to my wife (Laura), for her unbounded love and support. Also, our children (Connor, Emily and Victoria), whose pride and
Summary for Lay Audience
Three chapters of this dissertation cover a variety of important methods in management science and related disciplines e.g. statistics, economics. The problems and results are intriguing without necessarily understanding their proofs.
Chapter 2 describes what most people, even regular skiers at Whistler-Blackcomb, would not imagine as the enormity of possible routes for the problem, or the ambiguity of whether one of them is ‘best’. Many will be interested to see information that can be derived from simple time-stamp data collected from electronic tickets at lift stations, and the new technology-enabled opportunities and efforts being made to ‘gamify’ the sport.
Few cannot relate to the problem of waiting for surgery, nor take interest in rapid and
standardized operating rooms being piloted to address the problem. Chapter 3 identifies how post-surgical recovery, a step in the process rarely considered by patients, can be a limiting factor to enabling faster, more voluminous patient flow. The chapter describes the coordination challenge involved, especially its high variability and uncertainty, but also scientific approaches that can better anticipate and manage the situation despite these factors.
The first two papers demonstrate conceptually similar but fundamentally different mathematical programming approaches. One uses binary decision variables (should a specific lift-to-lift transition be included in a route), and other uses a different type of data which are interval and sequence variables (where to position intervals of patient procedures and recoveries such that they fit together ‘best’ in time and space.)
Some basic understanding of microeconomics is helpful to appreciate, in Chapter 4, essentially how scientific pricing works, some reason to find the same product priced differently in two places, and especially how should it be priced differently. Several propositions can serve as a guide for pricing in one’s own situation, including when capacity is limited, and/or where (different) market demand uncertainties warrant consideration.
Co-Authorship Statement
I declare that this thesis incorporates material that is a result of joint research. Chapter 2 “Solving the Whistler-Blackcomb Mega Day Challenge”, Chapter 3 “Elective Surgery Scheduling to Improve Perioperative Patient Flow” and Chapter 4 “The Effect of Revenue Versus Profit
Acknowledgments
Table of Contents
Abstract ... i
Dedication ... ii
Summary for Lay Audience ... iii
Co-Authorship Statement... iv
Acknowledgments... v
Table of Contents ... vi
List of Tables ... xi
List of Figures ... xii
Chapter 1 ... 1
1 Introduction ... 1
1.1 Motivation ... 1
1.2 Overview ... 1
Chapter 2 ... 4
2 Solving the Whistler-Blackcomb Mega Day Challenge ... 4
2.1 Abstract ... 4
2.2 Introduction ... 4
2.3 The “Mega Day” Challenge ... 6
2.4 RFID Ticket System Information ... 8
2.5 Background Literature and Related Research ... 10
2.6 Methodology ... 13
2.7 Model Formulation ... 14
2.7.1 Integer Program (Stage 1) ... 14
2.7.2 Subtour Elimination (Stage 2) ... 17
2.8 Parameterizing the Model ... 19
2.8.1 Lift Network... 19
2.8.2 Transitions Times... 20
2.8.3 Time Windows ... 22
2.9 Results ... 23
2.10 Implementation ... 25
2.10.1 Recommended Route ... 25
2.10.2 Validation by Trial ... 27
2.11 Conclusion ... 28
2.12 Acknowledgement ... 29
2.13 References (Chapter 2) ... 29
2.14 Appendix A – Lifts Information ... 31
Chapter 3 ... 32
3 Elective Surgery Scheduling to Improve Perioperative Patient Flow ... 32
3.1 Abstract ... 32
3.2 Introduction ... 32
3.3 Background Literature ... 34
3.4 Problem Description ... 38
3.5 Model Development ... 41
3.5.1 Assumptions ... 41
3.5.2 Hospital Data ... 42
3.5.3 Procedure and Recovery Durations ... 42
3.6 Constraint Programming (CP) Model ... 43
3.6.1 Preliminaries ... 44
3.6.3 Tuple Sets... 45
3.6.4 Deducible Parameters ... 46
3.6.5 Decision Variables ... 47
3.6.6 Interval Parameters ... 47
3.6.7 Setting Specific Parameters ... 47
3.6.8 Intermediate Functions and Expressions ... 48
3.6.9 Objective Function ... 48
3.6.10 Formulation ... 49
3.7 Iterative Solution Approach ... 51
3.8 Discussion of Model Features ... 51
3.9 Results ... 55
3.10 Visualization Model ... 58
3.11 Other PACU Considerations ... 60
3.12 Discussion ... 61
3.13 Opportunities for Further Research ... 63
3.14 Conclusion ... 64
3.15 Acknowledgement ... 65
3.16 References (Chapter 3) ... 65
Chapter 4 ... 67
4 The Effect of Revenue Versus Profit Maximization on Firm Profits ... 67
4.1 Abstract ... 67
4.2 Introduction ... 68
4.3 Background and Related Literature ... 69
4.4 The General Model ... 71
4.5 Deterministic Model ... 74
4.5.1 Independent Markets, Unconstrained ... 74
4.5.2 Profit Loss from Unconstrained RM vs. PM ... 76
4.5.3 Intermediate Objective Functions ... 77
4.5.4 Summary of Deterministic, Unconstrained Results ... 79
4.6 Capacity Effects ... 80
4.6.1 Critical Capacity Levels ... 80
4.6.2 Capacity-Constrained RM Prices ... 81
4.6.3 Capacity-Constrained PM Prices ... 82
4.6.4 Generalized Deterministic Optimal RM and PM Prices ... 85
4.6.5 Profit Loss from Constrained RM vs. PM ... 86
4.6.6 Graphical Summary ... 87
4.7 The Stochastic Model ... 88
4.7.1 Independent Markets, Unconstrained ... 89
4.8 Stochastic, Capacity-Constrained Model ... 92
4.8.1 Marginal Analysis (Point Elasticities) ... 93
4.8.2 Algorithm for PM Under a Capacity Constraint ... 96
4.9 Illustrative Example ... 97
4.9.1 Deterministic – Unconstrained ... 98
4.9.2 Deterministic - Capacity Constrained ... 99
4.9.3 Stochastic – Unconstrained ... 100
4.9.4 Stochastic - Capacity Constrained ... 101
4.10 Summary ... 103
4.11 Opportunities for Future Research ... 104
4.13 References (Chapter 4) ... 105
4.14 Appendix A – Deriving Constrained RM and PM Prices ... 107
4.15 Appendix B – Deriving Stochastic Capacity-Constrained Decisions ... 109
5 Thesis Conclusion ... 112
List of Tables
Table 2-1 Four Day RFID Lift Scan Data Summary ... 9
Table 2-2 Ordered Full-Tour Solution Infeasible Due to Time Windows ... 19
Table 2-3 Whistler-Blackcomb Lifts Information ... 31
Table 4-1 Pricing Decision Protocols and Objectives ... 73
Table 4-2 Optimal Decisions and Outcomes: Unconstrained Deterministic Demand ... 79
Table 4-3 PM vs. RM - Influence of Capacity on Profit Difference ... 87
Table 4-4 Deterministic, Unconstrained Decisions and Outcomes (RM, CM and PM) ... 98
Table 4-5 : Deterministic, Capacity-Constrained Decisions & Outcomes (RM, CM, PM) ... 99
Table 4-6 Stochastic, Unconstrained Optimal Decisions and Outcomes (CM and PM) ... 100
Table 4-7 Stochastic, Capacity-Constrained Decisions and Outcomes (CM and PM) ... 101
List of Figures
Figure 2-1 Map of Whistler-Blackcomb & Schematic of Lift System ... 7
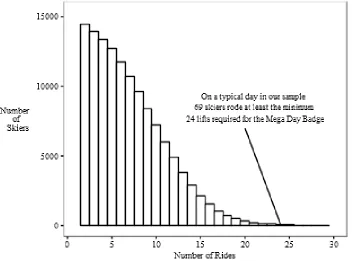
Figure 2-2 Distribution of Rides Per Skier on 25 Feb 2016 ... 9
Figure 2-3 Example Subtours in Candidate Solution ... 17
Figure 2-4 Transition Times To Wizard Chair and From Symphony Chair ... 20
Figure 2-5 Lift-to-Lift Transition Time Percentiles and Time~Vertical Regressions ... 21
Figure 2-6 Comparison of Ski Time Regression Models Across Skier Percentiles and Days 22 Figure 2-7 Volume of Skiers Riding Each Lift Per 5-Minute Interval (Four Days) ... 23
Figure 2-8 Solution Objective Values for 1st-28th Percentile Skiers ... 24
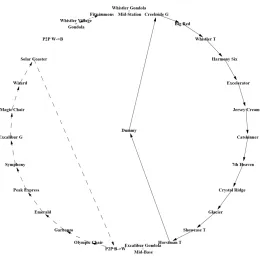
Figure 2-9 Recommended Route for 28th Percentile Skier ... 27
Figure 3-1 Perioperative System Flow ... 39
Figure 3-2 Patient Flow Examples ... 39
Figure 3-3 Linear Regression Models for Procedure and Recovery Durations ... 43
Figure 3-4 Pre-Schedule vs. Model - Forecast Averages: Patient Load by Time of Day ... 56
Figure 3-5 Efficient Frontier: Average Patient Flow Time vs. Peak PACU Patient Load ... 57
Figure 3-6 PACU Loads: Pre-Schedule & Optimized - Forecast vs. Actual/Calculated ... 58
Chapter 1
1
Introduction
1.1 Motivation
This three-paper thesis has been developed from my perspective of having spent two-and-a-half decades in management positions within both the public and private sector. It is purposefully broad and practically-oriented in keeping with similar features of the Management Science (MS) discipline. The subject areas chosen for this thesis cover three important classes of problems: two of them concerning manufacturing/service and logistic operations, routing and scheduling; and another concerning a critical marketing function, pricing. Within my practical experience, I have witnessed decision-making in all these areas, often following intuition that is expressed with the greatest conviction, but based on little of the scientific methods that are the domain of MS. This thesis, in its whole, serves as a brief but rich survey of several important MS methods, presented in the context of three relatable problems.
1.2 Overview
Chapter 2, the first article of this thesis entitled “Solving the Whistler-Blackcomb Mega Day Challenge”1, addresses a routing problem of which tens of thousands additional skiers become aware every year. It is part of the ski resort’s online ski-gaming community initiative called WB+. Those who consider undertaking the challenge, to ride all 24 lift systems spanning North
America’s largest ski area in a single day, quickly realize that a viable path is not easy to identify from a trail map. It is a combinatorial problem that is seemingly solvable by detailed inspection, but without great confidence, and subject to little margin for error to be successful, especially for less expert skiers (for whom it is likely most meaningful.) Working with WB+ management and large daily datasets of time-stamp skier ride information I developed and parameterized a mathematical (mixed linear-integer) program to determine an optimal route for a skier of the lowest percentile ability that could reasonably accomplish the feat. The approach is
1 Lyons, J. S. F., P. C. Bell and M. A. Begen (2018). "Solving the Whistler-Blackcomb Mega Day Challenge."
mathematically unique for application to time-windows constrained routing problems involving fixed and variable segment completion times/costs and an asymmetric graph of origin-destination connections.
Chapter 3, the second article of this thesis is entitled “Elective Surgery Scheduling to Improve Perioperative Patient Flow”. It addresses a high priority problem for public health care systems that is to improve surgical throughput and reduce patient wait-times. This paper/chapter focuses on the daily operational aspect of OR scheduling and recovery. referred to collectively as
perioperative care. I worked with a hospital which performs several dozen elective surgeries across 16-18 operating rooms (ORs) daily, in almost all cases requiring time for patient recovery in a central, limited capacity post-anesthesia care unit (PACU.) I obtained historical data to develop a model for predicting surgery and recovery times, and to parameterize a constraint programming (CP) model I also developed that coordinates sequences and timing of procedures across ORs to prevent surgery delays arising from PACU patient overload. Finally, I developed a tool for visualizing OR and PACU bed occupancies and patient statuses over the course of a day, both forecasted by the model and according to data collected during schedule execution, to assist management in identifying schedule-based sources of congestion, and thereby strategies to avert surgical delays.
Chapter 4, the third article of this thesis entitled “The Effect of Revenue Versus Profit
Maximization on Firm Profits” explores a common problem of a firm simultaneously choosing prices and quantities of its product in distinct markets or channels with different demand
characteristics. Although the field of revenue management literature is large, there has been a lack of attention paid to the nature and combination of costs between different sales and delivery channels, and potential impact of accounting for these costs or not in pricing decisions, with consequent profit outcomes. The paper begins with a simple deterministic unconstrained problem and set of solution decisions and outcomes. It then progressively develops easily comparable expressions regarding optimal decisions and outcomes for other forms of the problem (constrained and stochastic). These are presented to provide strong intuition for the differences between
The first two papers are practical in a literal sense, relating to real-world problems and data of the ski resort and hospital for whom we worked on the research. The third paper is practical in the different sense of having broad utility, providing a fresh view of an old subject, and raises several interesting considerations for managers facing the problem of dual channel pricing and inventory planning.
Chapter 2
2
Solving the Whistler-Blackcomb Mega Day Challenge
2.1 Abstract
The Whistler-Blackcomb (WB) Mega Day Challenge requires a skier to ride all 24 lifts at the resort in a single day. Among over two million skiers annually at WB, only 313 completed the challenge in fourteen months following the introduction of a system that tracks lift use by skier. Apart from the physical challenge, the difficulty is to find a route that matches one’s skill level while accounting for variable lift opening and closing times.
We use data from WB’s radio-frequency identification (RFID) ticketing system to estimate ski times between lifts for skiers of various skill levels. We then formulate and solve the problem by a combined, iterative integer programming and heuristic approach, up to the highest feasible skier skill level. The problem’s distinctive features preclude use of known solution methods for similar problems, so we use a practical, staged solution approach.
Our results include a recommended route that enables the greatest number of skiers, roughly the fastest quartile, to achieve the challenge. We also provide a benchmark, that skiers who can ski a particular common run in 12 minutes or less, should be able to complete the
challenge. In three months following communication of our recommended solution, the rate at which Mega Days were successfully completed increased by two-thirds from the previous seven skiing months.
2.2 Introduction
Whistler-Blackcomb (WB) ski area located in British Columbia, Canada, hosted the 2010 Winter Olympics alpine events and is one of North America’s largest ski resorts. WB spans more than 12 square miles across two mountains (Whistler and Blackcomb) each with more than 4500 vertical feet of lift ski access.
In 2015 WB implemented an RFID ticketing system that enabled the resort to track
increased speed of service along with some reduction in staff costs. It also provides WB skiers with access to a web-based portal called WB+, where they can view their personal statistics (e.g. number of rides and vertical metres/feet accumulated).
Whistler-Blackcomb was acquired by Vail Ski Resorts in 2017. WB+ follows another similar system in North America operated across several properties of Vail Ski Resorts, called EpicMix©, that has been described as the ‘gamification’ of skiing (Khan 2010, Sean 2013). Detailed data on individual skiers enables Whistler-Blackcomb and Vail Ski Resorts to implement a motivational program where skiers can earn a variety of ‘badges’ (called ‘pins’ in EpicMix) based on their performance. For example, the “Mount Everest” badge is earned by riding a number of lifts in a single day such that the sum of their vertical rises exceeds 29,029 feet. As in this example, some badges are based on total elevation and do not require riding specific lifts, whereas others such as the “Whistler Complete” or “Blackcomb
Complete” badges are earned by riding all RFID-enabled lifts on one mountain or the other in the course of a single day.
Among the most challenging is the “Mega Day” badge that is earned by a skier who, on a single day, rides all 24 lift systems on both mountains (12 on Whistler, 11 on Blackcomb, plus the ‘Peak-2-Peak’ lift that spans the adjoining valley).
Data made available to us showed that only a very small number (~0.1%) of skiers earn the Mega Day badge on any given day and so we set out to help WB management to improve the marketability of the WB award program by highlighting the Mega Day Challenge as the pinnacle of this program. An important part of this effort was to demonstrate that this accomplishment is not just for expert skiers, but can be earned by skiers of modest ability if they follow a route that suits their skill level.
The former group have more route flexibility, as a less advanced skier’s feasible route is always feasible to the more advanced skier (although it may not be the latter’s shortest time route for their ability and pace).
Our approach was to solve the problem starting with an advanced skier’s ability, which we characterize as a 1st percentile skier, and then solve for increasing skier percentiles or decreasing ability. At some percentile, which turned out to be the 28th on our scale, a skier can expect to complete the challenge only by following a specific route, as there is little or no spare time to do otherwise.
Our results show that the WB Mega Day Badge challenge is achievable by the top quartile of typical skiers at Whistler-Blackcomb, although a much smaller fraction have done so to-date. In three months following electronic newsletter communication of our recommended solution to skiers at WB, the rate at which Mega Day Challenges were successfully completed
increased 67%. Our findings also suggest that if a skier can ski a common run from Roundhouse lodge to the Whistler Village base in 12 minutes or less, they are capable of completing the Mega Day Challenge. Finally, we found that if WB were to keep the Fitzsimmons lift open an extra hour (even if only on weekends), it could increase the accessibility of the Mega Day badge to a wider range of skiing abilities.
In the next section, we define the problem and point out the relationships between this Mega Day routing problem and other similar problems in the literature. We then provide a
mathematical formulation of our model, relating its components to our staged solution approach. We discuss the RFID scan data made available to us, and how it has been used to parameterize the model. Finally, we present our computational results and discuss how they have been used by WB management.
2.3 The “Mega Day” Challenge
First, the resort includes three “lifts” that are in fact “lift systems” which include more than one location where a rider can get on or off. One of these lifts is the ‘Peak-2-Peak’ gondola, spanning the valley between Whistler and Blackcomb mountains that can be ridden in either direction. The other two are the Excalibur and Whistler Village gondolas that are
unidirectional but have mid-stations that can serve as alternate entry-exit points.
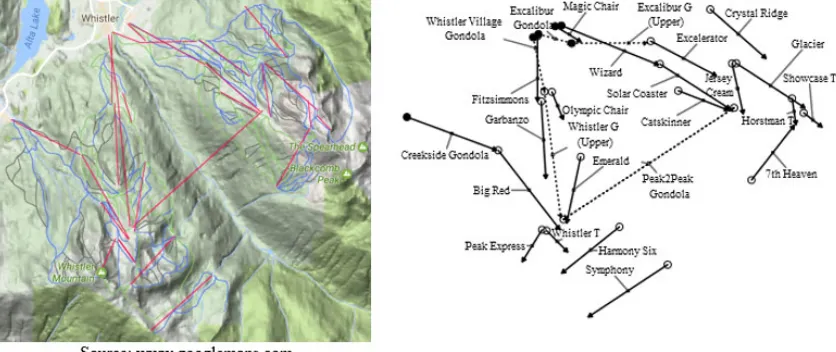
Figure 1 depicts a North-facing map of the Whistler-Blackcomb area on the left and a
schematic of its 24 lift systems on the right. The dotted lines represent gondolas with multiple and/or bi-directional segments. A skier must begin at one of seven potential starting points along the two mountain bases, indicated by solid black circles (upper left portion of the image). These lifts are the Creekside Gondola, Whistler Village Gondola, Fitzsimmons Chair, Excalibur Gondola base, Magic Chair, Wizard Chair, and Excalibur Gondola mid-station (accessible from an upper level parking area).
Figure 2-1 Map of Whistler-Blackcomb & Schematic of Lift System
In Figure 2, lift entry points are represented as circles, with seven possible starting points indicated by black fill, and lifts with multi-segment shown as dotted lines
We consider a route to be a sequence of lift segments ridden that meets the requirements of the Mega Day Challenge. A route does not necessarily involve riding every segment of every lift and may include riding some lift segments more than once.
sufficiegnt number of skiers are in a position to reach these lifts. These remote lifts also close earlier in the afternoon, in order to move skiers down toward the base of the resort and allow ski patrols to complete sweeps before dusk.
A skier must check into his or her final lift before it closes for the day. Neither the ride time on that final lift ride nor the following ski-out have any bearing on completion of the challenge.
In combination, these features make the problem unique among routing problems, and difficult to optimize. A key source of this difficulty is that we cannot impose hard time window constraints on all lift segments, because we don’t know in advance if they will be part of the chosen route. Also, the natural optimization objective of minimizing time gives preference to routes whose final lifts are most remote because the subsequent, long ski-out time is not counted in the objective calculation. On the other hand, early closing times of remote lifts make them poor choices as final lifts for slower (higher percentile) skiers, the very ones for whom solving the problem is most important. For these reasons we have taken a practical approach that solves the problem in three stages.
The objective of our work was to create interest in the Mega Day Challenge among skiers by providing recommendations and guidelines on the routes they should choose according to their ability. In particular, we sought to identify the route that is feasible for the greatest number of skiers, from the most ‘expert’ down to some skill level below which a skier cannot reasonably expect to be able to complete the challenge.
2.4 RFID Ticket System Information
Date (2016) 19 Feb 25 Feb 29 Mar 7 Apr
Unique RFID passes 19,591 15,417 17,152 11,665
Regular skiers 17,481 13,210 15,027 9,999
Total # Scans 158,759 144,185 144,661 94,400 Regular skier scans 145,823 128,689 130,609 83,641
Mega Day (MD) badges 1 14 16 11
MD routes w/ minimum lift 0 1 4 1
Table 2-1 Four Day RFID Lift Scan Data Summary
Unique RFID passes represent the number of individuals riding at least one lift on each date. Regular skiers excludes RFID passes used for only one ride (mostly employees ascending to work at the upper mountain lodges) as well as a small number of contractors and volunteers such as law enforcement, who may have shared the RFID pass among different skiers. Total # Scans represent all lift rides taken on each date, whereas Regular skier scans includes only rides taken by Regular skiers. The number of skiers who earned a Mega Day badge on each date is recorded. The final row in the table gives the number of distinct Mega Day routes taken on the date, which involved only the fewest possible number (24) of rides.
From our initial dataset, we determined that among 13,210 regular skiers, only 69 (~0.5%) of them rode 24 or more lifts. Most of these 69 skiers did not earn a Mega Day badge, as they rode fewer than 24 distinct lifts, rather multiple rides on some lifts and zero on others.
We determined the existence of at least one Mega Day route involving only the minimum 24 rides, by identifying three skiers who completed the Mega Day challenge together in this manner on 25 February 2016. The group started at 9:42 am and checked into their final lift at 15:01 pm. This duration of 319 minutes is roughly three-quarters of the overall time available from first lift opening (8:15 am) to the resort’s general closing time (15:45 pm), after which only one small base lift (Magic Chair) remains open, typically for an additional 60-90 minutes.
This evidence suggests that the Mega Day is quite challenging on one hand, but should be achievable by reasonably advanced skiers, and not exclusively expert skiers, given that this group on 25 Feb achieved it with more than two hours of open resort time to spare. A key question we sought to answer is how advanced must be one’s skiing ability in order to have a reasonable chance of earning the Mega Day badge. The closer a particular skier’s ability is to that threshold, the more important will be that skier’s choice of which route to navigate through the mountain lift network. A feasible route for this marginal Mega Day skier will be feasible for any more advanced skier.
2.5 Background Literature and Related Research
Routing problems have a long history in operations research extending back to 1736 when Leonhard Euler laid the foundations of graph theory, a commonly-used technique to model such problems. (Biggs et al. 1976). From the earliest days of electronic computing, the well-known Traveling Salesman Problem (TSP) and its variants have served as benchmarks of combinatorial complexity and standards by which solution computational approaches, heuristics and algorithms, are often compared (Cook 2012). In the early 1950s, a team from The Rand Corporation (Dantzig et al. 1954) developed an approach to large-scale instances of these problems that would be described five decades later as “the Big Bang” that “all
Over the years, many variations of the problem have been proposed and many more
approaches have been employed to solve them. Entirely new classes have developed, Vehicle Routing Problems (Eksioglu et al. 2009) being among the broadest of them. We briefly identify a few related problem types that share critical characteristics with the Mega Day Challenge.
The Orienteering Problem, also known as the Selective Traveling Salesman Problem (Vansteenwegen et al. 2011), has the objective of finding a route through a network of checkpoints, each of which has a certain score, where not all checkpoints must or can be visited within a given time frame. The Mega Day Challenge is also selective, as it allows for only a subset of lift segments to be visited. But its objective is binary (successful completion or not) and the rewards from visiting different lift segments have indistinguishable bearing on the decision of which lift segments to visit.
The lifts network at Whistler-Blackcomb includes only 285 feasible transitions (excluding same lift returns), of which 198 comprise 99 bidirectional connections. Only one pair of lift segments has both feasible connections and equal transition times in both directions. This makes our problem one of a broad class of Asymmetric Traveling Salesman Problems (Öncan
et al. 2009).
Many routing problem variants involve time windows, and/or service times at the destinations (Kantor and Rosenwein 1992, Focacci et al. 2002, Campbell et al. 2011, Tas et al. 2016). Various approaches have been developed for the former, including the use of time buckets (Dash et al. 2012), adding variables for each destination’s arrival time and constraining them to fall within that destination’s time window (Desrosiers et al. 1995), and by constraint logic programming (Pesant et al. 1998). However, these approaches were developed for problems in which all destinations must be visited whereas with respect to the second of these
Another related sub-class of routing problem is the Steiner Traveling Salesman Problem (Letchford et al. 2013) and its variants, including with time windows. Their important distinguishing features relevant to our problem are: (a) that only a subset of nodes must be visited; (b) that nodes may be visited more than once; and (c) that edges between nodes may be traversed more than once. Comparison to the Mega Day problem is deceptive, however. Rather than having required and optional nodes, we have groups of lift segments requiring that one (or more) must be chosen from each group. A minimum time route could conceivably visit the same lift more than once but is much less likely to be followed by the same
subsequent lift.
While there exists a large variety of closely-related problem types and solution approaches in the literature, we have not found among them any quite like the Mega Day problem. Its uniqueness is due to the combination of the following features:
1. The network on which it is defined is clearly incomplete and highly asymmetric.
2. Route feasibility and time minimization depend not only on which i jlift transitions are chosen, but also the order in which lifts are visited.
3. The problem includes subsets of lift segments where only one segment needs to be visited (although more may be visited.)
4. There is a subset of lifts which are possible starting points.
5. The transition times from lift-to-lift are a combination of fixed lift ride times and variable ski times, the latter being a function of skier ability.
6. Like the Steiner TSP, the number of times that a lift may be visited is integer, not binary.
In addition to the related operations research literature discussed above, we identified a small body of research related to skier abilities and trail selection. Skier abilities have been
In that research, skiers have been segmented into three levels of ability which imply their choice between easy, intermediate and difficult trails. Our research doesn’t consider skier volumes or queueing explicitly, although the latter is accommodated in our time estimates (mean queue times are embedded within mean ski times). Our application of network and graph theory is to a route optimization problem for individual skiers rather than for modeling aggregate skier flow.
2.6 Methodology
We conducted our study in two phases. The first included data preparation and analysis, which provided input to the second phase where instances of the problem were generated and solved for different skiers. The second phase utilized a three-stage solution procedure for each instance.
In the first phase, RFID scan data from the WB+ system was cleaned and shaped. We accounted for and removed exit-scans to determine what lift rides began at what times, per skier. We then gathered data about lifts, including lower and upper locations (latitude, longitude, altitude) and ride times. We translated pairs of successive rides into runs, i.e., transitions from lifts i to liftsj. We identified and removed infeasible observations (< 2%)
stemming from scans that were occasionally missed between two lifts that have no direct interconnection. We disaggregated the ride and ski times, making adjustments in cases where multi-segment lifts were exited at mid-stations. Finally, we derived i j ski times according
to skier abilities, from 1st to 100th percentiles, representing fastest to slowest skiers,
respectively.
Our second phase was to develop and execute an optimization model. A series of parameter-data files were derived from phase 1 output for different skier abilities. The program was executed in order of increasing skier ability. Feasible solutions to the Mega Day routing problem were obtained for skier abilities from the 1st up to and including the 28th percentile.
Stage 1 Solve the integer program (IP) described by equations (1)-(5) below. Then determine whether the solution contains any subtours. If not, proceed to stage 3 with the full tour candidate solution.
Stage 2 Add subtour elimination constraint equations (6) as required, re-solving the IP and again determining whether the revised solution contains any new subtours. If so, repeat stage 2. Stage 3 Determine whether the full tour candidate solution from stage 2 satisfies time windows
constraint equations (7). If necessary and possible, adjust start time and/or accept delays imposed by arrivals in advance of lift opening times. If any lift closing times are violated, within the initial solution or as a result of time adjustments, return to stage 2 with a new constraint equation (6) that precludes this full tour candidate solution, and force instead a search for the next most optimal solution in terms of the objective function (1).
A final solution for a skier percentile, generated by Stage 1, is then validated as feasible by Stages 2 and 3, perhaps modified with delays in Stage 3. We nevertheless refer to this as the ‘shortest time route’ for the skier level, because it is based on minimization of the objective function in Stage 1, regardless of time adjustments in Stage 3, if any. (This is shown visually in the Model Results section Figure 8.)
2.7
Model Formulation
Our mathematical formulation is presented in three stages that coincide with the solution procedure.
2.7.1 Integer Program (Stage 1)
Twenty-seven discrete ski lift segments are each mapped to one of 24 lift systems. The former are required to specify which lift-to-lift connection points are chosen, and to calculate the objective function value associated with those choices, whether they comprise a full tour or multiple subtours. The mapping is required to verify whether all lift systems are represented among the origins and/or destinations of the chosen connections.
We define the following sets, parameters and variables:
N a set of discrete lift segments (generally referred to simply as ‘lifts’).
G a set of lift systems (groupings of one or more lift segments).
B
a subset of lift segments B N that constitute feasible starting lifts.m
Ti the standard ride time (fixed) from the base to the top of a lift segment i N .
We note that lifts may operate at various speeds in reality, depending on load and other factors. But we assume, for simplicity, fixed lift ride times as suggested by Whistler-Blackcomb personnel.
k ij
the ski time from the top of lift i to the base of lift j for a skier of skill level k.k ij
t
the total transit time from the base of lift i to the base of lift j for a skier of skill level k.Note that
t
ijk
T
i
ijk.For contiguous lift segments i j, belonging to the same lift system gm, we specify the ski-time
0
k ij
, reflecting the fact that a skier merely needs to remain on-board to ride the second segment.Recognizing that transition timesare, in general, specific to the skier’s skill level, we drop the skill
level superscript k from this point forward.
We define:
ˆ
N
the union of the set N with a “dummy lift” i0, that is, N Nˆ
00j
t
the transition time assigned to a skier for travel from the initial “dummy” lift to the entrance ofany possible starting lift in B. We assign
t
0j= " Î
0,
j B
,t0j otherwise.0
i
t the transition time assigned to a skier returning from lift i to the “dummy”, ti0 0, i.
ij
X
the decision variables, where Xij =1 if the route for a skier includes skiing (or connectingwithin the same lift system) from top of i to bottom of j, otherwise Xij=0. We also set
0 ij
X = for infeasiblei j transitions.
j
S the number of times a skier visits (rides) a lift segment j, that is,
ˆ
j ij
i N
S X
The objective is to find the set of decision variables Xij that minimize the time to visit all lift systems at least once:
ˆ ˆ
ij ij
i N j N
Minimize X t
(1)
subject to
ˆ
1
m m
j ij
j g j g i N
S X m G
(2)
ˆ ˆ
ˆ
ik kj
i N j N
X X k N
(3)0j i0 1
j N i N
X X
(4)Xij binary, integerSj (5)
All components of the Objective function (1) that involve the dummy lift (either i0or j0) evaluate to zero. Consequently, neither a skier’s final ride nor his or her final ski add any cost (time) to the objective function value.
(2) allow solutions to use a given lift segment more than once but specify that, for all liftsystems
m
g , the sum of the visits to its member lift segments jgm must be at least one.
(3) are for flow conservation. The number of arrivals flowing into any lift inNˆ , including the dummy, must be the same as the number of departures flowing from that lift.
(4) ensures that there is only one connection from the dummy lift 0 to (one of seven practical
starting lifts in) the real lift network N , as well as only one connection from the real lift network back to the dummy lift.
2.7.2 Subtour Elimination (Stage 2)
Figure 2-3 Example Subtours in Candidate Solution
Optimal solutions to equation (1)-(5) may lead to the problem of subtours, for which we need to add instances of equation (6) shown below. Figure 3 depicts a preliminary solution with three subtours, the smallest of which simply joins the Whistler Village Gondola to the Fitzsimmons chair and back again (shown just to the left of the image’s top-centre.) Another subtour proceeds from the Dummy lift to Creekside Gondola and eventually returns to the Dummy lift after a visit to the Horstman T-bar. The underlying Xij choices are optimal with respect to (1)-(5) but do not form a meaningful route in
reality.
Following the DFJ formulation (Dantzig et al. 1954), we use ‘lazy’ constraints to eliminate subtours. We first define:
Z a set of edges (lift-to-lift transitions) comprising a subtour which we wish to eliminate.
We then add constraints:
( ) ( ) 1,
I z J z z Z
X Z Z
(6)2.7.3 Time Validation, Route Adjustment/Rejection (Stage 3)
After obtaining a full tour candidate solution to equations (1)-(6) as output from stage 2, we check to see if the solution satisfies the time window restrictions of each successive lift in the tour.
We define the following sets, functions and variables:
W an ordered set of edges i j chosen within a full tour candidate solution, where we denote the lth element of the set as
l
W .
( )
I w a function which returns the origin lift i N ˆ from an edge w W . ( )
J w a function which returns the destination lift jNˆ from an edge w W .
( )
w I w
T
the time at which a skier is expected to depart from an origin lift I(w).( )
w J w
T
the time at which a skier is expected to arrive at a destination lift J(w).( )
w I w
O
the opening time for an origin lift I w( ) of an edge w.( )
w J w
O
the opening time for a destination lift J w( )of an edge w.( )
w J w
C
the closing time for a destination lift J w( ).Noting that w( ) w( ) ( ) ( ) J w I w I w J w
T T t and w( 1) w( )
J w I w
O O , we calculate the starting time of stage w
, which begins at lift I w( ) J w( 1), as follows:
( )
1( )
1( 1) ( )
for
, for ( 1)
w J w w
I w w w
J w I w l
O w W
T
Max T O w W l
The starting time for the first stage is the opening time for the first destination lift (departing from the dummy lift). For the remaining stages, the starting time is the greater of the arrival time from the previous stage, and the opening time of the origin lift in the current stage. The difference, if any, represents an amount by which the start of legwis delayed. We add the constraints:
( ) ( )
,
w
J w J w
T
C
w W
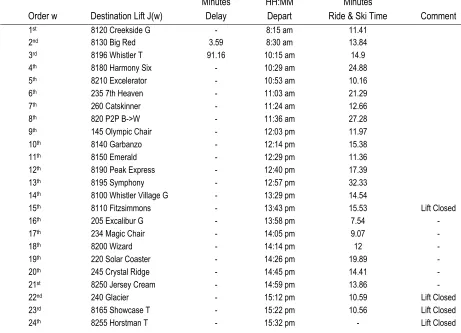
(7)Table 2 provides example output from stages 1 and 2 of our solution procedure. This is a minimum time solution to equations (1)-(5) plus the set of subtour constraints (6) needed to obtain a full tour. However, we find in stage 3 that this candidate solution critically violates one or more time window constraint equations (7). Whereas the skier’s expected early arrivals at the 2nd and 3rd lifts may be avoided simply by starting the tour later, late arrivals beginning at the 15th lift make this candidate solution infeasible with respect to time
windows. Thus, we add a constraint (6) to eliminate this full tour and seek the next best candidate solution to the updated set of equations (1)-(6).
Minutes HH:MM Minutes
Order w Destination Lift J(w) Delay Depart Ride & Ski Time Comment
1st 8120 Creekside G - 8:15 am 11.41
2nd 8130 Big Red 3.59 8:30 am 13.84
3rd 8196 Whistler T 91.16 10:15 am 14.9
4th 8180 Harmony Six - 10:29 am 24.88
5th 8210 Excelerator - 10:53 am 10.16
6th 235 7th Heaven - 11:03 am 21.29
7th 260 Catskinner - 11:24 am 12.66
8th 820 P2P B->W - 11:36 am 27.28
9th 145 Olympic Chair - 12:03 pm 11.97
10th 8140 Garbanzo - 12:14 pm 15.38
11th 8150 Emerald - 12:29 pm 11.36
12th 8190 Peak Express - 12:40 pm 17.39
13th 8195 Symphony - 12:57 pm 32.33
14th 8100 Whistler Village G - 13:29 pm 14.54
15th 8110 Fitzsimmons - 13:43 pm 15.53 Lift Closed
16th 205 Excalibur G - 13:58 pm 7.54 -
17th 234 Magic Chair - 14:05 pm 9.07 -
18th 8200 Wizard - 14:14 pm 12 -
19th 220 Solar Coaster - 14:26 pm 19.89 -
20th 245 Crystal Ridge - 14:45 pm 14.41 -
21st 8250 Jersey Cream - 14:59 pm 13.86 -
22nd 240 Glacier - 15:12 pm 10.59 Lift Closed
23rd 8165 Showcase T - 15:22 pm 10.56 Lift Closed
24th 8255 Horstman T - 15:32 pm - Lift Closed
Table 2-2 Ordered Full-Tour Solution Infeasible Due to Time Windows
2.8
Parameterizing the Model
2.8.1 Lift Network
Table A1 in the appendix provides a list of the N 27 lift segments at WB, along with the
elevations of their entry and exit locations, and their standard ride timesTi. To estimate
entrances. Our methods were first developed using data from 25 February 2016, then applied to four full days of scan data (see Table 1).
2.8.2 Transitions Times
After adjusting for exit scans and removing anomalies from some missing intermediate scans, we obtained sets of observed i j transition times for various lift pairs. Figure 4 shows
boxplots of example transition times observed on a particular day. The set at left are times recorded from 14 different origin lifts leading to the Wizard Chair 8200. On the right are times recorded from the Symphony Chair 8195 to seven different destination lifts recorded on the day.
Figure 2-4 Transition Times To Wizard Chair and From Symphony Chair
We eliminated observations of transition times greater than 60 minutes, on the premise that skiers likely stopped for refreshment at some point during those runs.
Our model did not consider lift queues and wait times explicitly, as we had no basis on which to disaggregate them from total transition times. RFID scans were only captured at points just prior to lift boarding and provided no record of any preceding queue. Some extra time to
reflect expected delays is embedded in each k ij
t parameter estimate by our approach to their
derivation described below.
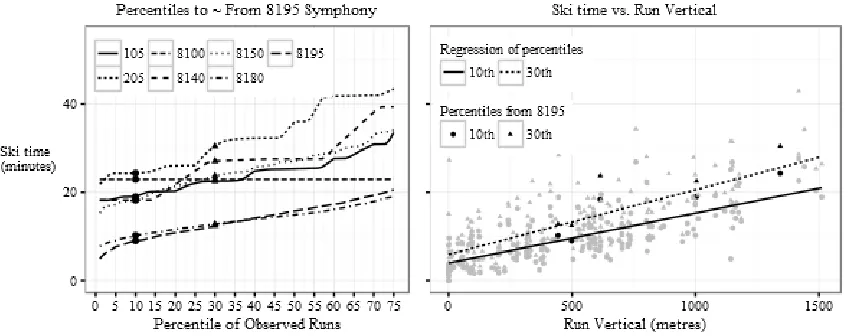
The left side of Figure 5 provides a different view of transitions from 8195. It depicts percentile ski times (RFID scan-to-scan interval minus fixed ride time) from 8195 to its various recorded destination lifts. The 10th and 30th percentile observations are marked as
circles and triangles, respectively. Five of these pairs are highlighted again in the right side of Figure 5, as explained in the following paragraph.
Figure 2-5 Lift-to-Lift Transition Time Percentiles and Time~Vertical Regressions
We used percentiles data only from transitions with at least 25 observations (180 out of 312 at WB, including same lift returns). We formed 100 sets of data by percentiles, each set with
coordinate pairs { vertical_distance( , ), k percentile_k_ski_time( , )}
ij ij
h i j y i j to which we fit
linear models of the form k ~kk
y h . These linear models were used to parameterize ski
times k k k k k
ij ij ij
y h for each percentile skier to ski each feasible lift transition, regardless of whether and how many of those transitions were observed in the dataset.
The right-hand side of Figure 5 shows two of these linear models, for the 10th and 30th
percentiles. The points depicted as dark circles and triangles correspond to five pairs of data on the left, those being the 10th and 30th percentile times for like transitions from 8195, among
transitions with 25 or more observations only.
initiate a run after disembarking. This fixed time component may also account for stops on trails that are made more frequently by less advanced skiers.
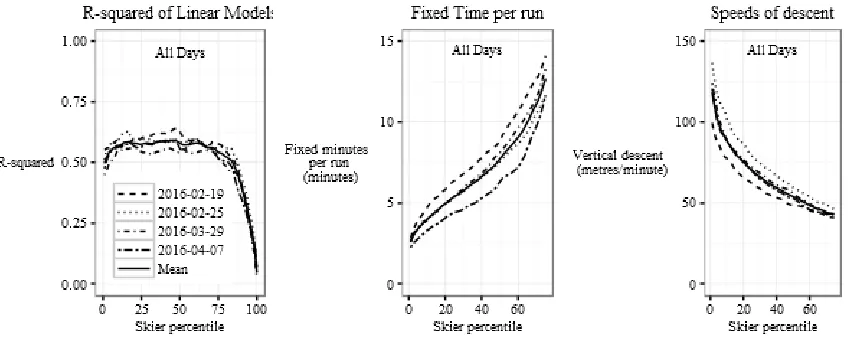
Figure 2-6 Comparison of Ski Time Regression Models Across Skier Percentiles and Days
Our linear models had consistent R-squared values in the range 0.5-0.6, across all percentiles below the 75th. Intercept estimates increased progressively from a base of three minutes for
the lowest percentile, fastest skiers. We consider these fixed times in our model as buffers to account for navigation around lift entries and exits, regardless of actual ski time between lifts. The inverses of our linear model slope parameters are shown in the right-hand side of Figure 6, that is, to depict metres per minute (rather than minutes per metre). This is to simplify characterization for a 28th percentile skier, the highest for which we found a solution to the
Mega Day problem, as one whose typical rate of descent we estimate to be roughly 65 metres (200 feet) per minute.
We used the four-day mean values of our linear model parameters to calculate k ij
for all feasible runs at each successive skier percentilek. These calculated ski times, added to the fixed ride time of the origin lift in each case, serve as the objective function coefficients
k k
ij i ij
t T for each execution of our model for k1, 2,...
2.8.3 Time Windows
closing times often varied from day-to-day. We used the means of the four day observations to the quarter-hour, for lift opening times and lift closing times.
The fifth row of Figure 7 shows that Magic Chair (234) remains open well after 15:45 pm by which time all other lifts are typically closed. Fitzsimmons Chair (8110) is generally open for only the first couple of hours of the day (although longer on busy holidays, according to WB staff). The Whistler T-bar (8195), which lies in an upper section of Whistler Mountain and provides access to the back valley side, generally opens late and closes early (11:30 am-14:30 pm, on 25 February 2016, for example). While inclement weather, mechanical maintenance and other factors occasionally require adjustment to lift opening and/or closing times, we treat time windows as deterministic in our model.
Figure 2-7 Volume of Skiers Riding Each Lift Per 5-Minute Interval (Four Days)
2.9
Results
We executed our model with parameters derived for skier abilities from the 1st to 30th
percentiles (unsuccessfully for the 29th and 30th percentiles). In several instances, expected
the route in stage 3, due to early expected arrivals at some lifts. In most cases, delays could be merged into a late start, such that the route would still lead to the shortest elapsed time, from start to finish, for the particular skier percentile.
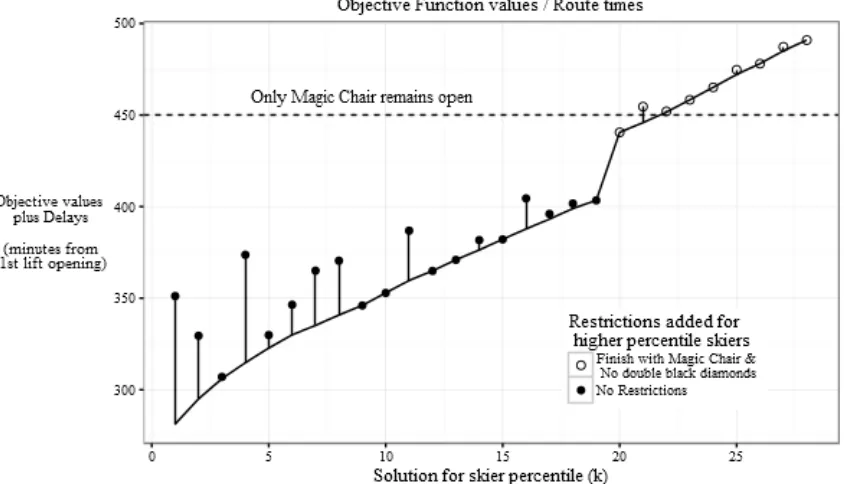
Figure 2-8 Solution Objective Values for 1st-28th Percentile Skiers
Figure 8 shows solution objective values for the 1st to 28th percentile skiers. Circles depict expected completion times after delays for time windows imposed by Stage 3.
Using the IBM ILOG CPLEX 12.3 MIP solver on an Intel i5 1.8 GHz processor, solutions were generally obtained in under two minutes, up until the 20th percentile skier where we did not initially obtain a solution through several hours and more than 3,000 iterations of stages 1-3. We noted at that point that the objective function value (expected finish time without contingency for delays) had exceeded the closing times of several favored final destination lifts in previous lower percentile solutions. Moreover, those earlier solutions often took advantage of three short but very steep transitions (‘double black diamond’ runs).
rapid solutions up to the 28th percentile, albeit with elevated objective function values and
expected finish times.
The significant vertical gap in Figure 8 between the 19th and 20th percentile skier finish times
stems from the latter being unable to reach a final lift near the top of the mountain on time, following a route that includes Magic Chair at an earlier stage. However, leaving it as their final lift implies that the clock continues to run during a long final transition down to Magic Chair at the base of Blackcomb Mountain. This long transition also starts progressively later and takes progressively longer with each increasing skier percentile.
Aside from suggesting these additional restrictions for higher percentile skiers, our analysis of interim candidate solutions (from stages 1 and 2) provided other interesting insights. We noted that many early candidate solutions incurred time violations at the Fitzsimmons lift between its regular 11:00 am closing time and noon. The implication is that if WB were to keep the Fitzsimmons lift open an extra hour (even if only on weekends), they could vastly increase the accessibility of the Mega Day badge to a wider range of skiing abilities.
Secondly, although all final solutions included only 24 lift segments, stages 1-2 occasionally produced candidate solutions which included multiple rides on a single lift. However, none of these turned out to be time feasible full tour solutions.
Solutions for many percentiles shared a number of common lift sub-sequences, yet we obtained 27 distinct routes among 28 different percentile solutions. We explain this result by the fact that transition times increase disproportionately for different skier percentiles. Run b
may be twice as long as run a for a 20th percentile skier, but merely 50% longer for a 10%
percentile skier, consequently run b and/or its successors may trigger a time windows violation for the slower skier, but not for the faster skier.
2.10 Implementation
2.10.1 Recommended Route
We proposed the recommended Mega Day Challenge route based on the shortest time, and time windows feasible, solution for the 28th percentile skier. This route is depicted in Figure
9, with vertical axes showing lift rides in sequence including time windows. We also proposed a recommendation to skiers at Whistler-Blackcomb, based conservatively on the pace of a 20th percentile skier, that “if you can ski from the Roundhouse lodge to the Whistler
Village base in under 12 minutes, you should be quite capable of completing the Mega Day Challenge.”
Figure 2-9 Recommended Route for 28th Percentile Skier
The Mega Day route we recommend for a 28th percentile skier is shown in Figure 9 including
at the pace of a 1st percentile skier (dotted line) with a delayed start. This route should have
the greatest possibility of being completed by the largest number of skiers, since faster skiers can always delay their start time and/or adjust their pace of skiing to follow this route.
2.10.2 Validation by Trial
Author Lyons skied WB on 22 January 2017 and set out to follow a route recommended by our model for a 10th quantile skier. He boarded the first lift at 8:42 am and, notwithstanding a
detour caused by temporary closure of one lift, completed the Mega Day Challenge at 15:20 pm (in a total of 398 minutes). This time is quite consistent with times suggested by the model. Data obtained later showed that Lyons was the lone skier to complete a Mega Day challenge among over 15,000 skiers on the mountain that day.
Subsequently, we received an additional data file containing records of all Mega Day
minimal number of 24 lifts. In many cases the challenge was completed by groups of 2-4 skiers skiing together with the result that there had been to that date 64 Mega Day expeditions successfully completed.
We determined the routes followed in these 64 instances. These groups started from six different points: Whistler Village Gondola (19), Fitzsimmons Chair (31), Excalibur Gondola (2), Wizard Chair (1), Creekside Gondola (7) and Magic Chair (4). A surprising result was that every single one of these skier-group routes was distinct: no two groups actually followed the same sequence of 24 lifts!
These findings suggest that the Mega Day Challenge is a difficult accomplishment partly because there is no recognized or obvious ‘optimal’ route, despite the fact that for strong skiers, many routes are possible. Weaker skiers need to select their route more carefully if they are to accomplish the feat before the last lift closes.
2.11 Conclusion
WB’s introduction of the RFID system and associated WB+ web-application make extensive skier data available to enhance the skier’s experience by providing challenges and offering rewards. This ‘gamification’ of skiing opens up opportunities in the realm of analytics that mirror the rapid growth in the application of analytics in other predominantly team-based sports over the last two decades.
2.12 Acknowledgement
The authors wish to acknowledge the generous support of Whistler-Blackcomb, and especially their Business IT Support Team, for making data available and for their counsel and feedback, and anonymous Interfaces reviewers whose comments greatly improved this paper.
2.13 References (Chapter 2)
Biggs, N., E. K. Lloyd and R. J. Wilson (1976). Graph theory 1736-1936. Oxford [Eng.], Clarendon Press.
Campbell, A. M., M. Gendreau and B. W. Thomas (2011). "The orienteering problem with stochastic travel and service times." Annals of Operations Research 186(1): 61-81.
Cook, W. (2012). In pursuit of the traveling salesman: mathematics at the limits of computation. Princeton, N.J, Princeton University Press.
Dantzig, G., R. Fulkerson and S. Johnson (1954). "Solution of a large-scale travelling salesman problem." Operations Research(2): 393-410.
Dash, S., O. Günlük, A. Lodi and A. Tramontani (2012). "A Time Bucket Formulation for the Traveling Salesman Problem with Time Windows." INFORMS Journal on Computing 24(1): 132-147.
De Biagi, V., B. Friggo and B. Chiaia (2013). "A network-based approach for the study of criticalities in ski-resorts." International Snow Science Workshop Proceedings.
Desrosiers, J., Y. Dumas, M. M. Solomon and F. Soumis (1995). Chapter 2 Time constrained routing and scheduling, Elsevier B.V. 8: 35-139.
Eksioglu, B., A. V. Vural and A. Reisman (2009). "The vehicle routing problem: A taxonomic review." Computers & Industrial Engineering 57(4): 1472-1483.
Jünger, M., T. M. Liebling, D. Naddef, G. L. Nemhauser, W. R. Pulleyblank, G. Reinelt, G. Rinaldi, L. A. Wolsey and SpringerLink, Eds. (2010). 50 Years of Integer Programming 1958-2008: From the Early Years to the State-of-the-Art. Berlin, Heidelberg, Springer Berlin Heidelberg.
Kantor, M. G. and M. B. Rosenwein (1992). "The Orienteering Problem with Time Windows." The Journal of the Operational Research Society 43(6): 629.
Khan, A. (2010). "SCVNGR Gamifies Skiing At Stowe Mountain Ski Resort." AdWeek.
Letchford, A. N., S. D. Nasiri and D. O. Theis (2013). "Compact formulations of the Steiner Traveling Salesman Problem and related problems." European Journal of Operational Research 228(1): 83-92.
Öncan, T., İ. K. Altınel and G. Laporte (2009). "A comparative analysis of several
asymmetric traveling salesman problem formulations." Computers and Operations Research
36(3): 637-654.
Pesant, G., M. Gendreau, J.-Y. Potvin and J.-M. Rousseau (1998). "An Exact Constraint Logic Programming Algorithm for the Traveling Salesman Problem with Time Windows." Transportation Science 32(1): 12-29.
Sean (2013). "How Gamification Changed the Sport of Skiing (And How it Applies to Your Life)." Location Rebel (Blog).
Shealy, J. E., C. F. Ettlinger and R. J. Johnson (2005). "How Fast Do Winter Sports Participants Travel on Alpine Slopes?" Journal of ASTM International 2(7): 1-8.
Tas, D., M. Gendreau, O. Jabali and G. Laporte (2016). "The traveling salesman problem with time-dependent service times." European Journal of Operational Research 248(2): 372-383.
2.14 Appendix A – Lifts Information
The table below lists the 27 discrete lift segment members of N, along with which of the 24 lift groups G each belongs, their base and top elevations (metres above sea level), standard ride times, and typical opening and closing times.
Index Lift Name Lift System G Base Elev (metres) Top Elev (metres) Ride Time (mins) Lift Open (HH:MM) Lift Close (HH:MM) 8100 Whistler Village Gondola 1 684 1023 0:05:46 8:30 am 15:30 pm 105 Whistler G O Station 1 1023 1827 0:13:09 8:30 am 15:30 pm 145 Olympic Chair 2 1020 1145 0:06:30 8:45 am 15:45 pm 205 Excalibur Gondola 3 684 765 0:02:43 8:30 am 15:45 pm 255 Excalibur G Mid-Base 3 765 1133 0:05:36 8:30 am 15:45 pm 220 Solar Coaster 4 1250 1862 0:07:16 8:30 am 15:45 pm 234 Magic Chair 5 683 778 0:04:07 8:30 am 16:30 pm 235 7th Heaven 6 1660 2249 0:06:37 9:45 am 15:15 pm 240 Glacier 7 1547 2142 0:07:07 9:45 am 15:15 pm 245 Crystal Ridge 8 1282 1822 0:06:34 9:30 am 15:45 pm 260 Catskinner 9 1539 1860 0:09:10 10:00 am 15:45 pm 810 P2P W->B 10 1825 1878 0:11:07 9:15 am 15:45 pm 820 P2P B->W 10 1878 1825 0:11:07 9:00 am 15:45 pm 8110 Fitzsimmons 11 689 1021 0:06:43 8:30 am 11:00 am 8120 Creekside G 12 661 1302 0:07:52 8:15 am 15:30 pm 8130 Big Red 13 1301 1846 0:09:22 8:30 am 15:45 pm 8140 Garbanzo 14 1021 1676 0:07:43 8:30 am 15:45 pm 8150 Emerald 15 1413 1834 0:06:51 8:45 am 15:45 pm 8165 Showcase T 16 2146 2274 0:03:28 10:00 am 14:30 pm 8180 Harmony Six 17 1584 2102 0:06:07 9:15 am 15:00 pm 8190 Peak Express 18 1771 2172 0:03:46 9:15 am 15:15 pm 8195 Symphony 19 1529 2027 0:07:43 11:00 am 14:30 pm 8196 Whistler T 20 1786 1962 0:05:27 10:15 am 15:15 pm 8200 Wizard 21 688 1252 0:08:27 8:30 am 15:30 pm 8210 Excelerator 22 1131 1635 0:07:01 8:30 am 15:30 pm 8250 Jersey Cream 23 1547 1912 0:05:21 8:45 am 15:30 pm 8255 Horstman T 24 2047 2250 0:06:57 10:30 am 15:00 pm
Chapter 3
3
Elective Surgery Scheduling to Improve Perioperative Patient
Flow
3.1 Abstract
This paper addresses a practical problem of scheduling operating room (OR) elective surgeries to minimize the likelihood of surgical delays caused by unavailability of
capacity for patient recovery in a central post-anesthesia care unit (PACU). We segregate patients according to their patterns of flow through a multi-stage perioperative system and use characteristics of surgery type and surgeon booking times to predict time intervals for patient procedures and subsequent recoveries. Working with a hospital in which 50+ procedures are performed in 15+ ORs most weekdays, we develop a constraint programming (CP) model that takes the hospital’s elective surgery
pre-schedule as input and produces a recommended alternate pre-schedule designed to minimize the expected peak number of patients in the PACU over the course of the day. Our model was developed from hospital data and evaluated by application to daily schedules during a testing period. Schedules generated by the model indicated the potential to reduce the peak PACU load substantially, 20-30% during most days in our study period, or
alternatively reduce average patient flow time by up to 15% given the same PACU peak load. During the evaluation we also developed tools for schedule visualization that can be used to aid management both prior and post surgery day, to plan PACU resources,
propose critical schedule changes, identify the timing, location and root causes of delay, and to discern the differences in surgical specialty case mixes and their potential impacts on the system.
3.2 Introduction
expenditures, maintains an up-to-date public internet dashboard listing of surgical wait-times, for six key categories of procedures not only at the provincial level, but also by region and individual hospital.
London Health Sciences Centre (LHSC) is a 600-bed regional tertiary care hospital that has been exploring opportunities to increase surgical throughput by establishing some operating room (OR) schedule blocks as Rapid and Standardized Operating Rooms (called ‘RASTOR rooms”.) Their aim is to reduce wait-times in services where it exceeds the provincial averages, by more than double in some service categories. While these RASTOR rooms involve more numerous and shorter procedures than other ORs, they operate within the same perioperative system which includes a centralized Post Anesthesia Care Unit (PACU).
More rapid patient-procedures in these RASTOR rooms create an imperative that these ORs can function without obstruction from external processes and conditions, as happens when a patient whose surgery has been completed cannot be moved from the OR due to the PACU being at full capacity. This delays the subsequent patient, causes lost OR time for the surgeon, and is a waste of utilities and staff time to support open ORs, often re-incurring added costs later at higher overtime rates. Meanwhile, some of the PACU bed capacity may be occupied inappropriately, due to a downstream patient destination being unable to receive a patient into the next stage of care, either a hospital ward or PACU2 (step-down recovery, just prior to discharge from the hospital.)