Western University Western University
Scholarship@Western
Scholarship@Western
Electronic Thesis and Dissertation Repository
11-7-2019 1:00 PM
A new algorithm for primer design
A new algorithm for primer design
Debanjan Guha Roy
The University of Western Ontario Supervisor
Ilie, Lucian
The University of Western Ontario
Graduate Program in Computer Science
A thesis submitted in partial fulfillment of the requirements for the degree in Master of Science © Debanjan Guha Roy 2019
Follow this and additional works at: https://ir.lib.uwo.ca/etd
Part of the Other Computer Sciences Commons
Recommended Citation Recommended Citation
Guha Roy, Debanjan, "A new algorithm for primer design" (2019). Electronic Thesis and Dissertation Repository. 6643.
https://ir.lib.uwo.ca/etd/6643
This Dissertation/Thesis is brought to you for free and open access by Scholarship@Western. It has been accepted for inclusion in Electronic Thesis and Dissertation Repository by an authorized administrator of
Abstract
The Polymerase Chain Reaction (PCR) technology is widely used to create DNA copies. It has impacted many diverse fields including genetics, forensics, molecular paleontology, medical applications and environmental microbiology.
The main object in PCR is a primer, a short single strand of DNA, about 18-25 bases long, that serves as the starting point of DNA synthesis. Primers are essential for DNA repli-cation because the enzymes that catalyze this process, DNA polymerases, can only add new nucleotides to an existing strand of DNA. The PCR starts at the 30end of the primer and copies the opposite strand.
Designing good primers is essential for a successful PCR process. Primer3 is one of the main available programs that produce primers for a variety of applications. Other programs, such as PrimerBLAST, QuantPrime and PRIMEGENS, depend on Primer3 for generating can-didate primers and then subject them to specificity checking. The primers produced must not have high similarity with sequences other than their targets, as this would enable unwanted cross-hybridization. We will discuss these techniques, focusing on the parameters required for designing good primers and the pros and cons of some of the above mentioned programs. We introduce a new program, bestPrimer, that produces better primers and runs faster as shown by extensive comparison with Primer3.
Keywords:DNA, Primer, Polymerase Chain Reaction, Primer3, bestPrimer
Summary for lay audience
DNA samples needs to be amplified into multiple copies for research purposes. This can be done using a technology called Polymerase Chain Reaction (PCR), which has impacted many diverse fields including genetics, forensics, molecular paleontology, medical applications and environmental microbiology. The process requires a small fragment of DNA called a primer, which acts as the starting point of the DNA replication.Primers are essential for the PCR reac-tion to be successful, because the replicareac-tion can only take place from one of the specific ends of the primer.
There are several programs available for designing primers. Primer3 is one popular gram for primer design that considers several factors for designing primers. The primers pro-duced must not have high similarity with sequences other than their targets, as this would enable unwanted cross-hybridization. We will discuss these techniques, focusing on the pa-rameters required for designing good primers and introduce a new program, bestPrimer, that produces better primers and runs faster as shown by extensive comparison with Primer3.
Acknowlegements
First, I would like to show my most sincere gratitude to my advisor Dr Lucian Ilie for his valuable guidance and useful criticism. Without his encouragement and feedback, it wouldn’t have led to the completion of this thesis. I would like to thank my mother Swati Sarkar for her unconditional love and support through thick and thin. Last but not least, I would like to thank all my lab mates, especially Valeria Cesar for always encouraging me to stay motivated and Qin Dong for guiding me to overcome any hurdle.
Contents
Abstract i
Summary for lay audience ii
Acknowlegements iii
List of Figures vi
List of Tables viii
1 Introduction 1
2 Background 3
2.1 Molecular biology . . . 3
2.1.1 Organisms and cells . . . 3
2.1.2 DNA, RNA and proteins . . . 4
2.1.3 Nucleic acid thermodynamics . . . 5
2.2 Polymerase Chain Reaction (PCR) and primers . . . 6
2.2.1 Types of PCR . . . 7
2.2.2 PCR-field of applications . . . 9
2.2.3 Types of PCR primers . . . 11
2.3 Factors for primer design . . . 11
2.4 Sequence similarity search . . . 14
2.4.1 Dynamic programming . . . 14
Smith-Waterman algorithm . . . 14
Needle-Wunsch algorithm . . . 15
BLAST . . . 17
2.5 Leading programs for primer design . . . 17
2.5.1 Primer3 . . . 17
Primer design tasks . . . 18
Improved thermodynamic models . . . 18
New search algorithm . . . 20
Primer3Plus . . . 20
2.5.2 Primer-BLAST . . . 20
Specificity checking module . . . 20
2.5.3 QuantPrime . . . 21
Pre-filtering . . . 21
Specificity testing algorithm . . . 21
2.5.4 PRIMEGENS . . . 22
Algorithm . . . 23
3 A new algorithm for primer design 25 3.1 Multiple spaced seeds . . . 25
3.2 Problems with existing design . . . 25
3.3 The bestPrimer algorithm . . . 26
3.3.1 DNA encoding . . . 28
3.3.2 GC content . . . 28
3.3.3 Melting temperature . . . 28
3.3.4 Similarity search . . . 29
Hash table construction . . . 29
Initial similarity search . . . 31
Thorough similarity search . . . 31
3.3.5 Secondary structures . . . 31
3.3.6 Best primer selection . . . 32
3.4 30end mismatches . . . 33
4 Evaluation 34 4.1 Operation environment . . . 34
4.2 Data sets . . . 34
4.3 Evaluation . . . 35
4.4 Comparison . . . 35
4.4.1 GC content evaluation . . . 36
4.4.2 Melting temperature evaluation . . . 36
4.4.3 Closest non-target similarity . . . 36
4.4.4 Distance between consecutive primers . . . 37
4.4.5 Primer-dimer propensity . . . 38
5 Conclusion 51
Bibliography 52
Curriculum Vitae 54
List of Figures
2.1 An eukaryotic cell. . . 4
2.2 Structure of DNA and RNA . . . 5
2.3 Relationship between genome, chromosome and genes. . . 6
2.4 DNA denaturation and renaturation. . . 7
2.5 Hydrogen bonds between base pairs. . . 8
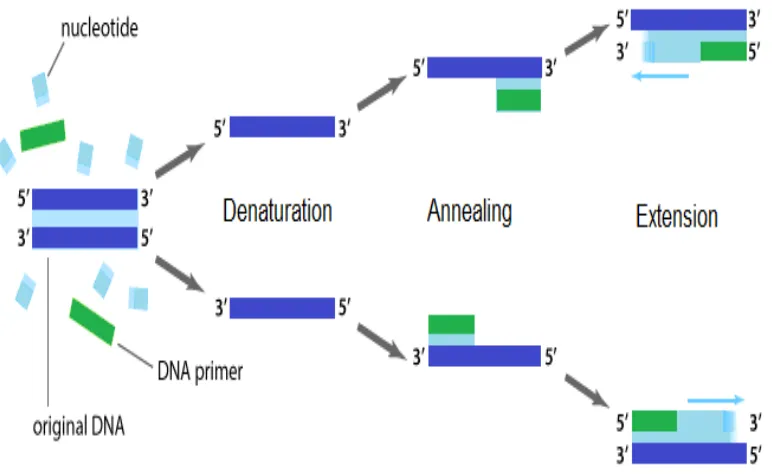
2.6 Steps in PCR. . . 9
2.7 Forward and Reverse Primer. . . 10
2.8 Melting temperature of DNA. . . 12
2.9 Relation between GC Content and melting temperature. . . 13
2.10 Types of secondary structures. . . 13
2.11 Smith-Waterman alignment of two sequences. . . 15
2.12 Local alignment Vs Global alignment. . . 15
2.13 Needleman-Wunsch alignment of two sequences. . . 16
2.14 BLAST will extend the consecutive matches to find more similarities. . . 17
2.15 Three types of Primer3 task. . . 19
2.16 Work flow overview of the primer pair design algorithm. . . 22
2.17 Work flow overview of the primer pair specificity testing algorithm . . . 23
2.18 A flowchart to show how PRIMEGENS works. . . 24
3.1 Comparison between consecutive and spaced seeds. . . 26
3.2 Comparing sensitivity of a spaced seed and BLAST seed. . . 27
3.3 GC content evaluation. . . 29
3.4 Multiple spaced seeds used in the homology search phase. . . 30
3.5 Examples of secondary structures. . . 32
4.1 Multiple spaced seeds used in the evaluation algorithm. . . 35
4.2 GC content distribution for theMus musculus chromosome 17data set . . . 37
4.3 GC content distribution for theMus musculus chromosome 6data set . . . 38
4.4 Melting temperature distribution for theMus musculus chromosome 17 data set . 39 4.5 Melting temperature distribution for theMus musculus chromosome 6 data set . 40 4.6 Closest non-target similarity distribution for theMus musculus chromosome 17 data set . . . 41
4.7 Closest non-target similarity distribution for theMus musculus chromosome 6 data set . . . 42
4.8 The number of primers at various levels of similarity with the closest non-target for theMus musculus chromosome 17data set . . . 43
4.9 The number of primers at various levels of similarity with the closest non-target
for theMus musculus chromosome 6data set . . . 44
4.10 Distance between consecutive primers for the Mus musculus chromosome 17 data set . . . 45
4.11 Distance between consecutive primers for the Mus musculus chromosome 6 data set . . . 46
4.12 Delta G distribution for theMus musculus chromosome 17data set . . . 47
4.13 Delta G distribution for theMus musculus chromosome 6data set . . . 48
4.14 Score distribution for theMus musculus chromosome 17data set . . . 49
4.15 Score distribution for theMus musculus chromosome 6data set . . . 50
List of Tables
2.1 Smith-Waterman Vs Needleman-Wunsch algorithm. . . 16
3.1 Encoding of input sequence . . . 28 3.2 Nearest-Neighbor parameters for DNA/DNA duplexes. . . 30
4.1 Comparison of bestPrimer Vs Primer3 on the Mus musculus chromosome 17 data set. . . 36 4.2 Comparison of bestPrimer Vs Primer3 on the Mus musculus chromosome 6
data set. . . 36 4.3 Number of primers with different non-target similarities for theMus musculus
chromosome 17data set. . . 40 4.4 Number of primers with different non-target similarities for theMus musculus
chromosome 6data set. . . 41
Chapter 1
Introduction
Polymerase Chain Reaction (PCR) is a common laboratory technique used to make millions of copies of a region of DNA. PCR requires a DNA polymerase enzyme that makes new strands of DNA. The DNA polymerase generally used in PCR is calledTaqpolymerase. Taqpolymerase can only make DNA if it is given a primer. Primers are short single-stranded artificial DNA (oligomers) about 18 to 25 nucleotides long that matches the beginning and end of the DNA fragment to be amplified. The primers anneal to a specific region in the DNA template by complementary base pairing. After the primers bind the DNA-Polymerase binds and begins the synthesis of the new DNA strand.
PCR and primer design application are diverse. PCR is used in many different areas of biology and medicine including molecular biology research, medical diagnostics and even some branches of ecology. Choosing the right primer for PCR is one of the most crucial factors determining the outcome and quality of the PCR.
There are several programs available for designing PCR and sequencing primers. Primer3 [1] is one of the widely used programs in this field. Other programs like Primer-BLAST [2] , QuantPrime [3] and PRIMEGENS [4] use the Primer3 software to design primer pair can-didates with added functionalities. Primer3 does not perform target analysis, i.e., it does not take into consideration the similarity of suggested primers with their non-targets. Since they allow primers having high similarity with unintended targets, this leads to unwanted cross-hybridization. QuantPrime is a specialized tool to design target-specific primers for detecting mRNA in real-time PCR. Likewise, the PRIMEGENS Sequence Specific Primer Design tool can be used for specific primer design for a limited number of organisms. However, neither of these tools guarantees an accurate count of nucleotide matches between primer and target since they both use a local alignment algorithm (i.e., BLAST) alone for the similarity search and thus may miss part of alignment between primer and target. Primer-BLAST uses BLAST along with the Needleman-Wunsch (NW) global alignment algorithm [5] to look for matches between the primers and targets.
Apart from specificity check, several other factors are considered for designing a good primer such as:
• GC content
• Melting Temperature
2 Chapter1. Introduction
• Secondary structures etc.
We present a new standalone program bestPrimer that designs highly specific primers after con-sidering all factors and performing a thorough similarity search using multiple spaced seeds computed by SpEED [6] .bestPrimer produces better primers and finds the largest number of unique primers for the given template sequence as shown by extensive comparison with Primer3. This tool can also be used to evaluate the specificity of pre-existing primers. best-Primer is implemented using C++and OpenMP. It does not use any external software, is easy to use and allows the user to adjust a variety of parameters through command line argument.
Chapter 2
Background
In this chapter, we introduce the basic concepts and definitions of molecular biology, followed by the concepts of Polymerase Chain Reaction (PCR) and primers. Then we explain the central problem of this thesis, primer design, and discuss some of the leading programs in this field.
2.1
Molecular biology
In this section, we present a brief introduction to basic terminology of molecular biology in order to have a better insight into the following topics.
2.1.1
Organisms and cells
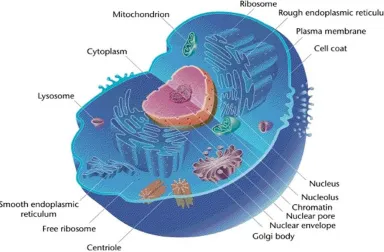
An organism is an individual entity that exhibits the properties of life [7]. Each organism is a living framework made from one or more cells. Some organisms are composed of a single cell, called unicellular organisms and others are composed of many units, called multi-cellular organisms. A cell is called the structural and functional unit of life [8]. It is a functional unit because all the functions of the body such as physiological, biochemical, genetic and other metabolic functions are carried out by cells. Cells are classified into two types, Prokaryotic cells which are usually singleton and Eukaryotic cells which are found in a multi-cellular or-ganism (Fig.2.1). Prokaryotic cells lack a nuclear membrane, so DNA is unbound inside the cell while eukaryotic cells have a nuclear membrane. All cells, regardless of whether prokary-otic or eukaryprokary-otic, have a membrane, which wraps the cell, isolates its inside from its environ-ment, directs what moves in and out, and keeps up the electric potential of the cell. Inside the membrane, a salty cytoplasm takes up the greater part of the cell volume. All cells have DNA, the hereditary material of genes, and RNA, containing the information important to build dif-ferent proteins such as enzymes. There are additionally other kinds of bio-molecules in a cell. All cells share several similar functions such as reproduction, metabolism, transportation and secretion of substances.
4 Chapter2. Background
Figure 2.1: An eukaryotic cell. (biologydictionary.net)
2.1.2
DNA, RNA and proteins
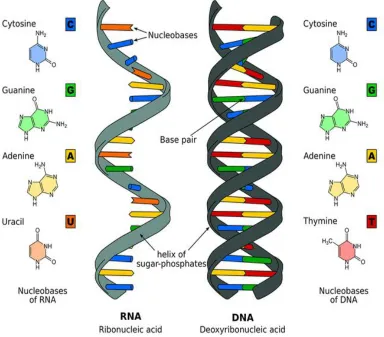
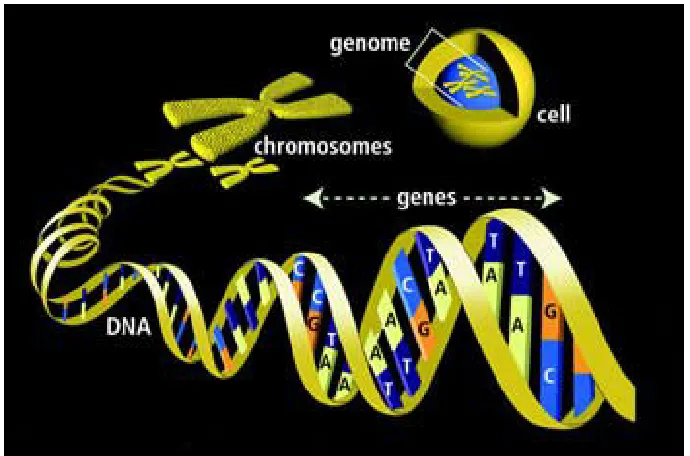
DNA, deoxyribonucleic acid, is the blueprint of life in humans and almost all other organisms [9]. It contains the information the cell requires to synthesize protein and to replicate itself. The famous double helical structure of DNA has its own significance (Fig.2.2). The information in DNA is stored as a code made up of four nucleotide bases, which make up the DNA: Adenine (A), Guanine (G), Thymine (T) and Cytosine(C). Each base has its complementary base, which means in the double helical structure of DNA, A will have T as its complement and similarly G will have C. DNA molecules are incredibly long. The complete set of DNA sequences is called genome. The human genome contains approximately 3 billion base pairs. The DNA is broken down into bits and is tightly wound into coils, which are called chromosomes; human beings have 23 pairs of chromosomes. These chromosomes are further broken down into smaller pieces of code called genes. The 23 pairs of chromosomes consist of about 70,000 genes and every gene has its own function. A gene is the basic physical and functional unit of heredity. Some genes act as instructions to make molecules called proteins. However, many genes do not code for proteins. The relationship between genome, chromosomes and genes is shown in the Fig.2.3.
2.1. Molecular biology 5
sequence of RNA translates a gene’s message into a protein’s amino acid sequence. It is the protein that determines the trait.
All nucleic acids have two distinctive ends: the 50-end and 30-end. This terminology refers
to the 50 and 30 carbons on the sugar. For both DNA and RNA, the 50-end bears a phosphate, and the 30-end a hydroxyl group.
Figure 2.2: Structure of DNA and RNA. (Wikimedia Commons.)
2.1.3
Nucleic acid thermodynamics
6 Chapter2. Background
Figure 2.3: Relationship between genome, chromosome and genes.
(http://www.differencebetween.info/difference-between-gene-and-genome).
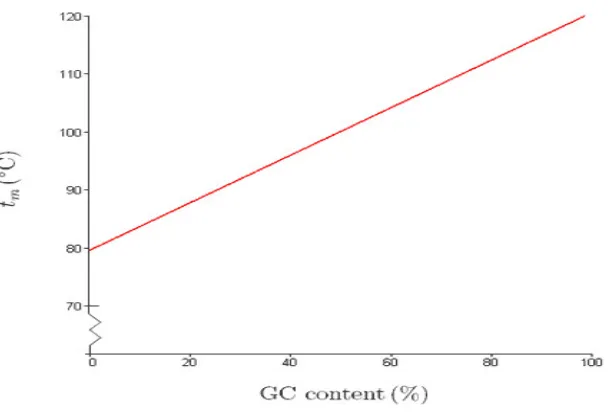
with less GC content is less stable than DNA with higher GC content, however, the stabil-ity of DNA does not depend on the hydrogen bonds but rather on base stacking. GC content (Guanine-Cytosine content) is the percentage of nitrogenous bases in the DNA molecule, which is directly proportional to the melting temperature of the DNA. Melting temperature of DNA is the temperature when half of the strands are in the double-helical state and half are in the random-coil state.
Several studies have been proposed to determine the melting temperature of DNA. The Nearest Neighbor model is a widely used approach [11]. We will explain the concepts of GC content and melting temperature and why they are crucial in our problem along with the approach used to calculate the melting temperature of DNA in details in Chapter 3.
2.2
Polymerase Chain Reaction (PCR) and primers
2.2. PolymeraseChainReaction(PCR)and primers 7
Figure 2.4: DNA Denaturation and Renaturation.
(https://courses.lumenlearning.com/microbiology/chapter/structure-and-function-of-dna/)
place at the 30-end of the primer. An amplicon is a piece of DNA or RNA that is the source and/or product of amplification or replication events. Although primers can be composed of RNA, DNA primers are more suitable for PCR because they are more temperature stable.
2.2.1
Types of PCR
Over the years many variations of the basic PCR technique have been developed, some of which follow the original technique and others which follow on from or resemble an entirely different form.
8 Chapter2. Background
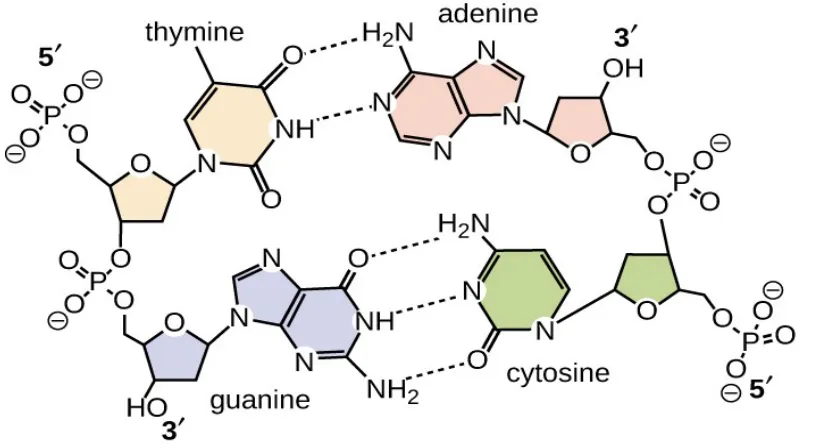
Figure 2.5: Hydrogen bonds between base pairs.
(https://courses.lumenlearning.com/microbiology/chapter/structure-and-function-of-dna/)
of transcribed DNA.
Nested PCRis another similar technique, which aims to reduce non-specific amplification of the DNA template. This process includes two primer sets and two successive PCR reactions. The first reaction is performed with primers that cover the target sequence and some additional sequence flanking both ends of the target sequence. After the first reaction, a second reaction is carried out on the products of the first PCR with primers that bind to the target sequence and are within the amplified sequence of the first PCR. This reduces the amount of non-specific binding because, in the second reaction, most of the amplicons of the first reaction only contain the target sequence and its surrounding sequences.
Multiplex PCRis used to amplify several different DNA sequences within the same sam-ple. This is achieved by using multiple primers at the same time. However, there are several factors which must be paid attention to. The primers must have minimal overlap between primer specificity. Cross-template binding can be a disaster. The primers must be short usually 18-22 base pairs long, such that the chance of any cross-hybridization is minimized. Fur-thermore, it is highly important that the different primers all respond and anneal at similar temperatures. If all the above conditions are met it is possible to replicate huge amounts of different DNA in a single PCR process instead of using multiple PCR, saving a lot of time and money.
vari-2.2. PolymeraseChainReaction(PCR)and primers 9
Figure 2.6: Steps in PCR.
(https://www.xxpresspcr.com/wp-content/uploads/Application-Note-Past-to-Future.pdf)
ations. Otherwise can be split into two test tubes, with the reverse transcriptase creating the complementary DNA in one tube, and the PCR process is performed in another. This method effectively allows for extremely low quantities of RNA to be detected, through amplification of the complementary DNA which it encodes for.
Assembly PCRis a common technique used within artificial gene synthesis. This tech-nique takes many short sections of DNA and utilizes DNA polymerase to effectively stitch them together, forming large strands of connected DNA. Stitching together of many small fragments requires careful optimization of the assembly. The first step in this process involves constructing a long sequence. For this, many overlapping oligonucleotides of DNA are slowly bound together during each temperature cycle. Once the entire target sequence is constructed, regular PCR can be used to amplify the larger chain, independent of all the smaller fragments.
2.2.2
PCR-field of applications
PCR has impacted many diverse fields including medicine, molecular paleontology and foren-sics.
10 Chapter2. Background
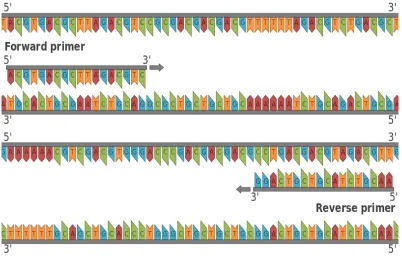
Figure 2.7: Forward and Reverse Primer.(from Wikipedia)
Modern medicine has several applications of PCR, for example, PCR has become an important tool in the field of cancer research. It can be used to detect some virally-induced cancers such as cervical cancer caused by the HPV (Human Papilloma Virus). PCR is also used in the field of medicine to help choose appropriate treatment for the patient. For instance, where a cancer patient’s DNA shows a specific genetic mutation that could indicate whether they will respond better to one treatment over another. Another important medical application of PCR is in the procedure of tissue typing for patients who need to undergo an organ transplant. Yet another common usage of PCR is paternity testing.
Infectious diseases in birds, animals or humans can be detected and monitored using PCR. PCR is faster than other methods to identify infectious diseases, which allow starting treatment at an early stage. PCR can identify both fungal and parasitic infection and can, for example, detect HIV infection even before any antibodies have been produced. DNA amplification is a routine method for screening donated blood to prevent infected blood to enter blood bank. In dentistry, PCR is used to diagnose maxillofacial infections, periodontal disease and mouth cancers.
In the field of genetic engineering, PCR has several applications such as gene sequencing, cloning and genotyping, and to amplify and copy DNA sequences for introduction into the host organism. It can be used to diagnose genetic diseases even before birth.
2.3. Factors for primer design 11
In environmental microbiology, PCR techniques have been proved to be useful in several aspects; for example, they are used to help detect and identify harmful bacteria and pathogens in public water supplies. PCR is also used to detect degrading microorganisms where toxic waste and pollution spills have occurred. This helps in determining the remedial measure and hasten the implementation of clean-up operation.
2.2.3
Types of PCR primers
There are several types of primers, choosing the right primer is of utmost importance for the outcome and quality of PCR, using the wrong primer can even cause the reaction to fail. There-fore, the more information we know about the DNA sequence the easier it will be to choose the right primer.
Primer pair consists of a forward and a reverse primer. It is important that both the primers have similar melting temperatures to facilitate a successful PCR reaction. Software available identifies potential primer pairs providing their melting temperature and other primer properties.
Universal primers, as the name suggests, are primers that anneal with many different types of DNA templates. Universal primers are used in many PCR reactions and relate to nucleotide sequences that are commonly found in cloning vectors and DNA molecules.
Specific primers are used in places where the genetic sequence is already known, or a specific gene is a target. In these cases, specific primers can be used to amplify the DNA, rather than universal primers. Specific primers can be purposefully designed to amplify a particular gene, which increases the success rate of PCR.
Special primersinclude those that incorporate fluorescent dye markers which are useful in several research applications.
Degenerate primersare composed of two similar primers, although very similar but not exactly the same. They have specific uses, such as for copying the same gene from two different organisms and are widely used in microbial ecology.
2.3
Factors for primer design
The goal of primer design is producing good primers. There are several critical requirements to design a good primer or primer pair for a successful reaction.
Melting temperature: Primer melting temperature (Tm) by definition is the temperature at which half of the DNA duplex strands are in the double helical state and half are in the random coil state (Fig.2.8) [14]. Denaturation is the process in which proteins or nucleic acid lose the highly ordered structure in its natural state by application of some external stress (by heating, by treatment with alkali, acid, urea, or detergents). Primers with melting temperature in the range 57-63◦ Celsius produce the best results. The GC content of the sequence gives a fair
indication of the primer’s Tm because Tm is directly propostional to GC content.
12 Chapter2. Background
Figure 2.8: Melting temperature of DNA.(researchgate.net)
have a significant impact on stabilization, the stabilization is mainly due to interactions of base stacking. Primers with GC content 40-60% are most stable and ensure stable binding between the primer and template. The relation between GC content and melting temperature is shown in the Fig.2.9.
Primer length: The optimal length of primers is 18-22 base pair (bp) long. This length is long enough for adequate specificity and short enough for primers to bind easily to the template at the annealing temperature.
Secondary structures: Nucleic acid secondary structure is the base pairing interactions within a single nucleic acid polymer or between two polymers. Presence of secondary struc-tures in the primers due to inter-molecular or intra-molecular interactions can result in poor or no yield of product. Secondary structures adversely affect primer-template annealing and thus amplification. There are three types of secondary structures that needs to be avoided while designing primers. First, self-dimers are formed by inter-molecular interactions between two primers (same sense), where the primer is homologous to itself. Second, cross-dimers are formed by inter-molecular interaction between a forward and a reverse primer, where they are complementary to each other. And hairpins loops are formed by intra-molecular interactions within the primer (Fig.2.10).
2.3. Factors for primer design 13
Figure 2.9: Relation between GC Content and melting temperature.
(http://www.biology.arizona.edu/biomath/tutorials/linear/linearfunctionapplication/dnamelt.html)
Figure 2.10: Types of secondary structures.(researchgate.net)
30-end mismatches: A number of studies have shown that a target can be amplified even if it has a few mismatches to the primer. Mismatches towards the 30-end affect target amplification much more than mismatches towards the 50-end [2]. It has been established that at least a
14 Chapter2. Background
2.4
Sequence similarity search
Similar sequences usually have similar functions. Therefore, it is very important to detect sequence similarity. Sequence identity is described as the amount of characters which match exactly between two different sequences. This can be done using a slow dynamic programming algorithm such as Smith-Waterman [15] or Needleman-Wunsch algorithm [5] or a fast heuristic one such as BLAST [16]. We discuss them briefly in this section.
2.4.1
Dynamic programming
Dynammic programming is an optimization over plain recursion. The idea is to simply break the problem into sub-problems, store the results of sub-problems, so that we do not have to re-compute them when needed later. This simple optimization reduces time complexities from exponential to polynomial.
Smith-Waterman algorithm
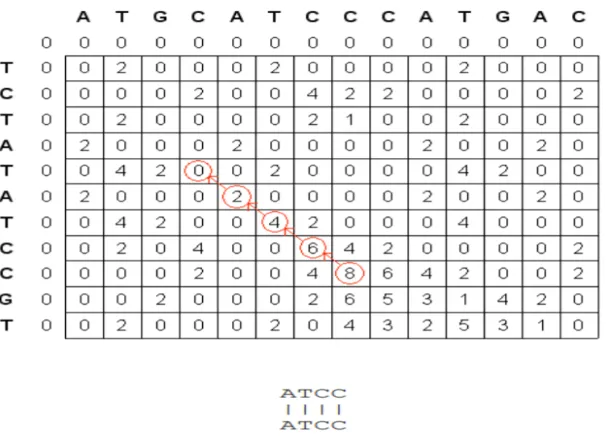
The Smith -Waterman algorithm [15] is a local alignment algorithm i.e. it finds the best local alignment between two sequences (Fig.2.12).. A local alignment between two sequences is an alignment between parts of the two sequences. It applies dynamic programming to compare biological sequences. The Smith–Waterman algorithm has several steps:
• Determine the substitution matrix and the gap penalty scheme: A substitution matrix assigns each pair of bases a score for match or mismatch. Matches get positive scores, whereas mismatches get relatively lower scores. A gap penalty function determines the score cost for opening or extending gaps.
• Initialize the scoring matrix: The dimensions of the scoring matrix are 1+length of each sequence respectively. All the elements of the first row and the first column are set to 0. The extra first row and first column make it possible to align one sequence to another at any position, and setting them to 0 makes the terminal gap free from penalty.
• Scoring: Score each element from left to right, top to bottom in the matrix, considering the outcomes of substitutions (diagonal scores) or adding gaps (horizontal and vertical scores). If none of the scores are positive, this element gets a 0. Otherwise the highest score is used and the source of that score is recorded.
• Traceback:Starting at the element with the highest score, traceback based on the source of each score recursively, until 0 is encountered. The segments that have the highest similarity score based on the given scoring system are generated in this process. To obtain the second best local alignment, apply the traceback process starting at the second highest score outside the trace of the best alignment.
Creating the alignment matrix and backtracking in it to find the optimal alignment takes O(nm) time and space. Fig.2.11 illustrates an example of local alignment using the Smith-Waterman algorithm for the given sequences X = ATGCATCCCATGAC and Y
2.4. Sequence similarity search 15
Figure 2.11: Smith-Waterman alignment of two sequences. (Wikipedia)
Figure 2.12: Local alignment Vs Global alignment. (By Yz cs5160 - Own work, CC BY-SA 4.0,
https://commons.wikimedia.org/w/index.php?curid=54415549)
Needle-Wunsch algorithm
16 Chapter2. Background
Table 2.1: Smith-Waterman Vs Needleman-Wunsch algorithm.
(https://www.cs.utoronto.ca/brudno/bcb410/lec2notes.pdf)
Smith-Waterman Needleman-Wunsch
Initialization First row and first column are set to 0 First row and first column are subject to gap penalty Scoring Negative score is set to 0 Score can be negative
Traceback Begin with the highest score, end when 0 is encountered Begin with the cell at the lower right of the matrix, end at top left cell
sequences. Both algorithms use the concepts of a substitution matrix, a gap penalty function, a scoring matrix, and a traceback process. Three main differences are shown in Table 2.1.
The most important distinction is that no negative score is assigned in the scoring system of the Smith-Waterman algorithm, which enables local alignment. When any element has a score lower than zero, it means that the sequences up to this position have no similarities; this element will then be set to zero to eliminate influence from previous alignment. In this way, calculation can continue to find alignment in any position afterwards.
The initial scoring matrix of Smith–Waterman algorithm enables the alignment of any segment of one sequence to an arbitrary position in the other sequence. In Needleman–Wunsch algorithm, however, end gap penalty also needs to be considered in order to align the full sequences. The time complexity of the algorithm for two sequences of length n and m isO(mn) and since the algorithm fills ann×mtable the space complexity isO(mn). As an example to perform global alignment using Needleman-Wunsch algorithm between the two sequences; X
= ACTGATTCA and Y= ACGCATCA, using -2 as a gap penalty, -3 as a mismatch penalty, and 2 as the score for a match, results in the following alignment Fig.2.13:
Figure 2.13: Needleman-Wunsch alignment of two sequences.
2.5. Leading programs for primer design 17
BLAST
The Smith-Waterman and Needle-Wunsch dynamic programming algorithm for alignment are highly accepted due to its high sensitivity, however its quadratic time complexity makes it im-possible to be used with large genome sequences. Thus, heuristic approaches that can identify similarities between sequences were needed. BLAST [16] also known as Basic Local Align-ment Search tool, became the most widely used algorithm in finding similarities. It is assumed that high similarity implies sharing a long sub-string which results in local alignment of the two sequences. BLAST uses a consecutive seed 11111111111 to select 11 consecutive posi-tions which are identical. A ’1’ denotes a match and 11 consecutive matches are called a hit. BLAST finds pairs of such matching strings and then attempts to extend similarity both ways (Fig.2.14). Consecutive matches are easy to find, but BLAST may miss some high similarity where all positions match, except for every eleventh one. The similarity is about 91%, but BLAST fails to detect it.
Figure 2.14: BLAST will extend the consecutive matches to find more similarities.
2.5
Leading programs for primer design
A significant amount of research has been conducted on the topic of primer design. In this section we discuss the algorithms of some of the leading programs available for primer design.
2.5.1
Primer3
18 Chapter2. Background
pair. The program accepts more than 150 parameters which is far too much information to be supplied on the command line. It reads most of its inputs from flat text files (boulder IO format). It consists of a command line C program, primer3 core and has web interfaces - the original web interface, Primer3web and the newer Primer3Plus. However, primer3 core is the underlying engine for all primer design tasks.
In the current version of Primer3 several enhancements have been made since its initial release.
Primer design tasks
Primer3 can perform the following primer design tasks (Fig.2.15):
• generic: This task includes the standard primer pair design for PCR amplification of a DNA template.
• check primers: This option is used to evaluate existing primers even in the absence of a template sequence. Primer3 evaluates whether the primer or primer pair satisfies the user specified constraints and also provides additional information describing aspects of the primers and primer pairs such as melting temperature, propensity to form secondary structures, product size, etc.
• pick sequencing primers: This task allows to design a series of unpaired forward and reverse primers on the template strand for Sanger sequencing reads. The spacing between successive forward and reverse primers are governed by arguments.
• pick primer list: This allows to generate a list of legal forward and reverse primers with-out regard to their positions relative to each other.
Improved thermodynamic models
Primer3 incorporates nearest-neighbor thermodynamic models with up-to-date nearest-neighbor parameters and salt correction formula for melting temperature calculations and estimating the propensity of primers to hybridize at unintended sites. The same approach is used for calculat-ing the stability of potential hairpin structures within the primers.
Nearest-neighbor thermodynamic models offer the most accurate approach for predicting the energetic stability of DNA structures [11]. These models estimate duplex stability by con-sidering not only the effects of the number of hydrogen bonds linking base pairs but also the effects of the stacking of neighboring base pairs along the length of the duplex. For example, due to stacking, the stability of of 50-CT-30 hybridized to 30-GA-50 is different from that of
2.5. Leading programs for primer design 19
Figure 2.15: Three types of Primer3 tasks. [1]
concentrations that influence the stability of primer binding and potential secondary structures [18, 19, 20, 21, 22, 23, 24] .
Primer3 recommends the use of thermodynamic parameters and formula for melting tem-perature calculation and salt correction suggested in the paper [11].
Using default salt and DNA concentrations we have
T m=deltaH/(deltaS +R×ln(C/4) ) (2.1)
where R is the gas constant (1.987 cal/K mol) and C is the DNA concentration.
Using these models, Primer3 estimates the melting temperature of oligos and also predicts the strength of three types of secondary structures: two types of bi-molecular interactions (’ANY’ and ’END’) and one type of uni-molecular interactions. ANY interactions involve the binding of an oligo (a primer or a hybridization oligo) anywhere within its sequence to another DNA molecule, while END interactions involve the binding of 30-end of a primer to another
20 Chapter2. Background
Primer3 expresses the stability of secondary structures as melting temperatures. The methods for calculating melting temperatures for ANY and END bi-molecular interactions and uni-molecular hairpin structures are extensions of those used to calculate melting temperatures for oligos.
New search algorithm
The original algorithm looked for the best primer pairs by considering legal combinations of reverse and forward primers. It used a branch and bound approach [25] based on penalties associated with the individual primers. In the new implementation, to speed up the search instead of inefficiently re-evaluating possible pairs every time it had to find the next best pair, each pair is evaluated at most once, and then its characteristics are stored in memory which requires higher memory usage. In order to minimize the memory used, the characteristics are stored in a hash map and, therefore, allocates memory for a pair only when necessary. The algorithm also postpones computing some expensive-to-compute characteristics of primers until it is known that the primer might be part of a legal primer pair.
Primer3Plus
As mentioned earlier, Primer3 has two web interfaces- the original Primer3web, and the newer Primer3Plus [26], which is easier to use and harnesses the full power of Primer3. It offers several tabs from which all Primer3 parameters are accessible, including the thermodynamic parameters. All primer design tasks available in Primer3 are also available in Primer3Plus. All tasks invokes the primer3 core for primer selection.
2.5.2
Primer-BLAST
Primer-BLAST [2] is a tool to design target-specific primers for polymerase chain reaction. The program consists of a module for generating candidate primer pairs and a module for checking the target specificity of the generated primer pairs. Primer3 is used to generate the candidate primer pairs for a given template sequence. Primer-BLAST then uses BLAST along with the Needleman-Wunsch (NW) global alignment algorithm [5] to look for matches between the primers and targets.
Specificity checking module
2.5. Leading programs for primer design 21
pair is considered to be specific only if it has no amplicons on any targets other than the sub-mitted template within the specificity checking threshold specified by the user. Otherwise, it is deemed non-specific. Primer-BLAST also checks amplicons arising from either primer alone.
2.5.3
QuantPrime
QuantPrime [3] offers primer pair design and specificity checking for small-to large-scale quan-titative PCR (qPCR). It consists of two main algorithms, one for primer pair design and one for specificity checking. The primer pair design algorithm uses the Primer3 program to generate primer pair candidates.
Pre-filtering
Apart from Primer3 selection criteria, the primer pair candidates are filtered based on several conditions (Fig.2.16):
• QuantPrime filters out primer pair candidates with too many G or C bases within the last five bases of the 30-end of a primer which cannot be controlled by Primer3. The default setting is maximum three G or C bases in the last five bases of a primer.
• QuantPrime favors primers for amplicons at the 30-end of the transcript (the last 1000
bp).
• In cases where multiple polyadenylation signals exist in the 30-end UTR, QuantPrime avoids priming in this region as it could lead to biased quantification. Polyadenylation is the addition of a poly(A) tail to a messenger RNA. The poly(A) tail is a stretch of RNA that has only adenine bases. In eukaryotes, polyadenylation is part of the process that produces mature messenger RNA (mRNA) for translation.
• When possible QuantPrime favors primers that span an exon-exon junction (an exon is a segment of a DNA or RNA molecule containing coding information for a protein or peptide sequence), especially when the junction occurs at the 30-end of the primer, to
decrease the probability of extendable annealing to genomic DNA.
• Before the specificity testing algorithm, QuantPrime pre-filters obvious unspecific primer pairs. This is achieved by finding transcripts that are similar to the target transcript using BLAST and filtering out the primer pair candidates annealing perfectly to those sequences. A transcript is a single-stranded ribonucleic acid (RNA) product synthesized by transcription of DNA.
Specificity testing algorithm
22 Chapter2. Background
Figure 2.16: Work flow overview of the primer pair design algorithm.[3]
Primer pairs should be as specific as possible to the target sequence. This is approximated by checking if a single primer in the pair has a significant identity (default is 75%) to another cDNA sequence (complementary DNA (cDNA) is DNA synthesized from a single-stranded RNA template in a reaction catalyzed by the enzyme reverse transcriptase. cDNA is often used to clone eukaryotic genes in prokaryotes), and whether the last 30-base is identical.
2.5.4
PRIMEGENS
2.5. Leading programs for primer design 23
Figure 2.17: Work flow overview of the primer pair specificity testing algorithm.[3]
Algorithm
24 Chapter2. Background
Chapter 3
A new algorithm for primer design
In this chapter, we present a new algorithm for primer design, our program is called bestPrimer. Before we discuss the algorithm it is essential to discuss the concept of multiple spaced seeds, which is central to our program.
3.1
Multiple spaced seeds
A homology search algorithm using a (non-consecutive) spaced seed was presented by Pattern-Hunter [28], to find similarities between sequences. This approach is far more sensitive than BLAST. PatternHunter uses a spaced seed, 111∗1∗ ∗1∗1∗ ∗11∗111; where a ’1’ denotes a match and 0∗0
represnt a don’t care position. BLAST’s consecutive seeds, 11111111111 is a special case that contains only matches. It only checks the positions corresponding to 1’s, while ignoring the positions corresponding to ∗0. The weight of a seed refers to the number of 1’s, while the total number of 1’s and ’s is the length of a seed. The probability of a hit depends on the weight of a seed. Therefore, the expected number of hits between a spaced and a non-spaced seed of same weight are same. The higher sensitivity of spaced matches is due to less overlapping between hits. In other words, with the shifting of a seed, spaced seeds need more matches to detect another hit. Thus, contiguous seeds suffer from hit clustering and spaced seeds can detect more similarities. Sensitivity of a seed is defined as the probability to detect a similarity. Fig.3.1 shows a comparison between spaced and non-spaced seeds.
A set of several spaced seeds can be used together for homology searching which can dramatically increase the sensitivity. SpEED [29] was used to design optimal multiple spaced seeds employed by bestPrimer to ensure high sensitivity .
3.2
Problems with existing design
As discussed in the previous chapter several researchers have conducted significant research on the problem of primer design. Primer3 is the most common tool for designing primers for PCR and several other programs depend on Primer3 to suggest primer pair candidates before speci-ficity checking. However, they only succeed partially in addressing the most important and challenging problem of primer design , i.e. hybridization with non-targets. DNA hybridization
26 Chapter3. Anew algorithm for primer design
Figure 3.1: Comparison between consecutive and spaced seeds. The red 1’s show the extra matches required for another hit.
takes place between complementary sequences. The complementarity does not have to be per-fect for strong hybridization to take place. Since it is absolutely necessary for primers to bind only to their targets for PCR amplification to be successful, their complementary sequences must be very different from any non-targets.
First, some of these programs do not detect the potential non-targets at all, others use BLAST to find similarities between primers and non-targets. BLAST, however has limitations in finding similarities. BLAST (weight 7) finds only 52.39% of the similarities of length 20 and identity 75%. Its sensitivity is shown as the blue line in the Fig.3.2
The second problem is that the current programs do not find the highest possible number of good primers. These algorithms stop the search after they find some primers that are considered to be good and they may miss some potential unique primers. Third, the methods used in evaluating the primers suffer from the same problem of not being sensitive enough to look for similarities. For example, Primer-BLAST uses a word size of 7 by default to evaluate the primers for specificity, it will miss any regions that have 6 or fewer consecutive matches to a primer. The sensitivity can be increased by decreasing the weight of the BLAST seed, but it will lead to running much slower.
Fig.3.1 illustrates the sensitivity comparison of BLAST seed and multiple spaced seeds computed by SpEED [6] for designing primers of length 20. Primer-BLAST uses the BLAST weight 7 seed, whereas the standard BLAST uses weight 11 seed. In the next chapter, we propose a new algorithm that uses multiple spaced seeds computed by SpEED which is more sensitive in finding similarities. We employ the weight 8 multiple spaced seeds to design our primers and a more sensitive weight 6 multiple spaced seeds to evaluate the primers. More details on multiple spaced seeds in the next section.
3.3
The bestPrimer algorithm
3.3. The bestPrimer algorithm 27
Figure 3.2: Comparing sensitivity of spaced seed and BLAST seed.
The green line shows weight 6 multiple spaced seeds; the red line shows weight 8 multiple spaced seeds; the blue line shows weight 7 BLAST seed; the pink line shows the standard
BLAST seed of weight 11.
line parameters. bestPrimer also has the option to design overlapping primers, i.e., the program will return all the forward and reverse primers possible on the forward and reverse strand.
To ensure spacing (default=500 bp), bestPrimer considers every position of a short inter-val (default=40 bp) in every 500 bp of the template as a potential primer candidate. At every next step candidate positions are eliminated when they do not satisfy several criteria for a good primer. Once a position is marked as non-candidate, the remaining steps will not consider it. The main steps of bestPrimer program are listed below:
• Encoding the input sequence
• Fast elimination of highly similar regions
• GC content calculation and selection
• Melting temperature calculation and selection
• Intensive elimination by homology search
28 Chapter3. Anew algorithm for primer design
3.3.1
DNA encoding
bestPrimer encodes the input template sequence into binary code, using two bits for each nu-cleotide (see Table 3.1). After binary encoding the input sequence is stored in a vector of 64-bit unsigned integers, which means each value of the vector contains 32-mers. By k-mer we shall mean a substring of length K.
Table 3.1: Encoding of input sequence Nucleotide base Binary encoding
A 00
T 11
G 10
C 01
This approach has three main advantages. First, data encoding enables the use of bit-wise operations. Second, we can compare chunks of the template sequence .i.e., 32-mers at a time instead of one nucleotide at a time. Third, it saves three quarter of the memory usage. Encoding each nucleotide requires only two bits, whereas in regular storage, each nucleotide base needs one byte due to character data stype. This helps managing large template sequences.
3.3.2
GC content
To evaluate the GC content of each potential primer candidate, bestPrimer algorithm considers the maximum and minimum range of GC content specified by the user. By default, maximum GC content is set to 80 and the minimum GC content is set to 20, however they can be easily changed through command line argument. Those primer candidates whose GC content lies outside the acceptable predefined range are eliminated (Fig. 3.3). Always the start position of the primer candidate is marked as non-candidate.
3.3.3
Melting temperature
Melting temperature Tm, is a very important factor to design good primers for PCR amplifica-tion. The melting temperature of all the primers needs to be close to the optimal Tm (default= 59C) . The nearest neighbor thermodynamic model is the most accurate approach to calculate melting temperature. The thermodynamic parameters and formula suggested by SantaLucia [11] for melting temperature calculation is employed by bestPrimer.
Using default salt and DNA concentrations we have:
T m=deltaH/(deltaS +R×ln(C/4) ) (3.1)
where R is the gas constant (1.987 cal/K mol) and C is the DNA concentration. The salt correction formula is also suggested in the paper [11]:
deltaS = deltaS +( 0.368×N×ln(NA+) ) (3.2)
3.3. The bestPrimer algorithm 29
Figure 3.3: GC content evaluation.
The melting temperatures of all candidate primers are computed and the ones falling out-side the defined range are conout-sidered as non-candidates. The default range of melting tem-perature is set to 57-62 degree Celsius but can be changed by the user. Enthalpy or deltaH (k.cal/mol) denotes the total energy exchange between the system and its surrounding environ-ment and Entropy or deltaS (cal/mol.K) is the energy spent to achieve self-organization by the system. The values of deltaH and deltaS are denoted in the Table 3.2.
3.3.4
Similarity search
The similarity search involves finding and investigating all hits corresponding to multiple spaced seeds. This can be a time consuming task and in order to speed up the process, the similarity search is conducted in two phases. In the first phase, a fast homology search is con-ducted where large regions of high similarities are eliminated. In the next phase, an intensive search is performed using the full potential of all seeds.
bestPrimer employs the set of eight spaced seeds of weight 8 shown in Fig.3.4 These seeds were computed using SpEED [29].
Hash table construction
30 Chapter3. Anew algorithm for primer design
Table 3.2: Nearest-Neighbor parameters for DNA/DNA duplexes. (SantaLucia [11]) Stack (5030/3050) deltaH (kcal/mol) deltaS (cal/mol.k)
AA/TT -7.9 -22.2
AT/TA -7.2 -20.4
TA/AT -7.2 -21.3
CA/GT -8.5 -22.7
GT/CA -8.4 -22.4
CT/GA -7.8 -21.0
GA/CT -8.2 -22.2
CG/GC -10.6 -27.2
GC/CG -9.8 -24.4
GG/CC -8.0 -19.9
Init. w/term. G/C 0.1 -2.8
Init. w/term. 2.3 4.1
A/T Symmetry correction 0 -1.4
Figure 3.4: Multiple spaced seeds used in the homology search phase.
the don’t care positions are replaced with 0’s. However, since the nucleotides are encoded in binary, s-mers consist of sequences of bits and the seed is also encoded, where 1 is 11 and ∗
3.3. The bestPrimer algorithm 31
Initial similarity search
In the fast elimination phase, bestPrimer quickly looks for unsatisfactory primer candidate positions and eliminates them due to high similarity elsewhere inthe in put template.
At each position in the template sequence, the algorithm computes the corresponding integer value of the position according to the seed model. Finding a hit is equivalent to finding the same integer value in the hash table. After computing the integer value for a position in the algorithm searches for the integer value in the hash table and inserts the hash value and the related position into the hash table if the hash value does not exist in the table. If the integer value is found in the hash table, which indicates a hit, the algorithm extends the positions related to the hit from both left and right up to the specified primer length and checks for maximum similarity threshold allowed. Both positions will be eliminated and considered as non-candidates if the similarity level of two extended regions is more than the predefined threshold and this process will be continued by sliding the extended regions one position to the left or right till the threshold condition is satisfied. This process is repeated for each spaced seed.
Thorough similarity search
In the intensive similarity search phase, bestPrimer calculates the s-mer integer value for each position and inserts this value as the hash key and its corresponding position into the hash table. If the hash key already exists in the hash table only the position is stored for that hash key.
Once all the hash tables are constructed, the algorithm checks the specificity of every valid candidate position in each interval against all other positions in the hash table. For each valid position, all hits of all s-mers corresponding to all eight seeds are investigated. bestPrimer eliminates all those positions which have higher similarity than the user specified threshold.
The difference between the fast and intensive phases is that for the fast phase we keep only one position for each hash key that is the last seen position of a hit in screening from right to left, while in the intensive phase we keep all positions and their corresponding hash values in the hash table.
3.3.5
Secondary structures
Secondary structure assessment can be performed in two ways; the first way is self-complementary (self-annealing) checking by aligning the oligonucleotide with its reverse-complement sequence; the other one is thermodynamic calculations to determine the stability of potential secondary structures (Fig.3.5 ). bestPrimer uses the first approach to assess secondary structures because the goal is to find if the primers have propensity to form any secondary structures and to find the best secondary structures.
32 Chapter3. Anew algorithm for primer design
Figure 3.5: Examples of secondary structures. [30]
loop. Also, all primer candidates are checked for the ability to form self-dimers which is per-formed by checking the number of base-pairing nucleotide bases within a specific window size. All such candidate positions are eliminated and marked non-candidate which can form stable secondary structures.
3.3.6
Best primer selection
In the thorough similarity search phase, every valid candidate position is scanned for specificity against all positions in the hash tables. Those candidate positions whose similarity is found to be higher than the predefined threshold are eliminated and marked as non-candidate and those whose similarity is less than the threshold are stored in a map. The start position of the primers acts as the key and their corresponding similarities with their closest non-target as the value. The minimum value of those similarities is found and all other candidate positions with the same value are retrieved. In the last step, the candidate position with the melting temperature closest to the optimal melting temperature is returned.
3.4. 30 end mismatches 33
to the optimal melting temperature in every interval. This gives an uniformity in the melting temperatures of all the primers in every interval.
3.4
3
0end mismatches
As discussed earlier, it has been established that mismatches towards the 30affect target ampli-fication much more than mismatches towards the 50end [2]. It has been observed that at least a two-base mismatch at the 30 end generally prevents amplification of non-targets. A single base
mismatch at the 30 end as well as a few mismatches in the middle or towards the 50end allows amplification of target but at low efficiency.
Chapter 4
Evaluation
In this chapter we compare the primers designed by bestPrimer with the primers designed by the leading current software Primer3 [1].
4.1
Operation environment
bestPrimer is implemented in C++, and parallelized using openMP. All jobs are performed on the SHARCNET (Shared Hierarchical Academic Research Computing Network) which is a high performance computing consortium. bestPrimer is run in parallel (32 cores), Primer3 can run only in serial mode. The most time consuming tasks are done in parallel .i.e, using multiple processors. It is important to notice that the order in which the genes are considered is irrelevant; this helps parallelizing the process. The hash tables for all seeds are computed in parallel for all seeds in each set. The thorough simmilarity search for each interval and picking the best primer in each interval is also done in parallel. We used some nodes of the ”shadowfax” cluster whose characteristics are given below:
• Processor: 32 cores
• RAM: 1024.0 GB
• Operating System: CentOS 6.3
• Compiler: GCC version 5.1.0
4.2
Data sets
We use the following data sets as the input template sequence to design primers. The FASTA file of Mus musculus chromosome 17, https://www.ncbi.nlm.nih.gov/nuccore/NC 000083.6. Total length: 8 million bp (maximum template length that can be handled by Primer3), 32000002 - 40000002 bp randomly selected.
And,Mus musculus chromosome 6, https://www.ncbi.nlm.nih.gov/nuccore/NC 000072.6. Total length: 7905514 bp, 48255367- 56160880 bp (includes the HOXA6 cluster).
4.3. Evaluation 35
4.3
Evaluation
The evaluation algorithm is very similar with the one for designing primers. The difference comes from the more sensitive seed used.
bestPrimer employs the multiple spaced seed of weight 6 (Fig.4.1) designed by SpEED [29] to evaluate existing primers to compute their closest non-target similarity. For a given primer, a non-target is any region different from the intended target. The closest non-target is a non-target that has the highest similarity with the (reverse complement of the) primer sequence. It is the position where the primer is most likely to wrongly bind. The evaluation algorithm also outputs other primer properties such as GC content, melting temperature, sequence position and the position of closest non-target.
Figure 4.1: Multiple spaced seeds used in the evaluation algorithm.
4.4
Comparison
We have set the bestPrimer parameters to match as closely as possible to the default ones for Primer3. We evaluate several characteristics of the primers:
- GC content
- Melting temperature
- Closest non-target identity
- Distance between consecutive primers
36 Chapter4. Evaluation
The only difference between different runs of bestPrimer is the maximum similarity allowed with a non-target: 75%, 80%, ..., 100%, where 100% means there are no restrictions. Each next higher level adds some primer on top of those found by the previous one (see also Fig.4.8), so it suffices to look at bestPrimer-100%. The other ones simply run faster (see second last column of Table.4.1).
We notice from Table.4.1 and Table.4.2 is that bestPrimer produces more primers (in the 100% mode) and runs faster; recall that Primer3 runs in serial mode only.
Table 4.1: Comparison of bestPrimer Vs Primer3 on theMus musculus chromosome 17 data set. Software GC range (%) Tm range (C) Tm optimal (C) Length (bp) Max similarity (%) Forward primers Reverse primers Time* (sec) Peak memory (MB) bestPrimer 40..60 57..62 59 20 75 1710 1714 41 2900 bestPrimer 40..60 57..62 59 20 80 6583 6681 61 2900 bestPrimer 40..60 57..62 59 20 85 7776 7828 77 2900 bestPrimer 40..60 57..62 59 20 90 8737 8803 84 2900 bestPrimer 40..60 57..62 59 20 95 9949 10009 92 2900 bestPrimer 40..60 57..62 59 20 100 11471 11540 126 2900 Primer3 30..70 57..62 59 20 NA 11181 11184 266 324.9
∗bestPrimer is run in parallel (32 cores), Primer3 is run in serial.
Table 4.2: Comparison of bestPrimer Vs Primer3 on theMus musculus chromosome 6data set.
Software GC range (%) Tm range (C) Tm optimal (C) Length (bp) Max similarity (%) Forward primers Reverse primers Time* (sec) Peak memory (MB) bestPrimer 40..60 57..62 59 20 100 12389 12558 174 3000
Primer3 30..70 57..62 59 20 NA 11885 12030 303 317
∗bestPrimer is run in parallel (32 cores), Primer3 is run in serial.
4.4.1
GC content evaluation
Fig.4.2 and Fig.4.3 shows the distribution of GC content, as we can see there is no significant difference between the two programs. The GC range is set to 40..60 for bestPrimer as Primer3 outputs primers in this range.
4.4.2
Melting temperature evaluation
As shown in Fig.4.4 and Fig.4.5, the melting temperature distribution is narrower for best-Primer and closer to the optimal 59 C. A narrower melting temperature interval is better since the primers should ideally bind at the same time.
4.4.3
Closest non-target similarity
4.4. Comparison 37
Figure 4.2: GC content distribution for theMus musculus chromosome 17data set .
with the primer. It is the most dangerous position for the primer, therefore a lower similar-ity with the sequence at this position is highly desired. As seen from Figure 4.6, bestPrimer primers have a significantly lower similarity with their closest non-targets. So to speak, they are “more unique” than those designed by Primer3.
The same information is presented differently in Fig.4.8 and Fig.4.9, where the number of primers at each similarity level with the closest non-targets is plotted. The curve for bestPrimer at a given similarity level is a continuation of the same curve at the previous level. The one for 100% is therefore representative for all previous curves. Comparing bestPrimer-100% with Primer3, we note that bestPrimer produces more primers at lower levels (less similar with the closest non-targets) and fewer at higher levels (Table.4.3 and Table.4.4 ).
4.4.4
Distance between consecutive primers
38 Chapter4. Evaluation
Figure 4.3: GC content distribution for theMus musculus chromosome 6data set .
4.4.5
Primer-dimer propensity
Primer cross dimers are formed by inter-molecular interactions between sense and anti-sense primers, where they are homologous. Optimally a 3’ end cross dimer with a deltaG of -5 kcal/mol and an internal cross dimer with a deltaG of -6 kcal/mol is tolerated generally. For primer-dimer comparison we have used AutoDimer [31] and the results are shown in Fig. 4.12, Fig.4.13, Fig.4.14 and Fig.4.15. AutoDimer tool is used to screen 1000 random sequences (primers) for primer-dimer propensity. The two algorithms perform similarly.
A score value is determined by combining the number of Watson-Crick base pairs (+1) with the mismatches (-1). The score given for each interaction is a very basic criterion used to judge the degree of complementarity. The score reflects the general stability or tendency of the potential interaction to exist in solution. Optimally it has been observed that a score threshold of 7 nor 8 works well when designing multiplex PCR primers (Fig.4.14 and Fig.4.15).
4.4. Comparison 39
Figure 4.4: Melting temperature distribution for theMus musculus chromosome 17 data set .
40 Chapter4. Evaluation
Figure 4.5: Melting temperature distribution for theMus musculus chromosome 6 data set .
Table 4.3: Number of primers with different non-target similarities for theMus musculus chro-mosome 17data set.
Non-target similarity bestPrimer-100% Primer3
75% 311 561
80% 4579 7118
85% 3155 5065
90% 1658 2342
95% 1843 2623
4.4. Comparison 41
Figure 4.6: Closest non-target similarity distribution for the Mus musculus chromosome 17 data set .
Table 4.4: Number of primers with different non-target similarities for theMus musculus chro-mosome 6data set.
Non-target similarity bestPrimer-100% Primer3
75% 2410 562
80% 14923 11470
85% 4598 7785
90% 1057 1692
95% 853 996
42 Chapter4. Evaluation
4.4. Comparison 43
44 Chapter4. Evaluation
4.4. Comparison 45
46 Chapter4. Evaluation
4.4. Comparison 47
48 Chapter4. Evaluation
4.4. Comparison 49
50 Chapter4. Evaluation
Chapter 5
Conclusion
In this thesis, we have considered the problem of designing primers for PCR. The results of Primer3 are far from satisfactory since some of the produced primers have high similarity with non-targets. Also, the highest number of primers are not found. The previous methods of evaluation suffer from the same problem of not being sensitive enough in finding similarities.
After discussing the shortcomings of the existing programs, we introduce a new one, best-Primer, that produces significantly better primers. Through our evaluation program, we have performed a comprehensive analysis and comparison between Primer3 and bestPrimer. best-Primer produces more specific or unique primers with a narrower melting temperature range that enables efficient PCR binding. The “best” part of the name requires a brief explanation: bestPrimer is the best possible at finding the closest non-target for each designed primer, that is, the most likely place for the primer to wrongly bind.
In addition, bestPrimer produce higher number of primers with decreasing distance be-tween them which provides better coverage of the template sequence. bestPrimer run in paral-lel mode which decreases the running time to a great extent. All parameters can be customized by the user through command line input.
Bibliography
[1] Andreas Untergasser, Ioana Cutcutache, Triinu Koressaar, Jian Ye, Brant C Faircloth, Maido Remm, and Steven G Rozen. Primer3—new capabilities and interfaces. Nucleic acids research, 40(15):e115–e115, 2012.
[2] Jian Ye, George Coulouris, Irena Zaretskaya, Ioana Cutcutache, Steve Rozen, and Thomas L Madden. Primer-blast: a tool to design target-specific primers for polymerase chain reaction. BMC bioinformatics, 13(1):134, 2012.
[3] Samuel Arvidsson, Miroslaw Kwasniewski, Diego Mauricio Ria˜no-Pach´on, and Bernd Mueller-Roeber. Quantprime–a flexible tool for reliable high-throughput primer design for quantitative pcr. BMC bioinformatics, 9(1):465, 2008.
[4] Dong Xu, Guangshan Li, Liyou Wu, Jizhong Zhou, and Ying Xu. Primegens: robust and efficient design of gene-specific probes for microarray analysis. Bioinformatics, 18(11):1432–1437, 2002.
[5] Saul B Needleman and Christian D Wunsch. A general method applicable to the search for similarities in the amino acid sequence of two proteins.Journal of molecular biology, 48(3):443–453, 1970.
[6] Lucian Ilie and Silvana Ilie. Multiple spaced seeds for homology search. Bioinformatics, 23(22):2969–2977, 2007.
[7] E. A. Martin. A dictionary of biology. Oxford University Press, Oxford New York, 2008.
[8] Bruce Alberts, Dennis Bray, Alexander Johnson, Julian Lewis, Martin Raff, Keith Roberts, Peter Walter, and David S Latchman. Essential cell biology: An introduction to the molecular biology of the cell. Trends in Biochemical Sciences, 23(7):268–268, 1998.
[9] Richard R Sinden. DNA structure and function. Elsevier, 2012.
[10] Aysha Divan and Janice Royds. Tools and techniques in biomolecular science. Oxford University Press, 2013.
[11] John SantaLucia. A unified view of polymer, dumbbell, and oligonucleotide dna nearest-neighbor thermodynamics. Proceedings of the National Academy of Sciences, 95(4):1460–1465, 1998.