Article
1
A Reliability-Centered Maintenance study for an
2
Individual Section Forming Machine
3
Samuel Okwuobi 1, Felix Ishola 2 and Oluseyi Ajayi 2, *
4
1 Mechanical Engineering Department, University of Lagos, Lagos, Nigeria; [email protected]
5
2 Mechanical Engineering Department, Covenant University, Ota, Nigeria;
6
7
* Correspondence: [email protected]; Tel.: +2348060615184
8
9
Abstract: This study investigated the breakdown trend in an automated production with an aim to
10
recommend the application of Reliability-centered maintenance (RCM) for an improved
11
productivity via a new preventive maintenance (PM) program. Individual Section-forming machine
12
(ISM): a glass blowing machine for making glass bottles was used as the case study of an automated
13
production system. The machine parts and the working mechanisms were analysed with a special
14
focus on methods of processes and procedures that will enable the ISM maintenance department
15
run more effective and achieve its essential goal of ensuring effective machine operation and
16
reducing machine downtime. In this work, information is provided on the steps and procedures to
17
identify critical components of the ISM using Failure Modes and Effect Analysis (FMEA) as a tool
18
to develop an optimal maintenance program based on the reliability data of the equipment’s
19
functional components. A relationship was established between the failure rate of the machine
20
components and the maintenance costs such that using the recommended PM program, an evidence
21
of improvement in the machine’s availability, safety and cost-effectiveness will result into an
22
increase in the company’s profit margin.
23
Keywords: Reliability Centered Maintenance (RCM), Individual Sectioned forming Machine,
24
FMEA, Risk Analysis
25
26
1. Introduction
27
The high level of competition among the industries and businesses has made the survival battle
28
to be tremendously strong. All over the world, development times are becoming shorter, cost
29
concerns more severe, and customers are demanding absolute safety and high reliability of products.
30
This quest also includes the employees who always desire a safe environment to perform their task.
31
While it may have been sufficient in the past to focus on testing and analysis as the primary methods
32
for ensuring high reliability, this is no longer obtainable. The focus is on anticipating the factors that
33
lead to failure and ensure that such factor is prevented from occurring frequently using a robust
34
design. To reach this goal, decrease in the costs of operations are set on the high priority [1]. The
35
study of reliability and maintainability in any manufacturing outfit plays a crucial role in ensuring
36
the smooth running of production processes because it could be useful in ensuring production
37
continuity as well as product quality assurance [2].
38
Nowadays there is much emphasis on safety, reliability and availability in the production plants.
39
In an attempt to beef up performance an increasing number of industries replaces the reactive
40
maintenance strategies with proactive strategies like predictive and preventive maintenance (PPM)
41
as well as aggressive strategies such as Total Productive Maintenance (TPM) [3]. Maintenance has
42
been referred to as a single largest controllable cost which can be used to improve productivity
43
through attempts on different maintenance policies [4].
44
Lately, the decision-making tool that has been widely implemented is Reliability Centered
45
Maintenance (RCM). RCM is used to determine what failure management strategy(ies) can best be
46
deployed to ensure that a system achieves a desired level(s) of operational reliability, safety and
47
readiness and then environmental safety in the most economical manner [5]. RCM is a systematic
48
consideration of system functions, failure analysis and a priority-based consideration of both safety
49
and cost-effectiveness. It is a process used to determine what must be done to ensure that any physical
50
asset continues to fulfill its intended functions in its present operating context. [6]. Over these 30
51
years of initiating RCM it has been tested and confirmed to be an effective preventive maintenance
52
(PM) optimization strategy, a method that has enjoyed increasing popularity in a wide range of
53
different industrial set ups [7]. PM’s objective is usually to crash the probability of having a
non-54
scheduled maintenance, which typically comes high costs. Bolu C.A (2013) established the
55
relationship between the measurement of maintenance performance and productivity as the major
56
determinants of maintenance costs by adopting the following equations:
57
= Total Maintenance Cost
58
and
59
=Total Maintenance Cost
60
therefore
61
=
62
Given
63
=
64
Implying that the overall objective of the maintenance function is to support the production
65
department by keeping facilities in proper running condition at the lowest possible cost [8]. Like for
66
many other machines, RCM has been a successful PM strategy, this time it is being tailored for use in
67
an ISM to aid the design of a planned component replacement (PCR) schedule [9]. The aim of this
68
research is to examine the present maintenance culture of an ISM in a glass bottle moulding industry
69
and to establish an RCM plan on this machine. From this, the PM intervals that give the best
70
performance values was identified for an optimum maintenance plan and reduction in service period
71
and frequency.
72
73
1.1. Brief Description of Individual Section Machine (ISM)
74
The Individual Section machine (ISM) is an automatic machine used in producing hollow glass
75
containers having narrow or wide necks. The machine is designed to be extremely flexible, hence it
76
is very efficient for the production of a very large range of containers depending on the mould
77
installed. system. A furnace is usually an integral part of an ISM which heats up the temperature to
78
over 1400°C to melt the glass. The molten glass passes through a foreheart to the feeder where it is
79
being cut into uniform gobs of glass i.e the liquid glass drops by a thermal shearing and distribution
80
system. After this, the gobs are being sent to an ISM where the temperature goes down below 1200°C,
81
and the gobs are injected into the molds. The ISM molds are in two sets - “the blank” and “the blow”
82
[10]. The forming section is pneumatically driven, whereas the Feeder mechanism, the gobs
83
distributor and the pushers can be controlled by servo control or stepping motors. A
solenoid-84
pneumatic valve block controlled by an electronic timer controls the mechanisms in all sections
85
automatically [11]. Owing to the servo-controlled gob distributor, the number of machine sections to
be used and the feeding sequence can be programmed without operating the mechanism:
87
programming through the machine terminal is the only operation needed. The electronic pushers
88
transfer the items from the cooling plate to the conveyor accurately, thus improving item alignment
89
on the conveyor; time needed for job changes is therefore reduced as the pushers can be completely
90
programmed. There is no need to stop the machine to adjust all operations [12]. Independent sections
91
can be available so that adjustment and repair operations, as well as the replacement of moulds in
92
each individual section, can be performed without stopping the other sections. The ISM is a critical
93
success factor in glass bottle production and it is more rewarding if kept at the optimum in-service
94
condition.
95
96
Figure 1: Typical individual section forming machine (ISM). [12]
97
1.2 Overview and review of RCM related work
98
Like many other maintenance planning tools, RCM is to preserve an item’s functionality. RCM
99
seeks to curtail the criticality of failure as all failures can never be eradicated. The first priority of
100
RCM is safety in cases where safety is not jeopardised, the priority becomes maintenance; justified
101
by the ability to complete the mission of availability and reliability and then the final priority is based
102
on cost-effectiveness [13]. These cumulating into making use of RCM for the design of the system;
103
system’s operation modes; the maintenance methods and practices; logistics and costs data (analysis)
104
to improve operating capability of such system(s). RCM should be a continuous process that requires
105
sustainment knowing fully well that at any system’s best, maintenance can only sustain a system to
106
its inherent reliability and availability level within the operating context [14]. The
condition-107
monitoring system (CMS) is an integral component of RCM in order to increase productivity and
108
reliability of machines as shown in the figure 2 below (Item 3). The conditions leading to a failure
109
mode must have been or be investigated using sensors like Accelerometers, Encoders, Current/torque
110
sensors, Pressure sensors as well as temperature sensors [15].
112
Figure 2: An overview of the items of RCM process in sequence [16]
113
From the past researches it is evident that RCM have been used as a tool to sort out of failure
114
problems ranging from field of medicine to military to building related technologies to Automotive
115
to Aviation and of course Industrial and productions to mention few, however, a lot of applied areas
116
are yet to be investigated or reported. Wang et al (2000) carried out an RCM Analysis of Process
117
Equipment using Heat exchangers as a case study. Results indicated that RCM could assist in
118
identifying the functional failures, causes of failures and risk ranking which are linked to corrosion
119
rates and remaining life of the heat exchangers. Afefy (2010) investigated the application of RCM
120
methodology to the development of a maintenance plan for a steam-process plant. The proposed
121
RCM spiced PM planning indicated that the system will enjoy about 25.8% decrease of the total
122
labour cost, 80% reduction of the total downtime cost and also about 22.17% decrease in the annual
123
spare parts cost for a year of the proposed RCM-PM planning application. Ramli & Arffin (2012)
124
carried out research on RCM in Schedule Improvement of Automotive Assembly Industry. The
125
number of the checklist in the body shop was reduced and this resulted in a significant reduction of
126
operator’s workload and avoided maintenance personnel from committing fraud. It was confirmed
127
that the implementation of RCM gave great success and the same methodology can be applied to the
128
whole equipment in the other shops [17], [18], [19].
129
Tarar (2014) carry out a study on Reliability Centered Maintenance (RCM) of Rotating
130
Equipment through Predictive Maintenance. This paper evaluated the effectiveness of existing
131
maintenance strategy with improvement proposals. It showed RCM process and a case study of paint
132
booth fans process. The paper revealed that the successful RCM implementation in any industry can
133
ensure better performance to take competitive advantage in the global market. Recently, Emovon Et
134
al (2017) carried out a review on the development of more effective RCM tools for maintenance
135
practices in plant systems for an increased safety and efficiency. The authors expressed concern about
136
the use of the risk priority number (RPN) as they established the fact that it does not address certain
137
important factors such as economic cost and environmental impact in the risk analysis. Consequently,
138
Emovon and Okwu (2018) integrated Weighted Aggregated Product Assessment (WASPAS) into
139
•The desired performance standards of of the system, how well it performs, and under what circumstances
1. Functions
•The various states that the system and equipment fail to meet expectations; this includes both partial and total failures.
2. Functional Failures
•Monitoring conditions causing a functional failure. A failure on similar equipment can be projected to likely same trigger events in another.
3. Failure Modes
•Description of what happens when each failure mode occurs, detailed enough to correctly evaluate the consequences of each
4. Failure Effects
•The effect; for any deflection from expected function on the safety, environmental, mission, or economics of the system
5. Failure Consequences
•Applicable, effective and economical plans, to predict, prevent or mitigate failures.
6. Maintenance Policies
•Including, but not limited to, run-to-failure, engineering redesigns, and changes/additions to operating procedures or technical manuals
RCM as an alternative for prioritizing using RPN. The technique improves the effectiveness of RCM
140
as well as in selection of an optimal maintenance strategy for ship facilities. Further to the previous
141
researches that have been carried out, this research seeks to implement the RCM for Individual
142
section machine (ISM) which is used in glass bottle Production Company. However, RPN is
143
considered the best for the form of data collected for this study as some of the alternatives that have
144
been used are found to require a maintenance data collection pattern a little different from the
145
conventional [20], [21].
146
2. Materials and Methods
147
2.1 Components of Individual Section Machine (ISM)
148
The Individual Section machine is composed of even-numbered sections. Besides operating as a
149
single machine, two machines can be connected in line. Furthermore, the number of working sections
150
can be changed when the kiln delivery capacity is of fundamental importance. To produce special
151
items, auxiliary mechanisms and equipment are available to be used on the machine such as the
152
Single, Double, Triple, Quadruple Gob, Blow-blow, Press-Blow, Narrow Neck Press-Blow processes,
153
vacuum mould and blow mould support, as well as special equipment for the different production
154
processes. A more flexible production system is at present available owing to the Servo-Feeder, Gob
155
Servo-Distributor, Servo-Pusher and the electric shaft system for flexible lines.
156
157
2.2 Mechanism Selection Process
158
The criteria for the selection of the components are as follows;
159
The frequency of downtime/failure of a component.
160
Type of components as to whether it is a mechanism or a variable.
161
Criticality of component failure.
162
Availability of technical description and maintenance guidelines for component.
163
Information gathered from a questionnaire on the reliability of components.
164
165
2.3 Questionnaire Design for Individual Section Machine Maintenance Staff
166
In the course of the research, questionnaires were administered to all maintenance staff, key
167
production crews and forehearth staff of Beta glass Plc. The Company is located at Ogun State in
168
Nigeria. They are specialized in the production of glass containers particularly bottles. The aim of the
169
questionnaires was to investigate the machine functionality, capability and reliability and also the
170
distribution of roles in the maintenance department.
171
172
2.4 Failure Risk Analysis.
173
For each of the identified components of all parts of the ISM, the risk analysis of experiencing any
174
form of failure was conducted based on the available data, using Failure Modes and Effect Analysis
175
(FMEA) and also, a downtime analysis of the components across the period was considered.
176
Step 1: Review the process or product.
177
Step 2: Brainstorm potential failure modes.
178
Step 3: List potential effects of each failure mode.
179
Step 4: Assign a severity ranking for each effect.
180
Step 5: Assign an occurrence ranking for each failure mode.
Step 6: Assign a detection ranking for each failure mode and/or effect.
182
Step 7: Calculate the Risk Priority Number for Each Failure Mode
183
The risk priority number (RPN) was simply calculated by multiplying the severity ranking times the
184
occurrence ranking times the detection ranking for each item.
185
Risk Priority Number = Severity × Occurrence × Detection ………(i)
186
The mechanism Input sources for FMEA is as follows:
187
Questionnaires completed by maintenance staff,
188
Downtime data showing details of failure which occurred,
189
Working drawings of components,
190
Maintenance instructions as provided by manufacturers,
191
Failure modes and effects analysis of standard mechanical components,
192
On field assembly and disassembly during repairs and diagnostics of fault.
193
194
2.5 Downtime Analysis
195
The downtime and the effective downtime for each quarter were collated for the following selected
196
critical mechanism using the data retrieved from previous maintenance reports.
197
Pusher cylinder
198
Plunger mechanism
199
Ware transfer
200
In calculating the effective downtime for each mechanism in each quarter the following formula was
201
used:
202
= ∙ ………. 1
203
Where: =
204
=
205
=
206
With the values of the downtime for each mechanism in each quarter collated the financial loss as a
207
result of downtime was obtained with the formula:
208
= ∙ ………2
209
Where: =
210
=
211
= ∙ ……….3
212
Where: =
213
=
214
=
215
Also, the cost of downtime is estimated by taking note of the production speed for each product as
216
shown in Table 1 below.
217
Table 1: Cost analysis of downtime
218
Product (Bottle) Machine speed(bpm)
Unit price (Naira)
Bottle speed(bpm)
Production speed price (₦/m)
A 53 46.83 106 4963.98
B 89 29 178 5162
C 86 36.8 172 6329.6
E 110 44.5 220 9790
F 130 44.5 260 11570
G 80 39.74 160 6358.4
H 126 39.74 252 10014.48
I 98 26.4 196 5174.4
J 112 19.05 224 4267.2
K 92 26.4 184 4857.6
L 43 44.56 86 3832.16
M 76 38.26 152 5815.52
N 122 12.36 244 3015.84
= ∙ ……….4
219
Where: =
220
There were two gob mates in the plant hence, the machine produces two bottles per unit delivery
221
time. During the analysis, all electrical and non-direct control related issues were not considered.
222
3. Results and Discussion
223
During the time of this project, FMEAs were developed and downtime analysis was done for the
224
following selected critical components:
225
Pusher cylinder
226
Plunger mechanism
227
Ware transfer
228
229
3.1 Discussion of Results for Pusher Cylinder
230
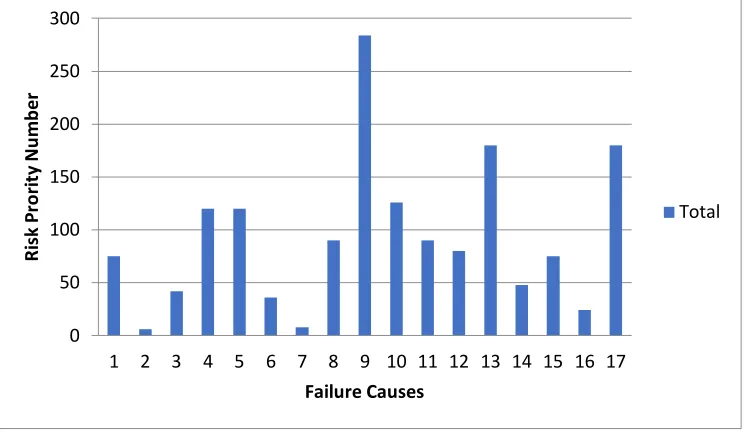
From the distribution in figure 3, assigned numbers (1-17) had the following causes ranked by RPN.
231
232
Figure 3: Distribution of failure causes to RPN for pusher Mechanism
233
234
0 50 100 150 200 250 300
1 2 3 4 5 6 7 8 9 10 11 12 13 14 15 16 17
R
is
k
P
ro
ri
ty
N
u
m
b
e
r
Failure Causes
235
Figure 4: Loss in the cost of product not produced across quarterly periods.
236
237
It is observed that the highest RPN of 284 was due to cause 9 which is lubrication and wears
238
out with potential failure mode of broken piston ring which causes internal leakage and
239
inappropriate/slow response of the pusher cylinder arm out and in, also it can be seen that
240
inappropriate tightening practice when it comes to bolted parts also account for majority of the failure
241
mode as seen in cases of over tightening in cause 13 and excessive vibration in cause 17, this has the
242
effect of bringing about work loosing of the assembled leading to inappropriate operation and also
243
external leakages. Lesser RPN was observed for causes such as bad control and wear of pusher fingers
244
due to high temperature and ash working environment these failures had very low occurrence rates
245
and were very detectable in cases in which they occurred.
246
3.1.1 Downtime and Cost Analysis
247
Since a good maintenance culture involves continuous improvement in the reduction of product loss
248
cost due to downtime a general improvement in the cost due to downtime was not observed across
249
the 15 quarters in fact the highest downtime cost loss was experienced recently in the fourth quarter
250
of 2013 with a total loss in cost of product not produced was calculated to be N14, 347,774.06
251
252
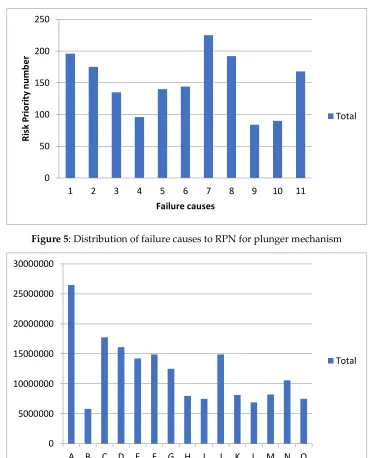
3.2 Discussion of Results for Plunger Mechanism
253
From the distribution in fig 4, assigned numbers (1-11) had the following causes ranked by risk. It is
254
observed that the highest RPN of 225 was due to cause which is the presence of Carbon residue in
255
upper cylinder with potential failure mode of the plunger being stuck during operation due to the
256
absence of clearance, also it can be seen that wear of the upper cylinder which is due to a failure mode
257
of air leakage in piston assembly had an RPN of 196 followed by an RPN of 192 due to
258
mismanagement of excessive working pressure which makes the plunger supply hose connector pull
259
off. A generally high- RPN was observed for all failure causes which shows the severity of occurrence
260
of such causes with causes due to gasket flat having the lowest RPN of 84 due to failure modes of air
261
leakage in inner mould during parison this is because pressure losses due to leakage can be
262
compensated for increasing the pressure and even in cases of incomplete parison blowing, the effect
263
is self-corrected during the final blowing process.
264
0 2000000 4000000 6000000 8000000 10000000 12000000 14000000 16000000
A B C D E F G H I J K L M N O
265
266
Figure 5: Distribution of failure causes to RPN for plunger mechanism
267
268
Figure 6: Loss in the cost of product not produced across quarterly periods for plunger mechanisms
269
270
3.2.1 Downtime /Cost Analysis:
271
Since a good maintenance culture involves continuous improvement in the reduction of product loss
272
cost due to downtime a generally there was improvement in the reduction of cost loss in downtime
273
due to product not produced and from Fig 6 it can be seen the first data representation i.e. third
274
quarter of 2010 had a downtime cost of N26,470,458.91 and generally the downtime cost due to
275
product not produced decreased relatively steadily with the final downtime cost in the first quarter
276
of 2014 being N7,504,222.40.
277
278
3.3 Discussion of Results for Ware transfer
279
From the distribution in fig 7, assigned numbers (1-13) had the following causes ranked by RPN.
280
0 50 100 150 200 250
1 2 3 4 5 6 7 8 9 10 11
R
is
k
P
ri
o
ri
ty
n
u
m
b
er
Failure causes
Total
0 5000000 10000000 15000000 20000000 25000000 30000000
A B C D E F G H I J K L M N O
281
Figure 7: Distribution of failure causes to RPN for ware Transfer
282
283
Figure 8: Loss in the cost of product not produced across quarterly periods for Ware Transfer
284
It is observed that the highest RPN of 360 was due to cause 13 which is excessive heat, contamination
285
with potential failure mode of worn out wear transfer fingers, also a temperature related cause of
286
high temperature due to excessive speed when there is deficiency in lubrication has a RPN of 336 and
287
a failure mode of the wear transfer main bearing seizing another area of risk of the component was
288
due to lubrication defects especially contaminants in the lubricant for the bevel gear lubrication sump
289
this has failure mode of abrasive wear of the bevel gears used in transmission of motion for the shaft
290
and has an RPN of 294.
291
Other lower cases of low- RPN is observed in the case of the loose bevel gear off on the shaft due to
292
a shear on the key; this is because the chances of this happening is highly unlikely and the failure
293
mode itself is very detection even in the early phase of installation and maintenance activity another
294
cause with low-risk priority of 105 is what is popularly known is cullet hook, this has a relatively
295
high occurrence rating of 7 but is very easily detected and quite easy to correct hence a low severity
296
rating number.
297
0 50 100 150 200 250 300 350 400
1 2 3 4 5 6 7 8 9 10 11 12 13
Total
0 5000000 10000000 15000000 20000000 25000000 30000000 35000000
A B C D E F G H I J K L M N O
3.3.1 Downtime /Cost Analysis:
298
Generally considering the broad spectrum of all the quarters considered using Fig. 8, most of the time
299
there is quite low loss of production loss due to wear transfer failure except for extreme cost loss of
300
over 30 million naira in the fourth quarter of 2012 and similar loss of N 22,737,045.94 in the third
301
quarter of 2012 despite this there has a relatively decreasing trend shown in the loss in cost due to
302
downtime since the first quarter of 2013 with the lowest loss in cost due to downtime occurring in
303
the first quarter of 2014 with a loss in cost due to downtime being N4,013,886.40
304
4. Conclusions and Recommendation
305
4.1 Suggestion for the Improved reliability of Pusher Assembly
306
Implementation of the selective run to failure, preventive maintenance and precision maintenance
307
respectively will lead to the lesser downtime cost and higher reliability of the pusher assembly.
308
Through careful analysis of all the components of the pusher assembly, it was observed that most of
309
the failure that occurs is due to random causes and over stress with the exception of all seals and
310
piston rings. Use of precision Maintenance requires that all bolts on the assembly should be locked
311
with equal and right torque as shown in the torque chart provided; also avoiding the reuse of bolts
312
will help reduce failure due to work loose and bolt breakage (shear); the use of adhesives in place of
313
bolts and nuts is recommended here. A redesigning of the pusher finger support is suggested on the
314
basis of material selection since its excessive expansion causes the pusher finger bolts to work loose
315
and misalign. The Oilers on all pusher assembly must be reinstalled and frequent cleaning of both
316
the Oilers and the cylinder shaft be carried to avoid accumulation of carbon and dirt which blocks
317
the oilers and makes the cylinder shaft stuck.
318
319
4.2 Failure Reporting and Analysis Recommendation
320
All recorded downtime on individual sections should not be divided by the total number of sections
321
on the particular machine. Dividing the downtime recorded by the number of section assumes that
322
the other sections due to the fact a particular section down compensates for the failed section by
323
producing more but since this is not so the KPI (key performance Indicator) of each machine line
324
should be calculated individually. There is the need for better failure reporting discipline to be
325
imbibed in the department, this, however, involves input from workshop floor for failure causes that
326
are not be determined on the machine this will help in filling more accurately the FMEA table and
327
carrying out a more detailed failure analysis.
328
References
329
[1] L. Swanson, “An empirical study of the relationship between production technology and
330
maintenance management,” Intern. J. Prod. Econ. Econ., vol. 53, pp. 191–207, 1997.
331
[2] A. U. Adoghe, C. O. A. Awosope, and S. A. Daramola, “Critical Review of Reliability Centred
332
Maintenance ( RCM ) for Asset Management in Electric Power Distribution System,” Int. J.
333
Eng. Technol., vol. 2, no. 6, pp. 1020–1026, 2012.
334
[3] G. Fredriksson and H. Larsson, “An analysis of maintenance strategies and development of a
335
model for strategy formulation – A case study,” Masters Thesis, 2012.
[4] P. Muchiri, L. Pintelon, L. Gelders, and H. Martin, “Development of maintenance function
337
performance measurement framework and indicators,” Intern. J. Prod. Econ., vol. 131, no. 1,
338
pp. 295–302, 2011.
339
[5] M. Suryono and C. N. Rosyidi, “Reliability Centred Maintenance (RCM) Analysis of Laser
340
Machine in Filling Lithos at PT X,” in Conf. Series: Materials Science and Engineering, 2018.
341
[6] G. Abdul-Nour, H. Beaudoin, P. Ouellet, R. Rocheti’e, and S. Lambert, “A RELIABILITY
342
BASED MAINTENANCE POLICY; A CASE STUDY,” Comput. ind. Engng by Elsevier, vol. 35,
343
no. 98, pp. 591–594, 1998.
344
[7] V. S. Deshpande and J. P. Modak, “Application of RCM for safety considerations in a steel
345
plant,” vol. 78, pp. 325–334, 2002.
346
[8] C. A. Bolu, “Modeling Maintenance Productivity Measurement of Engineering Production
347
Systems : Discrete Event Simulation Approach,” Int. J. Mech. Mechatronics Eng. IJMME, vol.
348
13, no. 05, 2013.
349
[9] M. Bozoudis and I. Lappas, “Use of Cost-Adjusted Importance Measures for Aircraft System
350
Maintenance Optimization,” Aerospace, vol. 5, no. 3, pp. 1–20, 2018.
351
[10] S. Ferrari, “From Gob to Bottle: BOTTERO Simulates the Complete Glass,” Dynamics, no. 37,
352
pp. 56–60.
353
[11] K. Hiltmann and T. Neubauer, “Case study : Gob loading in a glass moulding machine,”
354
Procedia CIRP, vol. 39, pp. 203–208, 2016.
355
[12] M. (Emhart G. Jetter, “Partnering for Perfect Packaging Solutions,” Emhart Glass Brouchure,
356
2012.
357
[13] N. Sembiring, N. Panjaitan, and F. A. Saragih, “The engine maintenance scheduling by using
358
reliability centered maintenance method and the identification of 5S application in PT . XYZ
359
The engine maintenance scheduling by using reliability centered maintenance method and
360
the identification of 5S applica,” in Conf. Series: Materials Science and Engineering, 2018.
361
[14] M. Mohan, O. P. Gandhi, and V. P. Agrawal, “Maintenance strategy for a coal-based steam
362
power plant equipment : a graph theoretic approach,” Proc. Inst. Mech. Eng. Part A J. Power
363
Energy, vol. 218, no. 8, pp. 619–636, 2004.
364
[15] M. Cocconcelli, “Development of a Methodology for Condition-Based Maintenance in a
365
Large-Scale Application Field,” Machines, vol. 6, no. 2, pp. 1–19, 2018.
366
[16] T. Zhang, Y. Chen, C. Wang, and S. Zhang, “Application of Reliability-centered Maintenance
367
Method in Maintenance and Control Optimization in NPPs,” no. Icca, 2016.
368
[17] I. H. Afefy, “Reliability-Centered Maintenance Methodology and Application : A Case
369
Study,” Eng. 2(11), 863., vol. 2, no. 11, pp. 863–873, 2010.
[18] R. Ramli and M. N. Arffin, “Reliability Centered Maintenance in Schedule Improvement of
371
Automotive Assembly Industry,” Am. J. Appl. Sci., vol. 9, no. 8, pp. 1232–1236, 2012.
372
[19] W. Wang and H. B. . Majid, “Reliability data analysis and modelling of offshore oil platform
373
plant,” J. Qual. Maint. Eng., vol. 6, no. 4, pp. 287–295, 2000.
374
[20] I. Emovon, R. A. Norman, and A. J. Murphy, “Elements of maintenance systems and tools for
375
implementation within the framework of reliability centred maintenance - a review,” J. Mech.
376
Eng. Technol., vol. 8, no. 2, 2016.
377
[21] M. A. Tarar, “Study Reliability Centered Maintenance ( RCM ) of Rotating Equipment through
378
Predictive Maintenance,” in International Conference on Research in Science, Engineering and
379
Technology (ICRSET’), 2014, pp. 2–7.
![Figure 1: Typical individual section forming machine (ISM). [12]](https://thumb-us.123doks.com/thumbv2/123dok_us/7970855.1321841/3.595.80.511.226.459/figure-typical-individual-section-forming-machine-ism.webp)
![Figure 2: An overview of the items of RCM process in sequence [16]](https://thumb-us.123doks.com/thumbv2/123dok_us/7970855.1321841/4.595.79.507.78.332/figure-overview-items-rcm-process-sequence.webp)