Article
1
Improving Queuing System with Limited Resources
2
Using TRIZ and Arena Simulation
3
Siti Azfanizam Ahmad1*, Kok Weng Ng2, Siti Hajar Airdzaman1, Mei Choo Ang3 and Salami
4
Bahariah Suliano1
5
1 Department of Mechanical and Manufacturing Engineering, Faculty of Engineering, Universiti Putra
6
Malaysia, Selangor, Malaysia.
7
2 Industrial Design Centre, Sirim Berhad, Malaysia, Selangor, Malaysia
8
3 Institute of Visual Informatics, Universiti Kebangsaan Malaysia, Selangor, Malaysia
9
* Correspondence: [email protected]
10
11
Abstract: A university canteen is a queueing system characterised by non-stationary time of arrival
12
with limited resources where the arrival rate is time dependent and has different pattern of arrival
13
for different time interval. This means at certain time of the day, the arrival rate is much higher
14
than other time and for a university canteen, the arrival rate of customer during the lunchtime is
15
much higher and the food (resources) is limited. Non-stationary time dependent queueing system
16
is not easily modelled mathematically hence such queueing systems are modelled using simulation
17
tools such as ARENA. In order to model a non-stationary time dependent queueing system with
18
limited resources and solve queueing problems using ARENA, researchers have to depend on their
19
knowledge and experience in identifying the appropriate and relevant parameters for the system
20
and make modifications to these parameters of the system to solve queueing problems by means of
21
trial and error. Hence, this research work explores the potentials of applying a systematic problem
22
solving tool, TRIZ to help users to make better decisions in deriving solutions to improve a
23
non-stationary time dependent queueing system with limited resources. A case study was carried
24
out to minimize the waiting time of the customers at the cafeteria of the Faculty of Engineering,
25
Universiti Putra Malaysia (UPM), which has queueing problems for years during lunchtime. TRIZ
26
was applied in this case study and the results showed that TRIZ can assist researchers to derive a
27
solution model that lead to shorter waiting time without incurring additional cost and resources.
28
Keywords: Queuing problem; TRIZ; Arena software; average waiting time
29
30
1. Introduction
31
Queueing problems can lead to serious drawbacks since waiting in a queue will cost time for
32
the customers. Customers who cannot afford to wait will leave the queue and cause losses to the
33
service provider. Queues may occur at a bank or a supermarket where people are waiting for
34
services. There are also queues for public transport where people are waiting for a train or a bus. The
35
most common queueing problem is queueing up for food, which usually occurs at a restaurant.
36
According to Malaysia Food Barometer (MFB), 64.1% of Malaysian population are eating outside
37
rather than having their meals at home [1]. This habit of eating outside means Malaysians will be
38
more likely to encounter waiting queues, which currently are a common sight in restaurants
39
especially during lunchtime. The waiting time during these periods is usually longer than other
40
operation hours.
41
As an effort to reduce this waiting time, researchers used simulation method to aid them in
42
visualizing and understanding the situation. A simulation model implicates a model that has been
43
adapted to be analysed with the use of simulation [2]. In this research work, a simulation model was
44
applied to solve the queueing problem instead of using queueing theory. The simulation model was
45
derived using Arena, a commercial simulation tool which is well established in various applications
46
for simulation modelling [3]. Arena is using a graphical modelling method to define the simulation
47
model by creating, manipulating and linking a number of available basic building blocks [4]. In
48
applying Arena to solve queueing problems, there are six key model elements needed, namely,
49
Model Entities, Model Activities, Model Resources, Exogenous Event, Endogenous Event and
50
Queue [5]. Based on these key model elements, the model for the university canteen was developed
51
and the Arena parameters were obtained via on-site observations and data collections.
52
Based on past research works, there are several positive opinions and outcomes on using
53
simulation approaches to solve a queueing system problem. The performance criterion of a
54
restaurant can easily be measured through simulation and it helps to understand the situation better
55
as well as to simulate any improvement decision [5]. A simulation model can mirror the actual
56
operation of the restaurant/cafeteria. It can be flexibly adapted to deal with complex service and
57
arrival patterns but a simulation model is still considered to be a simplification of the real-life system
58
[6]. Adding complexity is possible in a simulation to allow the simulation model to mirror the actual
59
operation of the restaurant/cafeteria [7]. The Arena software provides users a friendly interface to
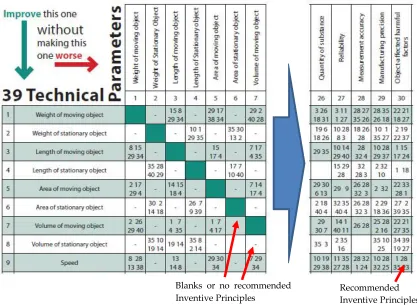
60
model events or activities and others in a system. The statistical reports that can be obtained from
61
Arena after each run are useful and contain valuable information [8]. In a case study to find the
62
reasonable shoreline length of a fishing port, it is reported that with the aid of computer simulation,
63
the approach was able to deal with random service problems and demonstrated good results [9]. The
64
analysis and simulation of factory layouts using Arena have enabled researchers to see the
65
individual movements from one machine to another machine [10].
66
From these past research work, it can be implied that simulation modelling can be used to solve
67
queueing system problems and provides good results. The simulation modelling of queueing system
68
using Arena has been applied in literature to give clear view on the actual real-life scenario on the
69
operation of restaurants and to improve their services. The application of simulation models using
70
Arena allows restaurants to be modelled based on their current scenarios and users can then modify
71
their restaurant based on trial and error basis to remove bottlenecks, number of service counters,
72
layout design and others to improve the performance of their restaurants’ services. Although the
73
application of simulation models using Arena have been successful based on trial and error basis,
74
the trial and error basis can take significant amount of time and effort to come up with a good
75
solution. In addition to that, the time and effort to find a solution to improve a queueing system will
76
substantially increase when the complexity of the system get higher or if the system is huge with
77
many resources, activities and events and the chances of success in finding a good solution will
78
plunge. Therefore, there is a need for a systematic approach that can assist a user in using simulation
79
modelling method such as Arena to find a good solution to improve a queueing system. One of the
80
established tools that have been applied by many enterprises to solve design and manufacturing
81
problems systematically and were proven to be successful is TRIZ [11,12]. In this research work, we
82
explored the application of one the classical TRIZ tool known as the engineering contradiction
83
instead of using the trial and error basis to help users to improve the service performance of a
84
cafeteria located in UPM campus, which frequently experienced long queues particularly during
85
lunchtime.
86
2. TRIZ
87
TRIZ has been applied to help engineers in solving engineering problems for many years and
88
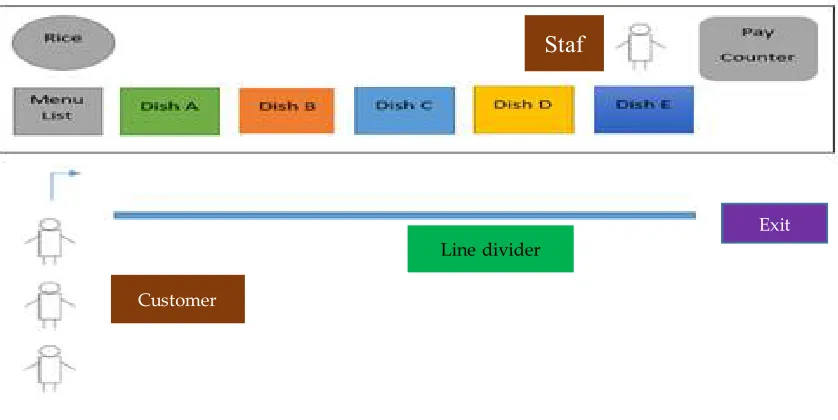
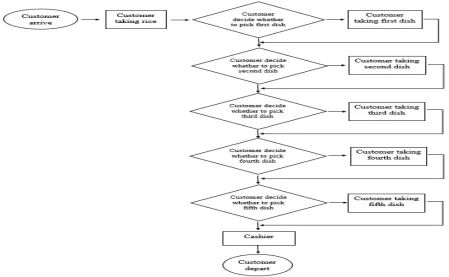
has been used to solve many issues faced by enterprises [12-14]. The application of TRIZ has also
89
been extended into other areas including computer science [15,16], social sciences [17], energy
90
efficiency [18], and manufacturing [14,19,20]. With TRIZ, many leading multi-national and
91
innovative companies are able to record tremendous growth and achievements to enhance their
92
global competitiveness [21,22].
93
TRIZ or the theory of inventive problem solving was derived by Genrich Altshuller [23] based
94
on his study on patent documents since 1940s. The applications of TRIZ were used by many leading
95
3 of 17
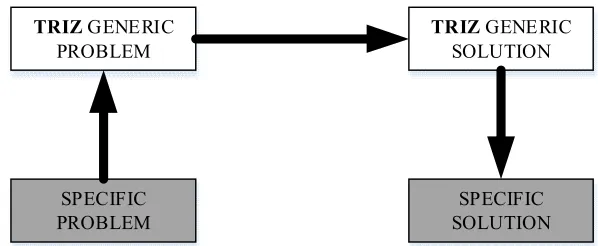
TRIZ is a systematic problem solving method that helps engineers to define and solve technical
97
problems. Figure 1 shows a general model of TRIZ problem solving process. In TRIZ, a specific
98
problem is transformed into TRIZ generic problem and then to TRIZ generic solution before a user
99
translates the TRIZ generic solution to produce specific solution for the specific problem [24].
100
101
TRIZ GENERIC PROBLEM
TRIZ GENERIC SOLUTION
SPECIFIC PROBLEM
SPECIFIC SOLUTION
102
Figure 1. General model of TRIZ application
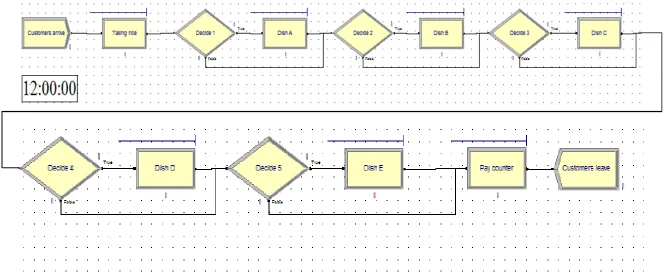
103
One of the major key discoveries of TRIZ is the 40 inventive principles, which are derived from
104
thousands of patents starting from 1946 to 1985 [21,22,24]. This is the basic concept of TRIZ that have
105
been widely applied to generate ideas to solve many engineering problems. There are three
106
categories of contradiction in TRIZ namely administrative contradiction, technical contradiction,
107
and physical contradiction [14,22,24]. Administrative contradiction are contradiction that normally
108
develops from management problems and the solutions to such contradiction are not clear [14].
109
However, administrative contradiction can be transformed into engineering contradiction to be
110
resolved more easily [14]. Physical contradiction is applied for problems with a single antonymous
111
parameter, which creates a contradiction in the same parameter with two different values such as
112
short and long for the length parameter. This contradiction can be solved using Separation
113
strategies, Satisfaction and Bypass [14] of TRIZ. Meanwhile, the engineering contradiction is a tool
114
that is derived based on the notion that there will be technical contradictions that need to be resolved
115
in order to solve any inventive problem i.e. improving a parameter will cause one or more other
116
parameters to worsen.
117
Inventive problems are problems that involve a parameter or feature of a system where when it
118
is improved due to an action taken or a design change, another parameter or feature of the system
119
will get worsen. Hence, the engineering contradiction tool (also known as engineering contradiction
120
matrix) developed by Altshuller has listed 39 improving parameters or features and 39 worsening
121
parameters or features. Each corresponding improving and worsening parameter will have a list of
122
recommended inventive principles that may provide an idea to solve the problem [12].
123
There are 40 inventive principles in total. A good definition of contradiction and by identifying
124
the root cause of the problem will be essential for an effective TRIZ application. After modelling the
125
problem and identifying the root cause of the problem, there are several steps need to be followed
126
before the application of the contradiction matrix and the inventive principles [12]. In order for the
127
user to solve a problem, the user need to identify a parameter that he wants to improve to solve the
128
problem and due to that improvement, another parameter will become worsen. Based on the
129
identified improving and worsening parameters, the engineering contradiction matrix will provide a
130
list of recommended inventive principles (out of the 40 inventive principles mentioned earlier) that
131
maybe be able to solve that particular problem [25].
132
In applying TRIZ engineering contradiction to solve an identified problem, not all the
133
recommended inventive principles must be used to solve the problem. Sometimes none of the
134
recommended inventive principles can be applied to solve the problem, In fact, quite a few of the
135
identified improving and worsening parameter has no recommended inventive principles (there are
136
quite a number of blanks in the contradiction matrix). However, these inventive principles provide
137
In addition to that, it is advised that the user should identify a single parameter to improve and
139
a single parameter that will become worsen to enable the list of inventive principles recommended
140
will not be too many. Therefore, it is important to model the system by defining the problem and
141
break down the system into components. Then, the user should investigate and explore to determine
142
the root cause of the problem before trying to solve the problem.
143
3. Problem Definition
144
This section elaborates the background of the problem and describes the observations being
145
conducted to identify the actual scenario of the cafeteria.
146
3.1. Introduction
147
It was observed that the waiting time was long at the cafeteria of Faculty of Engineering, UPM,
148
Serdang. Based on the current situation, customers can come from any direction to enter the system.
149
In other words, there is no proper queue or line to enter the system. This situation caused hassles at
150
the cafeteria, as customers will dash or swarm around the front counter of the cafeteria to pick their
151
meals. A study was conducted during lunch hour, which was from 12.00pm to 1.00pm because it
152
was the peak hour and thus maximum queueing time at the cafeteria consistently occurred during
153
this period. It is important to find out how long a customer had to wait in a queue before they are
154
served and how the waiting time can be reduced without deploying extra working staff. A long
155
waiting time may cause the cafeteria to lose customers since customers tend to leave the queue if
156
they have to wait for a long time to get their lunch.
157
Hence, the development of a simulation model for the cafeteria would help to evaluate possible
158
improvement on the current situation. By performing the simulation, the average waiting time for
159
each customer would be figured out. This case study is important, as it is able to bring benefits to
160
both customers and the cafeteria itself. For instance, if customers know the average waiting time,
161
they can estimate how much time they need to spend if they want to dine at this cafeteria. It helps
162
customers to make decision and provide more efficient time management. Eventually, this might
163
help to reduce the possibilities of balking customers and company would not suffer losses.
164
Nevertheless, the management of the cafeteria is not keen on incurring additional cost such as using
165
automation and on increasing the number of workers. Thus, the objective of this research is to
166
investigate and minimize the waiting time at the cafeteria of Faculty of Engineering, UPM, Serdang,
167
Selangor, Malaysia, without incurring additional cost by using the TRIZ and Arena software.
168
3.2. System description based on observation
169
Observation was done at the cafeteria to identify the actual scenario of the cafeteria in order to
170
enable the modelling of the cafeteria system to be made as accurate as possible. In this research, the
171
observation was done during lunch hour from 12.00pm to 1.00pm. The arrival time of customers was
172
recorded by using a stopwatch. The purpose of the observation was to collect data to be entered into
173
the model.
174
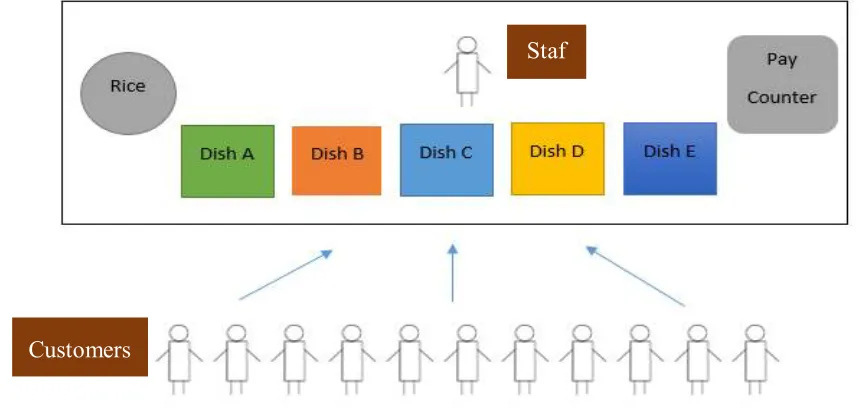
The observation conducted was also to determine the layout of the cafeteria. Figure 2 illustrates
175
the layout of the cafeteria while Figure 3 shows the flowchart of the process of current queueing
176
system. From Figure 2, it can be seen that the cafeteria has a counter that can accommodate variety of
177
dishes. Other than that, it is observed that only one staff is working at the front counter at a time and
178
he acts both as a waiter and a cashier.
179
According to Figure 2, it is shown that customers arriving at the same time at the counter. If the
180
customers want to purchase food from the cafeteria, they have to request for the rice from the
181
working staff. Then, customer will choose and pick the first dish from all of the dishes that were
182
served in the front counter. After that, the customers have to decide whether they want to pick the
183
next dish or not. If yes, customer will take another dish. Otherwise, they will proceed to pay counter
184
5 of 17
186
Figure 1.
Layout of the cafeteria.
187
188
189
Figure 2.
Flowchart of the current queuing system at the cafeteria.
190
The time between arrivals of the customers and time taken for each customers being served by
191
the staff were observed. The time was recorded in minutes and the average value obtained from that
192
one-hour observation was inserted into the software as the input. The time to serve customer caused
193
delay to the process and thus queue was forming up during this stage. In this case study, each
194
customer was served by a staff at two different processes. The first process was to serve the customer
195
with rice when the customer requested for it and the second process was to collect payments for the
196
food when the customer wanted to pay.
197
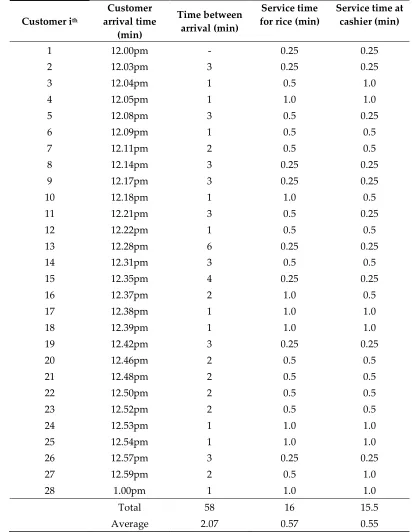
The data of the one-hour observation was recorded and is shown in Table 1. According to the
198
data collected, the average time between arrivals is 2 minutes. This average arrival time was set in
199
the Arena software as an input. In addition to that, the maximum arrival was set to infinity, 10
200
replications, 60 of replication length and the base time unit in minutes were set.
201
Staf
Table 1. Collected data during one-hour observation.
202
Customer ith
Customer arrival time
(min)
Time between arrival (min)
Service time for rice (min)
Service time at cashier (min)
1 12.00pm - 0.25 0.25
2 12.03pm 3 0.25 0.25
3 12.04pm 1 0.5 1.0
4 12.05pm 1 1.0 1.0
5 12.08pm 3 0.5 0.25
6 12.09pm 1 0.5 0.5
7 12.11pm 2 0.5 0.5
8 12.14pm 3 0.25 0.25
9 12.17pm 3 0.25 0.25
10 12.18pm 1 1.0 0.5
11 12.21pm 3 0.5 0.25
12 12.22pm 1 0.5 0.5
13 12.28pm 6 0.25 0.25
14 12.31pm 3 0.5 0.5
15 12.35pm 4 0.25 0.25
16 12.37pm 2 1.0 0.5
17 12.38pm 1 1.0 1.0
18 12.39pm 1 1.0 1.0
19 12.42pm 3 0.25 0.25
20 12.46pm 2 0.5 0.5
21 12.48pm 2 0.5 0.5
22 12.50pm 2 0.5 0.5
23 12.52pm 2 0.5 0.5
24 12.53pm 1 1.0 1.0
25 12.54pm 1 1.0 1.0
26 12.57pm 3 0.25 0.25
27 12.59pm 2 0.5 1.0
28 1.00pm 1 1.0 1.0
Total 58 16 15.5
Average 2.07 0.57 0.55
203
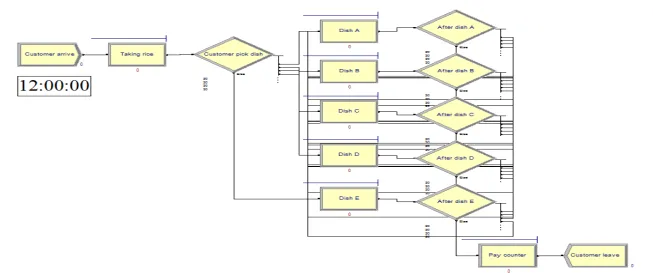
4. Arena Model of the Current Queueing System
204
The Arena model of the current queueing system at the cafeteria is as shown in Figure 4. A
205
customer who arrives and wants to have lunch has to request for the rice first. The customer has to
206
request for the rice from the staff before he decides on the first dish that he wants to choose. Then,
207
the customers will proceed to take the first dish and then decide on whether to choose the next dish
208
and so on or going straight to the pay counter before leaving the queue.
209
In this model, the probability of arrival of any server or choosing a dish (Decide module) was
210
7 of 17
Triangular (TRIA) (0.25, 0.5, 1) distribution. There were four assumptions that were made in this
212
model which are:
213
i. Only five dishes available at the cafeteria at a time.
214
ii. Customers can take as many dishes as they want as long as they do not leave the system.
215
iii. After requested for rice from the staff, customers cannot exit the system without picking at
216
least one dish before paying for the food.
217
iv. Customers enter the system individually, not in groups.
218
Based on the Arena model shown in Figure 4, it can be observed that a user will have difficulty
219
of trying to improve the system using trial and error approach even though the system is just a
220
simple cafeteria with a single server. This difficulty is partly because of the possible involvement of
221
multiple servers, constraints and other factors particularly for new users or users that have little of
222
experience and knowledge in improving a queueing system. This task of improving a queueing
223
system increases significantly, when the system become more complex and large such as a shopping
224
mall.
225
228
229
Sustainability 2018, 10, x FOR PEER REVIEW 9 of 17
Long queues during lunch time at
cafeteria
Cause and Effect Chain Analysis
One Worker is doing all the
work
Insufficient rate of collecting payment from customer Insufficient rate of
serving rice
5. Using TRIZ to Improve a Queueing System
231
One of the classical TRIZ tools, the engineering contradiction was applied to improve this
232
queueing problem found at the cafeteria in UPM. The component modelling done by Arena shown
233
in Figure 4 can be used to represent the cafeteria system and the components inside the system as
234
step towards determining the root cause of the long queue in the cafeteria during lunchtime. The
235
cafeteria system can then be modelled functionally as shown in Figure 5 to identify the queueing
236
problems of the cafeteria system based on the observations conducted and the interaction links
237
between components. Based on the observations, the cashier/waiter has an insufficient rate of
238
serving rice to the customer and also insufficient rate of collecting payment from the customer due to
239
high arrival rate of customers. The observation also noted that the rate customer taking dishes is at
240
normal rate and is not causing significant delays.
241
Based on the functional model developed for the cafeteria, a root cause and effect analysis can
242
be carried out to determine the actual cause of the queueing problem and this is shown in Figure 6.
243
Therefore, it is obvious that from the observations, the lone waiter/cashier will be struggling to serve
244
rice to the customer and to collect payment at the same time during lunch time when the arrival rate
245
of customers is high.
246
247
248
249
250
251
252
Figure 5. Functional model of current queueing system in the cafeteria at UPM.
253
254
255
256
257
258
259
260
261
262
263
264
265
266
267
Figure 6. Root cause and effect of the queueing problem in the cafeteria at UPM during lunchtime.
268
269
This finding corresponds to the results of the Arena model demonstrated in simulation of the
270
scenario at the cafeteria during lunchtime. However, since the owner of cafeteria does not wish to
271
hire additional staff to solve this queueing problem, another inventive solution needs to be figured
272
out to solve or ease the queueing problem at the cafeteria. In view of this, the knowledge and
273
Insufficient rate
Recommended Inventive Principles Blanks or no recommended
Inventive Principles
experience of the user are needed to solve this queueing problem at the cafeteria and the user
274
usually applies trial and error approach to solve this problem. In this research work, TRIZ
275
contradiction matrix will be applied to solve this queueing problem.
276
In applying TRIZ engineering contradiction matrix, the improving feature or parameters in this
277
queueing problem is to speed up the service provided of the lone waiter/cashier to reduce the
278
queueing problem in the cafeteria during lunchtime. However, increasing the speed of the services
279
will definitely help in reducing the queue during the lunch time but the waiter/cashier who is
280
serving the rice to the customer as well as collecting payment from the customer will most likely to
281
be working under duress. The best matching improving parameter from the engineering
282
contradiction matrix for improving the speed of service would be improving parameter number 9,
283
speed. The worsening parameter will be the worker is working under duress and the best matching
284
worsening parameter for working under duress will be worsening parameter number 30, object
285
affected harmful factors. Figure 7 illustrates the part of contradiction matrix that indicates the
286
inventive principles recommended based on the matching improving and worsening parameter.
287
Table 2 summarises the information on the engineering contradiction, improving and worsening
288
parameters as well as the recommended TRIZ inventive principles.
289
290
291
Figure 7. Part of the engineering contradiction matrix indicating the recommended inventive
292
principles 1, 28, 35, 23 based on improving parameters of speed versus worsening parameters of
293
object affected harmful factors.
294
295
296
297
Sustainability 2018, 10, x FOR PEER REVIEW 11 of 17
299
Table 2. Tabulated information about the engineering contradiction, improving and worsening
300
parameters as well as the recommended TRIZ inventive principles.
301
Description
Engineering Contradiction If the waiter/cashier is to improve his speed in providing services, then there will not be a long queue
of customers waiting but the waiter/cashier will be working under duress.
Improving Feature No. 9 Speed (speed of services by the waiter/cashier)
Worsening Feature No.30 Object affected harmful factors (working under duress)
Recommended TRIZ Inventive principles obtained from Engineering Contradiction Matrix
#1 Segmentation #28 Mechanics Substitution
#35 Parameter Changes #23 Feedback
302
6. Potential solution for solving the queueing problem at the cafeteria in UPM based on the
303
recommended TRIZ inventive principles
304
The first recommended inventive principle is inventive principle number 1, which is
305
segmentation. In the current layout of the cafeteria, the lone worker has to perform two tasks, which
306
is to become a waiter that serve rice to arriving customers as well as to collect payment from the
307
customers after the customers have selected their dishes. Segmentation principle is a principle that
308
hint at a solution based on dividing or breaking down a task into separate tasks. This inventive
309
principle immediately provide an idea that the worker may only need to collect payment from the
310
customers as this is most important task for any business. The task of serving of rice can be allocated
311
to the customers themselves as the customers are already choosing and taking up the dishes on their
312
own. This means the tasks of serving rice will be a self-service task. With this task is transferred to
313
the customer as a self-service task, the lone worker can focus to be cashier and can speed up the
314
overall rate of service and reduce the problem of long queueing time.
315
The second recommended inventive principle is mechanics substitution, which implicates a
316
kind of replacement for the current system to solve a particular problem. This inventive principle
317
hinted at a solution that replace the currently manual service to an automated one. This means the
318
serving of rice or the payment collection can be done by an automated system but since the
319
management of the cafeteria prefers not to incur additional cost, hence this solution will not be
320
explored.
321
The third recommended inventive principle is parameter changes. This inventive principle is
322
suggesting a solution to change certain parameters of the system to solve a particular problem.
323
Parameter change principle for the queueing problem in the cafeteria problem means identifying the
324
parameters in the cafeteria that can be changed to solve the queueing problem. With the current
325
layout of the cafeteria, the arrangement of dishes from A to E allows a large number of customers to
326
simultaneously choose and take their dish after requesting for rice and then queue at the cashier
327
point, This will cause long queues at the point of serving rice and the cashier point. If only one
328
worker is serving the rice and collecting the payment then the worker will highly likely to focus on
329
the serving of rice to enable the customers to enter the system but then queue at the cashier point
330
will be very long as the worker is mostly pre-occupied at the point where the rice is served. With the
331
self-service introduced for serving of rice, the lone worker can focus on collecting payment to reduce
332
the queue at the cashier point but the arrangement of the dishes that allows the customers to choose
333
parameter changes suggest a change in the layout of the cafeteria to allow the customer to prolong
335
their rate of taking up the dishes in order to balance the rate of payment collection.
336
Based on the parameter changes inventive principle, the layout of the cafeteria was modified to
337
allow a single line queue to access the dishes in order to only allow every customer to choose and
338
take their dish one at time and therefore balancing the rate of taking dishes with the payment
339
collection. After modification, customer can only enter the cafeteria from one designated specified
340
entrance as shown in Figure 8. In this way, customers are single-lined and to queue from a rice
341
serving point. The customers are self-served based on First in First out (FIFO) rule.
342
The last recommended inventive principle is feedback. Based on this principle, the hinted
343
solution should involve some kind feedback that can be incorporated into the cafeteria to solve the
344
queueing problem. A potential solution from this inventive principle is that the cashier point can
345
have a bell or ringing system to indicate that there are customers waiting to pay for their food while
346
the worker is focused on serving the rice to the customer. This feedback system via a ringing system
347
can slightly improve the rate of collecting payment for service but with the adoption of the first
348
inventive principle (introduction of self-service in rice serving), this ringing system seems to be
349
unnecessary. Nevertheless, the ringing system can still be introduced at rice serving point to inform
350
the worker when there is a need to replenish rice, which may run out during peak demand. Such
351
feedback system will improve the rate of service significantly.
352
The inventive principle feedback also provides an idea of creating a list of menu (menu-of-the
353
day) to provide feedback to the customer about the dishes that will be served in the cafeteria to
354
prevent unnecessary queueing by customers that are not interested with the dishes served, which
355
may cause delay in serving genuine interested customers.
356
Figure 8 shows the modified layout of the cafeteria and Figure 9 shows the flowchart of the
357
process of the proposed queueing system at the cafeteria. In this modified cafeteria layout,
358
customers are able to see the menu list earlier before entering the queue. In the menu list, all of the
359
dishes of the day are displayed so that customer can make decision faster and easier. If customer was
360
not interested in the menu on that day, they can leave the queue straight away.
361
Based on Figure 8, customers arrive at the cafeteria in a line or a queue. The customers will take
362
up rice via self-service and the lone worker plays the role of the cashier at the pay counter. Then,
363
customer will decide whether to pick the first dish or go to the next dish. If yes, customer will take
364
the dish or else customers have to decide whether to pick the next dish. The process is the same until
365
the last dish. After the customers are done picking the dishes, they proceed to pay at the counter and
366
finally leave the system.
367
368
Figure 8. Modified layout of the cafeteria.
369
Staf
Line divider
Customer
Sustainability 2018, 10, x FOR PEER REVIEW 13 of 17
With the layout design and the processes of food serving at the cafeteria based on TRIZ
370
engineering contradiction tool, the user can apply their modification to the cafeteria model using
371
Arena and re-simulate the proposed cafeteria model to determine whether there were
372
improvements in the queueing problem faced by the cafeteria.
373
374
Figure 9. Flowchart of the proposed queueing system at the cafeteria.
375
The Arena model of the proposed queueing system for a cafeteria in UPM is as shown in Figure
376
10. In this model, the probability is considered as 50% for each dish because there is a Decide module
377
before every single dish. Customer had to make decision before every dish and they might skip the
378
dish if they want to. In other words, the probability is 50% of whether customer will pick the dish or
379
go to the next dish. The processing time is based on Triangular TRIA (0.25, 0.5, 1) distribution. The
380
number of staff and timeframe was set the same as the current queueing system.
381
There were five assumptions that were made in this proposed model. Assumptions number i, ii
382
and iv were the same as in the current queueing system of the cafeteria. Assumption iii was
383
modified such that customers would take up race via self-service. The new additional assumption
384
was: there was no U-turn for customers who change their mind on choosing the dishes or in short,
385
the customer is not expected to change their mind in choosing their dishes. Once customer passed a
386
dish, they could not go back to the previous dishes.
387
389
390
391
392
393
394
395
396
397
398
399
400
401
402
403
404
Figure 10. Arena model of the proposed queueing system.
405
Sustainability 2018, 10, x FOR PEER REVIEW 15 of 17
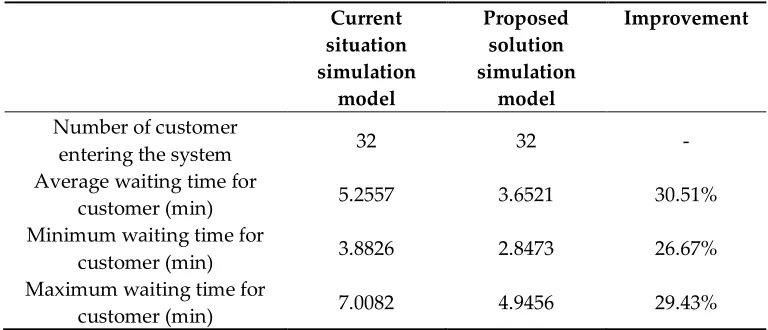
4. Discussion
408
Table 3 shows the summary of the results obtained from the model simulations. According to
409
the table, number of customer entering the system was 32 for both models. This figure was not much
410
different from the observation, which was 28 customers within 1 hour period. For current queueing
411
system, the average waiting time for customer is 5.2557 minutes; the minimum waiting time is 3.8826
412
minutes while the maximum waiting time is 7.0082 minutes. For the proposed model, the average
413
waiting time for customer is 3.6521 minutes. The minimum of the waiting time is 2.8473 minutes
414
while the maximum waiting time is 4.9456 minutes.
415
Table 3. Summary of results of the waiting time for both models.
416
Current situation simulation
model
Proposed solution simulation
model
Improvement
Number of customer
entering the system 32 32 -
Average waiting time for
customer (min) 5.2557 3.6521 30.51%
Minimum waiting time for
customer (min) 3.8826 2.8473 26.67%
Maximum waiting time for
customer (min) 7.0082 4.9456 29.43%
417
The results show that there were significant improvement in terms of average waiting time,
418
minimum waiting time and maximum waiting time in the proposed model compared to the current
419
queueing model. The average waiting time, minimum waiting time and the maximum waiting time
420
were improved in the range of 26% to 31% in the proposed model. Hence, the proposed model has
421
potential to be used as service improvement method of the cafeteria.
422
It is observed that the improvement was achieved without deploying extra working staff or
423
resources, which could incur extra cost. The modification on the layout alone and the introduction of
424
the self-service in serving rice are able to minimize the waiting time of the customers. In addition to
425
that, a list of menu was proposed to be put up in front of the counter before customers enter the
426
queueing system to reduce the potential of balking customer. By showing the menu-of-the-day,
427
customer can make early decision whether to purchase food from the cafeteria or simply leave from
428
the venue. Hence, the application of TRIZ and Arena can be used to help a cafeteria to reduce its
429
queueing problem significantly and this will contribute to the increase of profits and satisfaction of
430
the customers.
431
5. Conclusion and Research Contributions
432
A long waiting time (due to long queues) problem in the cafeteria was investigated and
433
modelled using Arena simulation with the intention of using TRIZ engineering contradiction tool to
434
derive solutions to the problem instead of using trial and errors approach. The root cause for the
435
long waiting time in a cafeteria indicated that the lone worker was unable to cope with the tasks of
436
serving rice and collecting payments at lunchtime where customers arrive in high rate. TRIZ
437
engineering contradiction tool was applied to find the solutions to improve the queueing problem at
438
the cafeteria. The potential solutions derived from the recommended inventive principles of TRIZ
439
was then applied to modify the layout of the cafeteria, convert the rice serving task to self-service
440
and to create menu-of-the-day that will provide feedback to the customers to prevent unnecessary
441
The proposed system was then modelled and tested on the Arena simulation. The results
443
showed that the proposed model based on TRIZ solutions produced promising results with no
444
significant impact on the cost because the number of the resources was kept the same as the current
445
situation. Based on the results, it is proven that the objective of this research was successfully
446
achieved. The results show that the proposed solution model has a shorter waiting time compared to
447
the current model.
448
This research showed that TRIZ could be applied with Arena simulation to contribute to the
449
betterment of the cafeteria management in terms of its minimising the waiting time of the customers
450
to be served. With the minimising of the waiting time for customers, the cafeteria management is
451
able to increase their Quality of Service (QoS) by optimising the layout and workforce to cater
452
customers better and faster. In addition to that, the lone worker of the cafeteria can also work more
453
efficiently in a less duress environment and can focus the key task of collecting payments.
454
The reduction of waiting time at the cafeteria can significantly affect the overall level of
455
satisfaction of the customers. By reducing the waiting time, it will help the company to attract more
456
customers to the cafeteria and company should be able to increase their profits.
457
458
Supplementary Materials:
459
Author Contributions:
460
Conceptualization: Siti Azfanizam Ahmad and Siti Hajar Airdzaman;
461
Methodology: Siti Hajar Airdzaman and Salami Bahariah Suliano;
462
Validation: Siti Azfanizam Ahmad, Mei Choo Ang, Kok Weng Ng;
463
Formal analysis: Siti Hajar Airdzaman and Kok Weng Ng;
464
Investigation: Siti Hajar Airdzaman;
465
Resources: Siti Hajar Airdzaman;
466
Data curation: Siti Hajar Airdzaman;
467
Writing—original draft preparation: Siti Hajar Airdzaman and Salami Bahariah Suliano;
468
Writing—review and editing: Kok Weng Ng, Siti Azfanizam Ahmad, Mei Choo Ang;
469
Visualization: Siti Hajar Airdzaman;
470
Supervision: Siti Azfanizam Ahmad;
471
Funding acquisition: Siti Azfanizam Ahmad.
472
Funding: This research and APC was funded by Journal Publication Fund (9001103), Research Management
473
Centre, Universiti Putra Malaysia.
474
Acknowledgments:
475
Conflicts of Interest: The authors declare no conflict of interest.
476
References
477
1. Tan, C. More Malaysians eat out nowadays but are we eating enough healthy food? Availabe online:
478
http://www.thestar.com.my/news/nation/2014/08/03/food-always-on-our-minds-more-malaysians-eat-out
479
-nowadays-but-are-we-eating-enough-healthy-food/ (accessed on 5 October 2018).
480
2. Law, A.; Kelton, W. Simulation Modelling and Analysis, 4th ed.; McGraw-Hill: 2004.
481
3. Persson, F.; Araldi, M. The development of a dynamic supply chain analysis tool—Integration of SCOR
482
and discrete event simulation. International Journal of Production Economics 2009, 121, 574-583.
483
4. Hajjar, D.; Abourizk, S.M. Application Framework for Development of Simulation Tools. Journal of
484
Computing in Civil Engineering 2000, 14, 160-167.
485
5. Ahsan, M.M.; Islam, M.R.; Alam, M.A. Study of Queueing System of a Busy Restaurant and a Proposed
486
Facilitate Queueing System. IOSR Journal of Mechanical and Civil Engineering (IOSR-JMEC) 2014, 11, 31-35.
487
6. Bhattacharjee, P.; Ray, P.K. Simulation modelling and analysis of appointment system performance for
488
multiple classes of patients in a hospital: A case study. Operations Research for Health Care 2016, 8, 71-84,
489
Sustainability 2018, 10, x FOR PEER REVIEW 17 of 17
7. Dharmawirya, M.; Adi, E. Case Study for Restaurant Queueing Model. In Proceedings of 2011
491
International Conference on Management and Artificial Intelligence - ICMAI 2011, Bali, Indonesia; pp.
492
52-55.
493
8. Nawara, G.M.; Hassanein, W.S. Solving the Job-Shop Scheduling Problem by ARENA Simulation
494
Software. International Journal of Engineering Innovation & Research 2013, 2, 161-166.
495
9. Gui, J.; Wen, Z.; Bi, E. Reasonable Shoreline Length of a Fishing Port by Simulation Software Arena. In
496
Proceedings of The Fifth International Conference on Transportation Engineering (ICTE 2015), Dalian,
497
China, September 26-27; pp. 2726-2732.
498
10. Bobby, J.; Jenson, J.E. Analysis and Simulation of Factory Layout using ARENA. International Journal of
499
Scientific and Research Publications 2013, 3.
500
11. Fey, V.; Rivin, E. Innovation on Demand: New Product Development Using TRIZ; Cambridge University Press:
501
2005.
502
12. Mann, D.L. Hands-on Systematic Innovation: For Technical Systems; IFR Press: 2010.
503
13. Hsieh, H.-N.; Chen, J.-F.; Do, Q.H. Applying TRIZ and Fuzzy AHP Based on Lean Production to Develop
504
an Innovative Design of a New Shape for Machine Tools. Information 2015, 6, 89-110.
505
14. Yeoh, T.S.; Yeoh, T.J.; Song, C.L. TRIZ: Systematic Innovation in Manufacturing; Firstfruits Sdn. Bhd.:
506
Malaysia, 2015.
507
15. Ahmad, S.A.; Pham, D.T.; Ng, K.W.; Ang, M.C. TRIZ-inspired Asymmetrical Search Neighborhood in the
508
Bees Algorithm. In Proceedings of The Asian Modelling Symposium (AMS2012): the 6th Asia
509
International Conference on Mathematical Modelling and Computer Simulation, Kuala Lumpur, Malaysia
510
& Bali, Indonesia,, 28 May 2012 & 31 May 2012; pp. 29-33.
511
16. Mann, D.L. Systematic (software) Innovation; IFR Press: 2008.
512
17. Ang, M.C.; Ng, K.W.; Ahmad, S.A.; Wahab, A.N.A. Using TRIZ to generate ideas to solve the problem of
513
the shortage of ICT workers. Applied Mechanics and Materials 2014, 564, 733 -739.
514
18. Ahmad, S.A.; Ang, M.C.; Ng, K.W.; Wahab, A.N.A. Reducing Home Energy Usage based on TRIZ
515
Concept. Advances in Environmental Biology 2015, 9, 6-11.
516
19. Ang, M.C.; Ng, K.W.; Pham, D.T.; Soroka, A. Simulations of PCB Assembly Optimisation Based on the
517
Bees Algorithm with TRIZ-inspired Operators. In Proceedings of 3rd International Visual Informatics
518
Conference (IVIC 2013), Equatorial Hotel Bangi, Selangor, Malaysia, 13-15 November 2013.
519
20. Ang, M.C.; Ng, K.W.; Cher, D.T. Verifying Innovative Solutions of TRIZ Engineering Contradiction Matrix
520
Using Substance-Field Analysis. Applied Mechanics and Materials 2015, 761, 196-201.
521
21. Feniser, C.; Burz, G.; Mocan, M.; Ivascu, L.; Gherhes, V.; Otel, C.C. The Evaluation and Application of the
522
TRIZ Method for Increasing Eco-Innovative Levels in SMEs. Sustainability 2017, 9, doi:10.3390/su9071125.
523
22. Wang, C.-N.; Huang, Y.-F.; Le, T.-N.; Ta, T.-T. An Innovative Approach to Enhancing the Sustainable
524
Development of Japanese Automobile Suppliers. Sustainability 2016a, 8, doi:10.3390/su8050420.
525
23. Altshuller, G. TRIZ Keys to Technical Innovation; Technical Innovation Center, Inc. : Worcester, 1998.
526
24. Wang, C.-N.; Lin, H.-S.; Hsueh, M.-H.; Wang, Y.-H.; Vu, T.-H.; Lin, T.-F. The Sustainable Improvement of
527
Manufacturing for Nano-Titanium. Sustainability 2016b, 8, doi:10.3390/su8040402.
528
25. Altshuller, G. And Suddenly the Inventor Appeared: TRIZ, the Theory of Inventive Problem Solving; Technical
529
Innovation Center: 1996.