1
Conservation Tillage Increases Water Use Efficiency of
Spring Wheat by Optimizing Water Transfer in a
Semi-Arid Environment
Zhengkai Penga,b, Linlin Wanga,b, Junhong Xiea,b, Lingling Lia,b*, Jeffrey A.
Coulterc, Renzhi Zhanga,d , Zhuzhu Luoa,d, Jana Kholovae, Sunita
Choudharye
a Gansu Provincial Key Laboratory of Aridland Crop Science, Gansu
Agricultural University, Lanzhou 730070, China
b College of Agronomy, Gansu Agricultural University, Lanzhou 730070,
China
c Department of Agronomy and Plant Genetics, University of Minnesota, St.
Paul, MN 55108, USA
d College of Resource and Environment, Gansu Agricultural University,
Lanzhou 730070, China
e International Crops Research Institute for Semi-arid Tropics(ICRISAT),
Patancheru 502324, India
*Corresponding author at College of Agronomy / Gansu Provincial Key
Laboratory of Aridland Crop Science, Gansu Agricultural University,
Lanzhou 730070, China.
Abstract
1
Water availability is a major constraint for spring wheat production on the 2
western Loess Plateau of China. The impact of tillage practices on water 3
potential, water potential gradient, water transfer resistance, yield, and water 4
use efficiency (WUEg) of spring wheat was monitored on the western Loess 5
Plateau in 2016 and 2017. Six tillage practices were assessed, including 6
conventional tillage with no straw (T), no-till with straw cover (NTS), no-till 7
with no straw (NT), conventional tillage with straw incorporated (TS), 8
conventional tillage with plastic mulch (TP), and no-till with plastic mulch 9
(NTP). No-till with straw cover, TP, and NTP significantly improved soil water 10
potential and root water potential at the seedling stage and leaf water potential 11
at the seedling, tillering, jointing, and flowering stages, compared to T. These 12
treatments also significantly reduced the soil-leaf water potential gradient at 13
the 0-10 cm soil layer at the seedling stage and at the 30-50 cm soil layer at 14
flowering, compared to T. Thus, NTS, TP, and NTP reduced soil-leaf water 15
transfer resistance and enhanced transpiration. Compared to T, the NTS, TP, 16
and NTP treatments significantly increased biomass yield (BY) by 18, 36, and 17
40%, respectively, and grain yield (GY) by 28, 22, and 24%, respectively, with 18
corresponding increases in WUEg of 24, 26, and 24%, respectively. These results 19
demonstrate that NTS, TP, and NTP improved GY and WUEg of spring wheat 20
by decreasing the soil-leaf water potential gradient and soil-leaf water transfer 21
sustainable intensification of wheat production in semi-arid areas. 23
Keywords: Conservation tillage; Water potential; Water potential gradient; 24
Water transfer resistance; Water use efficiency 25
26
1. Introduction
27
Wheat (Triticum aestivum L.) is a major food crop in China and in the world, 28
which plays an important role in ensuring China’s food security [1]. The 29
western Loess Plateau of China is characterized by harsh climatic conditions, 30
including frequent spring drought, severe wind erosion, and water erosion [2, 31
3]. Spring wheat is one of the dominant crops in this region, but its growth is 32
restricted by limited and erratic rainfall [4, 5]. Thus, yield of spring wheat in 33
this region is far less than potential yield, ranging from 1500 to 3000 kg ha−1 [6-34
8]. Increasing water use efficiency is a major goal for advancing sustainable 35
intensification of crop production on the western Loess Plateau that will have 36
great impact at local and regional scales [9]. 37
Water use efficiency depends on the amount of water absorbed by plants, 38
of which the majority is lost by transpiration [10]. Water absorption depends 39
on the free energy of water in plants, which is shown as the level of water 40
potential in the soil-plant-atmosphere continuum [11]. The lower the water 41
potential of plant, the stronger the water absorption capacity. Kang [12] found 42
that transpiration rate was positively correlated with the water potential 43
potential of maize (Zea mays L.) decreased from the lower to upper part of the 45
canopy and that there was relatively large resistance among the different 46
interfaces of water flow in the transmission process. Xerophytes have 47
moderately deep roots and display a rapid drop in leaf water potential with 48
increasing leaf water deficit, which generates a steep water potential gradient 49
in the soil-plant continuum that enhances water uptake by roots [14]. 50
Conservation tillage is a technique that reduces soil disturbance and 51
retains crop residues on the soil surface [15]. It can effectively reduce wind 52
erosion [16], water erosion [17], and soil bulk density, and enhance soil total 53
porosity and saturated water conductivity [18, 19], thereby increasing rainfall 54
infiltration and soil water holding capacity [20, 21], reducing soil evaporation 55
and enhancing crop growth, yield, and water use efficiency [22-24]. No-till with 56
straw cover has been shown to improve grain yield by 13%, and water use 57
efficiency 7.6% in winter spring wheat on the Loess Plateau of China [25]. No-58
till with straw cover has been shown to improve grain yield by 153%, and water 59
use efficiency by 46% in wheat and maize (Zea mays L.) relay-planting system
60
on Hexi Corridor of northwestern China with typical temperate arid zone of 61
continent [26]. Subsoil tillage with 50% chopped straw mulching has been 62
shown to improve grain yield by 5-7%, and water use efficiency by 51-52% in 63
maize on the Huang–Huai–Hai valley with mean annual precipitation is 556.2 64
mm [27]. Ridge mulched with plastic film has been shown to improve grain 65
China [4]. However, the mechanism by which conservation tillage improves 67
water use efficiency from the perspective of water potential gradient has not 68
been reported. Therefore, the objectives of this study were to assess the effects 69
of different tillage practices on soil, root, and leaf water potential indexes, soil-70
leaf water transfer resistance, transpiration, yield, and water use efficiency of 71
spring wheat to provide a theoretical basis for improving water use efficiency 72
and conservation tillage development on the western Loess Plateau. 73
74
2.
Materials and methods
75
2.1. Experimental site 76
This study was conducted in 2016 and 2017 based on a long-term field 77
experiment initiated in 2001. The experiment was located at the Rainfed 78
Agricultural Experimental station of Gansu Agricultural University (35°28′N, 79
104°44′E, elevation: 1971 m above sea level) in Gansu Province in northwestern 80
China, a typical rainfed area on the western Loess Plateau. The area is 81
characterized by a hilly landscape and is prone to soil erosion. The aeolian soil 82
at the experimental site is locally known as Huangmian [28], is a Calcaric 83
Cambisol according to the FAO (1990) [29], soil classification, and is primarily 84
used for annual crop production [30]. This soil type has a sandy loam texture 85
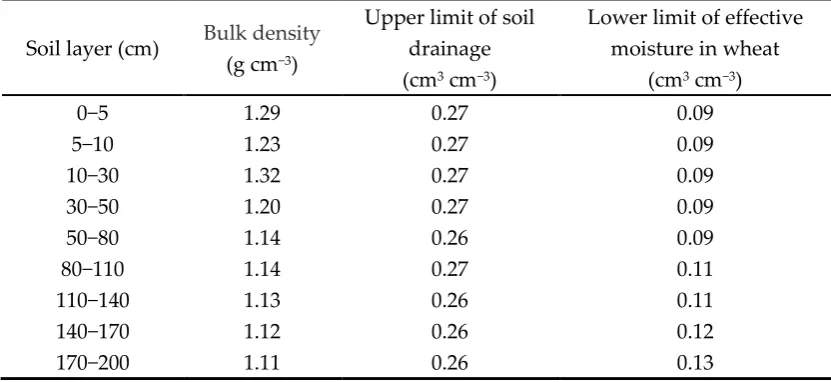
with ≥50% sand. Detailed soil physical and water characteristics at the 86
experimental site before sowing in 2001 are presented in Table 1. Annual 87
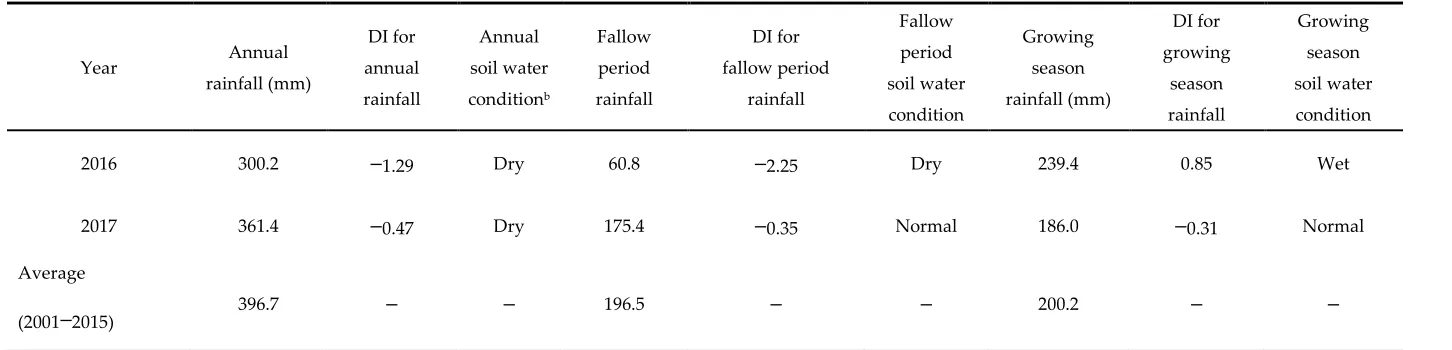
and 396.7 mm for the 2001-2015 average, and is shown monthly in Fig. 1. 89
Annual (January through December), fallow period (January through March 90
and August through December), and growing season (April through July) 91
rainfall, drought index (DI), and soil water condition at the experimental site 92
for 2016, 2017, and the 2001-2017 average are shown in Table 2. Daily maximum 93
air temperature at the experimental site can reach 38oC in July, while minimum 94
air temperature can drop to –22oC in January. Long–term climatic records show 95
that annual cumulative air temperature >10oC is 2240oC and annual radiation is 96
5930 MJ/m2, with 2480 hours of sunshine per year. Average annual evaporation 97
at the experimental site is 1531 mm (coefficient of variation: 24.3%), which is 98
three- to four-fold greater than precipitation. 99
100
2.2. Experimental design and agronomic management 101
The experimental design was a randomized complete block with four 102
replications. Each plot was 4 m wide × 20 m long. The long-term experiment 103
included six tillage practice treatments in a two-year spring wheat/pea (Pisum 104
sativum L.) rotation, with both phases of the rotation present in each year. All
105
measurements in this study were made from plots planted to wheat. The 106
conventional tillage with no straw (T) treatment included removal of all 107
aboveground crop residues at the time of grain harvest before moldboard 108
plowing to a depth of 20 cm. The conventional tillage with straw incorporated 109
crops were retained and incorporated into the soil with tillage. The no-till with 111
no straw (NT) treatment had all aboveground crop residues removed at the 112
time of grain harvest and no tillage operations. The no-till with straw cover 113
(NTS) treatment was the same as NT, except that all residues from the previous 114
crops were retained. The conventional tillage with plastic mulch (TP) treatment 115
was the same as T, except that alternating ridges (10 cm high × 40 cm wide) and 116
furrows (10 cm wide) were made after harrowing with a ridging implement 117
and all ridges and furrows were covered with colorless plastic film mulch using 118
a plastic mulch laying machine prior to sowing crops in the furrows. The no-119
till with plastic mulch (NTP) treatment was the same as NT, except that the 120
entire plot area was covered with colorless plastic film mulch using a plastic 121
mulch laying machine. There were same ridges and furrows with TP. 122
The spring wheat and pea cultivars were Dingxi 40 and Lvnong 2, 123
respectively. Wheat was sown at a rate of 187.5 kg ha-1 in rows spaced 20 cm 124
apart and pea was seeded at 180 kg ha-1 in rows spaced 24 cm apart. 125
Immediately prior to the time of plastic mulch laying in the treatments with 126
plastic mulch, all treatments were fertilized with calcium superphosphate (105 127
kg P2O5 ha-1 for wheat and pea) and urea (105 and 20 kg N ha-1 for wheat and 128
pea, respectively) that was broadcast uniformly over the entire plot area. Wheat 129
was sown on 27 March 2016 and 26 March 2017, and harvested on 25 July 2016 130
and 20 July 2017. Weeds were removed by hand during the growing season and 131
133
2.3. Measurements and calculation 134
2.3.1. Precipitation and drought index 135
Daily precipitation was measured with a rainfall canister at the 136
experimental site and DI was calculated as follows [9]: 137
DI =𝐴𝑟−𝑀
𝛿 ⑴
138
where Ar is annual rainfall, M is average annual rainfall, and 𝛿 is the standard 139
deviation for annual rainfall. Drought index can be used to distinguish among 140
wet (DI > 0.35), normal (-0.35 ≤ DI ≤ 0.35), and dry (DI < -0.35) soil water 141
conditions for various time periods, including on an annual basis, for a growing 142
season, and for a fallow period [9]. Therefore, rainfall during the growing 143
season and fallow period were used to also calculate DI for these periods in the 144
two study years. 145
146
2.3.2. Water potential and soil-leaf resistance 147
Water potential indexes were measured at four growth stages of wheat, 148
including the seedling stage (30 April 2016 and 12 May 2017), tillering stage (20 149
May 2016 and 27 May 2017), jointing stage (30 May 2016 and 10 June 2017), and 150
flowering stage (15 June 2016 and 27 June 2017). Three Representative plants 151
were randomly selected in per plot, their leaves were removed with a scissors 152
and placed into the leaf sample box. Next, a root and soil sample for the selected 153
layer at the seedling stage, at the 0-10 and 10-30 cm soil layers at tillering and 155
jointing, and 0-10, 10-30, 30-50 cm soil layer at flowering, respectively. Sampled 156
root systems were gently shaken to let rhizosphere soil fall into the soil sample 157
box, then the root system was placed into the root sample box. Leaf water 158
potential, root water potential, and soil water potential were measured 159
immediately after each were sampled using a dew point water potential meter 160
(WP4C Dewpoint PotentiaMeter, METER Group, Pullman, WA, USA) [31, 32]. 161
Transpiration rate and net photosynthetic rate was measured at 9:00 to 162
11:00 on the morning of flowering stage (15 June 2016 and 27 June 2017) of 163
wheat with a portable photosynthesis system (model GFS3000, Heinz Walz 164
GmbH, Effeltrich, Germany). Three wheat plants were randomly selected in 165
each plot, the flag leaves of each plant were measured, and the average value 166
of the three plants was obtained as the transpiration rate and net photosynthetic 167
rate of the plot. Soil-leaf water transfer resistance (Rsl) was calculated using 168
following equation [12]: 169
Rsl =𝛹𝑠 − 𝛹𝑙
CT ⑵
170
where Rsl is the soil-leaf water transfer resistance, Ψs is soil water potential, Ψl 171
is leaf water potential, and CT is also transpiration rate. 172
173
2.3.3. Soil water content, evapotranspiration, and evaporation 174
Soil water content was measured to a depth of 2 m before sowing and after 175
cm soil layers, and using a time domain reflectometry soil moisture sensor 177
(TRIME-PICO IPH/T3, IMKO GmbH, Ettlingen, Germany) for the 10-30, 30-50, 178
50-80, 80-110, 110-140, 140-170, and 170-200 cm soil layers. Evapotranspiration 179
(ET) was calculated using following equation [9]: 180
ET = P + W1− W2 ⑶
181
whereET is evapotranspiration during the growing season, P is precipitation 182
during the growing season, and W1 and W2 are water storage in the 0-200m soil 183
layer before sowing and after harvest, respectively. 184
Soil evaporation was measured with a micro-evaporator made from 185
polyvinylchloride tubing with the length of 150 mm, internal diameter of 110 186
mm, and external diameter of 115 mm [34]. One tube per plot was installed to 187
remove undisturbed soil at 07:00 h, with plastic film used to seal the base of the 188
undisturbed soil. Mass of the soil core was measured using an electronic 189
balance with a sensitivity of 0.01 g. The soil was then placed back in its original 190
location in the field and the soil was measured at 07:00 h on the next day. The 191
loss in mass was the amount of evaporation (equivalent to 0.1051 mm g-1). Soil 192
inside the micro-evaporator was changed every 3 days and after precipitation, 193
tube emptied of soil and placed in a new location in the field, which ensure that 194
soil moisture inside the micro-evaporator is consistent with the surrounding 195
soil. The calculation of evaporation in a growth period is based on the daily 196
average evaporation measured during the growth stage multiplied by the 197
of transpiration during a growing season is the sum of that for all growth 199
periods in the growing season using following equation [35]: 200
T = ET − E ⑷
201
where T is transpiration during growing season, ET is evapotranspiration 202
during growing season, and E is soil evaporationduring growing season. 203
204
2.3.4. Yield and water use efficiency 205
The whole plot was harvested manually using sickles at 5 cm above 206
ground. The edges (0.5 m) of the plot were trimmed and discarded. Biological 207
yield (BY) was measured by natural drying and before threshing. The grain 208
moisture content after threshing was measured by the PM-8188 grain moisture 209
meter, repeated 5 times, and the mean was taken. In addition, grain yield (GY) 210
at 13% water content is calculated. All straw and chaff from stubble 211
incorporated treatments were returned to the original plots immediately after 212
threshing. water use efficiency was calculated using following equations [9]: 213
WUE𝑔 =
𝐺𝑌
𝐸𝑇 ⑸
214
WUE𝑏 =𝐵𝑌
𝐸𝑇 ⑹
215
where WUEg and WUEb are water use efficiency of grain and biomass yield, 216
respectively. 217
218
2.4. Statistical analysis 219
Chicago, USA).Analysis of variance was conducted for all dependent variables. 221
Year and tillage practice were considered fixed effects, and replication was 222
considered a random effect. Differences among means were determined using 223
Tukey’s honestly significant different test. The linear relationship of water 224
potential indexes with transpiration, BY, GY, WUEg, and WUEb were assessed 225
using Pearson’s correlation coefficient. 226
227
3.
Results
228
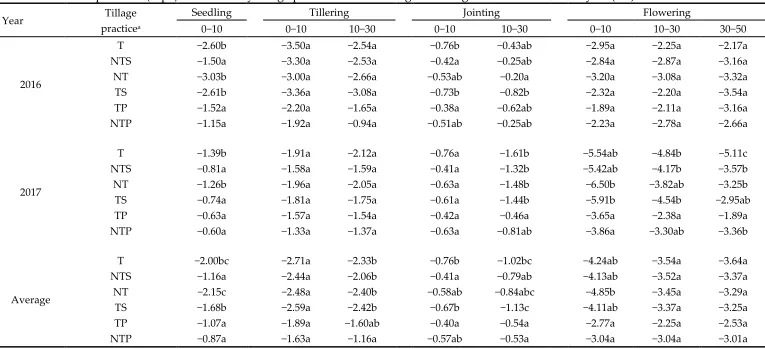
3.1. Effect of tillage practices on water potential at different growth stages 229
Soil water potential varied with year, tillage practice, soil layer, and growth 230
stage of wheat (Table 3). In 2016, soil water potential with NTS and TP were 231
significantly greater in the 0-10 cm soil layer at the seedling and jointing stages 232
compared to T. In 2017, soil water potential with the different treatments had 233
similar pattern to that in 2016. On average, compared with T, soil water 234
potential with NTS was significantly greater in the 0-10 cm soil layer at the 235
seedling and jointing stages. Soil water potential with TP was significantly 236
greater than that with T in the 0-10 cm soil layer at the seedling stage and in the 237
0-10 and 10-30 cm soil layers at jointing stage. Compared to T, soil water 238
potential with NTP was significantly increased in the 0-10 cm soil layer at the 239
seedling stage, in the 10-30 cm soil layer at tillering stage, and in the 10-30 cm 240
soil layer at jointing stage. 241
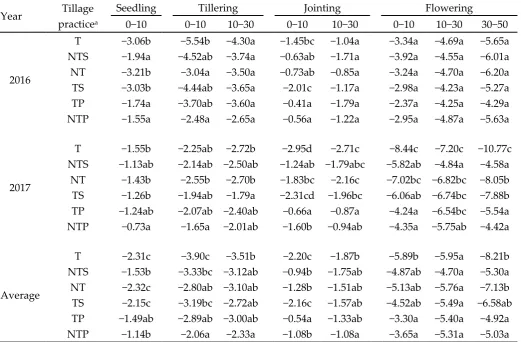
water potential (Table 4). In general, compared to T, root water potential was 243
significantly increased with NTS and NT in the 0-10 cm soil layer at the seedling 244
and jointing stages, and with NTS in the 30-50 cm soil layer at flowering. Root 245
water potential was not significantly different between TS and T in all soil 246
layers at every growth stage. Root water potential with TP was significantly 247
greater than that with T in the 0-10 cm soil layer at the seedling, tillering, and 248
jointing stages, and in the 0-10 and 30-50 cm soil layers at flowering. Root water 249
potential with NTP was significantly greater than that with T in the 0-10 cm soil 250
layer at the seedling stage, in the 0-10 and 10-30 cm soil layers at tillering and 251
jointing, and in the 0-10 and 30-50 cm soil layers at flowering. 252
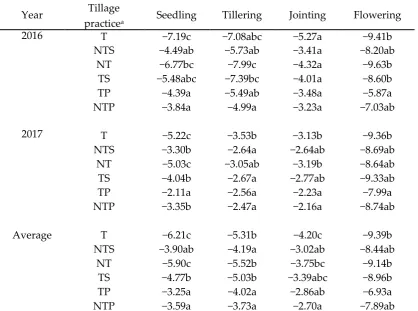
Leaf water potential differed with year, tillage practice, soil layer, and 253
growth stage of wheat (Table 5), In 2016, compared to T, leaf water potential 254
with NTS was significantly increased at the seedling stage, and not significantly 255
different with NT and TS at any growth staged. Leaf water potential in 2016 256
significantly greater with NTP and TP at the seedling stage, and with TP at 257
flowering, compared to T. In 2017, compared to T, leaf water potential with NTS 258
was significantly increased at the seedling and tillering stages; however, leaf 259
water potential with NT was not significantly increased at any growth stage. 260
Leaf water potential was significantly greater with TS than T at the seedling 261
and tillering stages, and with TP than T increased at the seedling, tillering, and 262
jointing stages. On average, leaf water potential with NTS and NTP was 263
stages. Leaf water potential with NT and TP was not significantly different 265
compared to that with T at any growth stage. However, leaf water potential 266
with TS was significantly greater than that with T at the seedling stage. 267
268
3.2. Effect of tillage practices on water potential gradient at different growth 269
stages 270
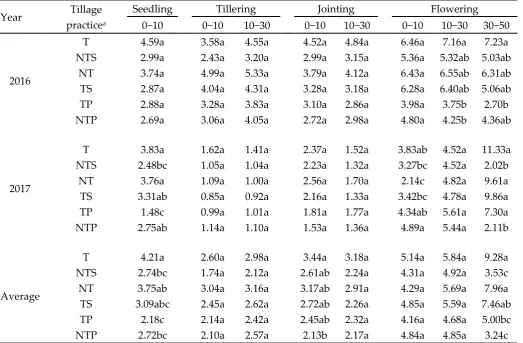
The soil-root water potential gradient was affected by year, tillage practice, 271
soil layer, and growth stage of wheat (Table 6). In 2016, the soil-root water 272
potential gradient was not significantly different among tillage practices at all 273
soil layers at all growth stages. In 2017, the soil-root water potential gradient 274
was significantly reduced with NTS and NTP compared to the other tillage 275
practices in the 0-10 cm soil layer at jointing stage and in the 0-10 and 30-50 cm 276
soil layers at flowering stage. 277
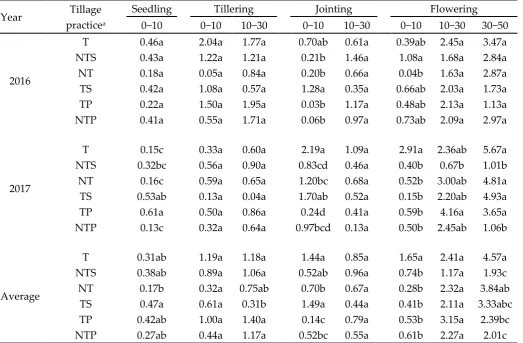
The root-leaf water potential gradient varied with year, tillage practice, soil 278
layer, and growth stage of wheat (Table 7). On average, compared to T, the root-279
leaf water potential gradient with NTS was significantly reduced at the 0-10 cm 280
soil layer at the seedling stage, 10-30 cm soil layer at jointing stage, and 30-50 281
cm soil layer at flowering stage; however, the root-leaf water potential gradient 282
with NT was significantly increased at 0-10 cm soil layer at tillering stage. The 283
root-leaf water potential gradient was significantly decreased with TS at the 0-284
10 cm soil layer at the seedling stage, and with TP at the 0-10 cm soil layer at 285
leaf water potential gradient with NTP was significantly reduced at the 0-10 cm 287
soil layer at the seedling stage and 30-50 cm soil layer at flowering, compared 288
to T. 289
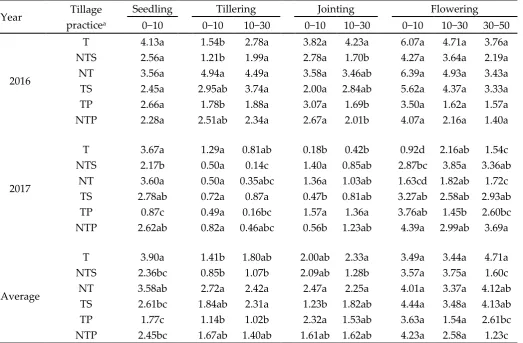
The soil-leaf water potential gradient varied with year, tillage practice, soil 290
layer, and growth stage of wheat (Table 8). On average, the soil-leaf water 291
potential gradient with NTS was significantly less than that with T at the 0-10 292
cm soil layer at the seedling stage and 30-50 cm soil layer at flowering. The soil-293
leaf water potential gradient with NT and TS was not significantly different 294
from that with T at all soil layers and growth stages. Compared to T, the soil-295
leaf water potential gradient was significantly decreased with TP at the 0-10 cm 296
soil layer at the seedling stage and at the 30-50 cm soil layer at flowering, and 297
with NTP at the 0-10 cm soil layer at the seedling and jointing stages and at the 298
30-50 cm soil layer at flowering. 299
300
3.3. Effects of tillage practices on transpiration rate and soil-leaf water 301
transfer resistance at flowering 302
Transpiration rate of wheat at flowering varied with tillage practice (Fig. 303
2). In 2016 and 2017, compared with T, transpiration rate was significantly 304
increased with NTS, TP, and NTP, but not significantly different with NT and 305
TS (Fig. 2A, B). On average, compared with T, NTS, TP, and NTP significantly 306
increased transpiration rate by 103, 143, and 91%, respectively (data not shown). 307
practices (Fig. 2). In 2016 and 2017, compared with T, net photosynthetic rate 309
was significantly increased with NTS, TP, and NTP, but not significantly 310
different with NT and TS (Fig. 2C, D). On average, NTS, TP, and NTP 311
significantly increased net photosynthetic rate by 20, 19, and 19%, respectively, 312
compared to T (data not shown). 313
Soil-leaf water transfer resistance of wheat at flowering was also affected 314
by tillage practice (Fig. 3). In 2016 and 2017, compared to T, soil-leaf water 315
transfer resistance at all soil layers was significantly reduced with NTS, TP, and 316
NTP, but not significantly different with NT and TS (Fig. 3A, B). Averaged 317
across years and soil layers, compared to T, soil-leaf water transfer resistance 318
with NTS, TP, and NTP was significantly decreased by 66, 70, and 63%, 319
respectively (data not shown). 320
321
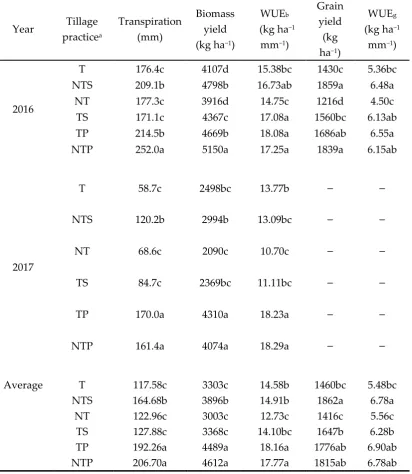
3.4. Effect of tillage practices on yield and water use efficiency 322
Tillage practice significantly affected transpiration at flowering, BY, WUEb, 323
GY, and WUEg (Table 9). In 2016, transpiration with NTS, TP, and NTP was 324
significantly increased by 19, 22 and 43%, respectively, compared to T, and BY 325
with NTS, TS, TP, and NTP was significantly increased by 17, 6, 14, and 25%, 326
respectively. Water use efficiency of BY with TS, TP, and NTP was significantly 327
increased by 11, 18, and 12%, respectively, compared to T. Grain yield with NTS, 328
TP, and NTP was significantly increased by 30, 18, and 29%, respectively, 329
respectively. On average, compared with T, transpiration with NTS, TP, and 331
NTP was significantly increased by 40, 64 and 76%, respectively; however, 332
transpiration was not significantly different with NT and TS. Compared to T, 333
BY was significantly increased with NTS, TP, and NTP by 18, 36, and 40%, 334
respectively; however, it was not significantly different with NT and TS. Water 335
use efficiency of BY was significantly increased with TP and NTP by 25 and 336
22%, respectively, but was not significantly different with NTS and TS, 337
compared to T. Grain yield with NTS, TP, and NTP was significantly increased 338
by 28, 22 and 24%, respectively, compared to T; however, it was not significantly 339
different among NT, TS, and T. Water use efficiency of GY with NTS, TP and 340
NTP was significantly increased by 24, 26, and 24%, respectively, but not 341
significantly different with NT and TS, compared to T. 342
343
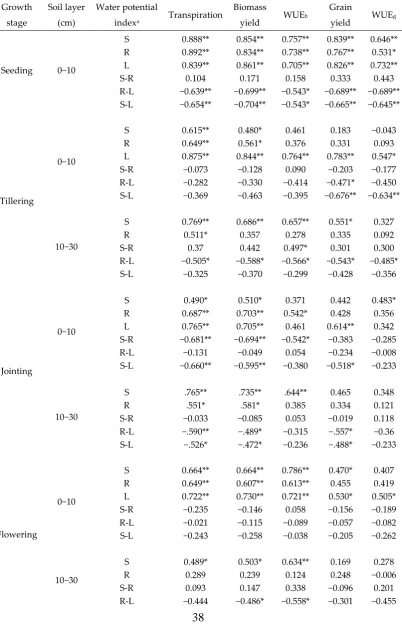
3.5. Correlations of water potential indexes with transpiration, biomass and 344
grain yields, and water use efficiency of grain and biomass yields 345
Significant correlations among water potential indexes, transpiration at 346
growing season, BY, WUEb, GY, and WUEg of wheat were observed (Table10). 347
Soil water potential in the 0-10 cm soil layer at the seedling stage was highly 348
significant and positively associated with transpiration , BY, WUEb, GY, and 349
WUEg. Soil water potential in the 0-10 cm soil layer at tillering was positively 350
associated with transpiration (r = 0.615, P < 0.01) and BY (r = 0.480, P < 0.05). 351
positively associated with transpiration, BY, WUEb, and GY. Soil water potential 353
in the 0-10 cm soil layer at jointing was significantly positively associated with 354
transpiration and BY. Soil water potential in the 10-30 cm soil layer at jointing 355
was significantly positively associated with transpiration, BY, and WUEb. Soil 356
water potential in the 0-10 cm soil layer at flowering was positively associated 357
with transpiration, BY, WUEb, and GY. Soil water potential in the 10-30 cm soil 358
layer at flowering was positively associated with transpiration, BY, and WUEb. 359
Root water potential in the 0-10 cm soil layer at the seedling stage of wheat 360
was significantly positively associated with transpiration, BY, WUEb, GY, and 361
WUEg (Table 10). Root water potential in the 0-10 cm soil layer at tillering was 362
positively associated with transpiration (r = 0.649, P < 0.01) and BY (r = 0.561, P 363
< 0.05). Root water potential in the 10-30 cm soil layer at tillering was positively 364
associated with transpiration (r = 0.511, P < 0.05). Root water potential in the 0-365
10 cm soil layer at jointing was significantly positively associated with 366
transpiration, BY, and WUEb. Root water potential in the 10-30 cm soil layer at 367
jointing was significantly positively associated with transpiration and BY. Root 368
water potential in the 0-10 cm soil layer at flowering exhibited a significant 369
positive associated with transpiration, BY, and WUEb. Root water potential in 370
the 30-50 cm soil layer at flowering was significantly positively associated with 371
transpiration, BY, WUEb, GY, and WUEg. 372
Leaf water potential at the seedling stage of wheat had a significant 373
WUEg (Table 10). Leaf water potential at tillering was significantly positively 375
associated with transpiration, BY, WUEb, GY, and WUEg. Leaf water potential 376
at jointing was significantly and positively associated with transpiration, BY, 377
and GY. Leaf water potential at flowering was positively associated with 378
transpiration, BY, WUEb, GY, and WUEg. 379
The soil-root water potential gradient in the 10-30 cm soil layer at tillering 380
of wheat was significantly positively associated with WUEb (Table 10). The soil-381
root water potential gradient in the 0-10 cm soil layer at jointing had a 382
significant negative correlation with transpiration, BY, and WUEb. The soil-root 383
water potential gradient in the 30-50 cm soil layer at flowering showed a 384
negative correlation with transpiration, BY, WUEb, and GY. 385
The root-leaf water potential gradient at the 0-10 cm soil layer at the 386
seedling stage of wheat had a significant negative correlation with 387
transpiration, BY, WUEb, GY, and WUEg (Table 10). The root-leaf water 388
potential gradient at the 0-10 cm soil layer at tillering was significantly 389
negatively associated with GY. The root-leaf water potential gradient at the 10-390
30 cm soil layer at tillering was significantly negatively associated with 391
transpiration, BY, WUEb, GY, and WUEg.The root-leaf water potential gradient 392
at the 10-30 cm soil layer at jointing exhibited a significant negatively 393
correlation with transpiration, BY, and GY. The root-leaf water potential 394
gradient at the 10-30 cm soil layer at flowering was significantly negatively 395
50 cm soil layer at flowering had a significant negative correlation with 397
transpiration, BY, WUEb, GY, and WUEg. 398
The soil-leaf water potential gradient at the 0-10 cm soil layer at the 399
seedling stage of wheat showed a significant negatively association with 400
transpiration, BY, WUEb, GY, and WUEg. The soil-leaf water potential gradient 401
at the 0-10 cm soil layer at tillering was significantly negatively associated with 402
GY and WUEg. The soil-leaf water potential gradient at the 0-10 cm soil layer at 403
jointing was had a significant negative correlation with transpiration, BY, and 404
GY. The soil-leaf water potential gradient at the 10-30 cm soil layer at jointing 405
was significantly negatively associated with transpiration, BY, and GY. The soil-406
leaf water potential gradient at the 10-30 cm soil layer at flowering exhibited a 407
significantly negative associated with transpiration, BY, and GY. The soil-leaf 408
water potential gradient at the 30-50 cm soil layer at flowering was significantly 409
negatively associated with transpiration, BY, WUEb, GY, and WUEg. 410
411
4.
Discussion
412
4.1. Effects of tillage practices on water potential in the soil-plant system 413
Soil, roots, and leaves are important indicators of whether plants are 414
subject to drought stress [36-38], and have been employed in the selection of 415
appropriate tillage practices. Tillage practices can affect soil, root, and leaf 416
water potential [39, 40]. In this study, NTS significantly increased soil water 417
compared to T because NTS increased topsoil moisture at the seedling stage. 419
However, with wheat growth and development, canopy coverage increased, 420
transpiration dominated evapotranspiration, and the positive effect of straw 421
mulching on topsoil moisture gradually weakened [24, 41], thus NTS did not 422
significantly increase soil water potential at flowering. Conventional tillage and 423
no-till improved soil water potential compared to T in the 0-30 cm soil layers at 424
all growth stages, mainly because plastic film mulching reduced soil 425
evaporation, which lead to greater soil water moisturethroughout the growing 426
season [42]. No-till with straw cover, TP, and NTP increased leaf water potential 427
compared to T at all growth stages, in agreement with results from previous 428
studies [39, 43]. However, Zhang et al [44] found that NTS reduced leaf water 429
potential by 11% compared to T. This discrepancy is likely due to differences in 430
soils and early rainfall prior to measurement. The study reported by Zhang et 431
al. (1999) was conducted on a quaternary red clay soil with high viscosity, and 432
long-term no-till led to subsurface soil compaction and shallow root systems. 433
The present study was conducted on a deep loess soil with deep uniform 434
texture and high water storage capacity [45], which is favorable for the growth 435
and development of crop root systems. 436
Water potential gradients drive water transport from soil to plants, with a 437
greater water potential gradient resulting in faster water absorption[46]. In this 438
study, NTS, TP, and NTP reduced the soil-root water potential gradient in the 439
significantly decreased the root-leaf water potential gradient compared to T at 441
the 0-10 cm soil layer at the seedling stage and 30-50 cm soil layer at flowering. 442
These treatments also significantly reduced the soil-leaf water potential 443
gradient at the 0-10 cm soil layer at the seedling stage and 30-50 cm soil layer 444
at flowering, likely because they stored more water from the fallow period. 445
Moreover, wheat canopy coverage reaches a maximum at flowering, thereby 446
limiting evaporation after this stage. 447
Water transfer resistance exists in the process of water transport from soil 448
to plants [47]. In this study, NTS, TP, and NTP reduced soil-leaf water transfer 449
resistance at flowering of wheat compared to T. This could be due to NTS, TP, 450
and NTP having increased root length and root surface area, and more 451
favorable spatial distribution of roots for water uptake [48]. This was 452
demonstrated in this study, as NTS, TP, and NTP had greater soil water 453
absorption by plants than T. 454
In this study, NTS, TP, and NTP significantly increased transpiration and 455
net photosynthetic rate of wheat at flowering compared to T, as shown in 456
previous studies [49-51]. The net photosynthetic rate of wheat flag leaves has 457
been reported as 24 to 39% higher with NTS compared to conventional tillage, 458
and also have a significantly higher transpiration rate [49, 52]. In contrast, Jiang 459
et al.[53] found that NTS reduced the photosynthetic rate of wheat, likely 460
because their straw cover was applied after sowing, resulting in less soil 461
occurred after harvest, leading to more soil moisture stored during the fallow 463
season, thereby enabling an increase in photosynthetic rate. Transpiration is 464
fundamental to understanding crop water use efficiency [54]. In this study, 465
transpiration with NTS, TP, and NTP was significantly increased compared to 466
T, mainly because NTS, TP, and NTP increased precipitation infiltration and 467
reduced soil evaporation [21, 42, 55]. 468
Biomass yield of wheat was significantly greater with NTS, TP, and NTP 469
compared to T. Garofalo and Rinaldi [56] found that a greater rate of 470
transpiration was associated with greater BY. However,Dam et al. [57] found 471
that long-term BY of maize did not differ between NTS and T. This may be 472
attributable to differences in soil texture at the experimental sites, which was 473
sandy loam in their study and loess in the present study. In agreement with our 474
results, Zhang et al. [58] found that plastic mulching increased BY of maize. 475
This could be due to enhanced crop growth resulting from greater soil 476
temperature [59, 60], soil moisture [58], and radiation capture [61] with plastic 477
mulching. 478
479
4.2.Effects of tillage practices on grain yield and water use efficiency 480
Conservation tillage practices have been shown to increase soil water 481
storage, wheat yield, and WUE on the semiarid Loess Plateau of China [25, 62]. 482
However,Pittelkow et al. [15] found that conservation tillage practices did not 483
conservation tillage on yield varies among climatic zones. The improvement of 485
wheat GY and WUEg with NTS, TP, and NTP compared to T in this study is 486
attributed to increased water potential and decreased water potential gradient 487
and water transfer resistance, thus enhancing transpiration and BY. 488
489
5. Conclusion
490
This study demonstrates that NTS, TP, and NTP significantly increased 491
grain yield and WUEg as a result of increased water potential, decreased water 492
potential gradient and water transfer resistance, and lead to increases in 493
transpiration rate, transpiration, and biomass yield. These results demonstrate 494
that NTS, TP, and NTP are suitable tillage practices for sustainable 495
intensification of wheat production in semi-arid areas. 496
497
Author Contributions:
Conceptualization, Lingling Li; Data curation, 498Zhengkai Peng; Formal analysis, Zhengkai Peng, Linlin Wang and Zhuzhu Luo; 499
Funding acquisition, Lingling Li; Investigation, Linlin Wang; Methodology, 500
Junhong Xie and Zhuzhu Luo; Project administration, Junhong Xie; 501
Supervision, Lingling Li and Renzhi Zhang; Validation, Junhong Xie; Writing – 502
original draft, Zhengkai Peng; Writing – review & editing, Lingling Li, Jeffrey 503
A. Coulter, Renzhi Zhang, Jana Kholova and Sunita Choudhary. 504
505
Foundation of China (31761143004 and 31660373), the Department of Education 507
of Gansu Province (2017C-12), and the Research Program of the Gansu 508
Provincial Key Laboratory of Aridland Crop Science, Gansu Agricultural 509
University (GSCS-2017-4). 510
511
Conflicts of Interest:
The authors declare no conflict of interest. 512References
513
1. Wei T, Dong Z, Zhang C, et al. Effects of rainwater harvesting planting combined with
514
deficiency irrigation on soil water use efficiency and winter wheat (Triticum aestivum L.)
515
yield in a semiarid area [J]. Field Crops Research, 2018, 218, 231-242.
516
2. Li F M, Wang J, Xu J Z, et al. Productivity and soil response to plastic film mulching
517
durations for spring wheat on entisols in the semiarid Loess Plateau of China [J]. Soil &
518
Tillage Research, 2004, 78(1): 9-20.
519
3. Wu J, Miao C, Tang X, et al. A nonparametric standardized runoff index for characterizing
520
hydrological drought on the Loess Plateau, China [J]. Global and planetary change, 2018,
521
161, 53-65.
522
4. Zhang S, Sadras V, Chen X, et al. Water use efficiency of dryland wheat in the Loess Plateau
523
in response to soil and crop management [J]. Field Crops Research, 2013, 151(9): 9-18.
524
5. Deng X P, Lun S, Zhang H, et al. Improving agricultural water use efficiency in arid and
525
semiarid areas of China [J]. Agricultural Water Management, 2006, 80(1): 23-40.
526
6. Huang Y, Chen L, Bojie F U, et al. The wheat yields and water-use efficiency in the Loess
527
Plateau: straw mulch and irrigation effects [J]. Agricultural Water Management, 2005,
528
72(3): 209-222.
529
7. Wang Y, Xie Z, Malhi S S, et al. Effects of rainfall harvesting and mulching technologies on
530
water use efficiency and crop yield in the semi-arid Loess Plateau, China [J]. Agricultural
531
Water Management, 2009, 96(3): 374-382.
532
8. Yeboah S, Zhang R, Cai L, et al. Greenhouse gas emissions in a spring wheat–field pea
533
sequence under different tillage practices in semi-arid Northwest China [J]. Nutrient
534
Cycling in Agroecosystems, 2016, 106(1): 77-91.
535
9. Wang L, Palta J A, Wei C, et al. Nitrogen fertilization improved water-use efficiency of
536
winter wheat through increasing water use during vegetative rather than grain filling [J].
537
Agricultural Water Management, 2018, 197, 41-53.
538
10. Unkovich M, Baldock J, Farquharson R. Field measurements of bare soil evaporation and
539
crop transpiration, and transpiration efficiency, for rainfed grain crops in Australia–A
540
review [J]. Agricultural water management, 2018, 205, 72-80.
541
11. Fu A, Chen Y, Li W, et al. Research advances on plant water potential under drought and
542
salt stress [J]. Journal of Desert Research, 2005, 25(05): 744-749.
12. Kang S. Distribution of hydraulic resistance and water potential in soil-plant-atmosphere
544
continuum [J]. Journal of Hydraulic Engineering, 1990.
545
13. Yang X G, Liu H L, Hu-Ning Y U. The changing of water transfer potential in
soil-plant-546
atmosphere continuum system of maize field [J]. Chinese Journal of Eco-Agriculture, 2003,
547
11(1): 27-29.
548
14. Kalapos T. Leaf water potential-leaf water deficit relationship for ten species of a semiarid
549
grassland community [J]. Plant & Soil, 1994, 160(1): 105-112.
550
15. Pittelkow C M, Liang X Q, Linquist B A, et al. Productivity limits and potentials of the
551
principles of conservation agriculture [J]. Nature, 2015, 517(7534): 365.
552
16. Young D L, Schillinger W F. Wheat farmers adopt the undercutter fallow method to reduce
553
wind erosion and sustain profitability [J]. Soil & Tillage Research, 2012, 124(4): 240-244.
554
17. Tan C, Cao X, Yuan S, et al. Effects of Long-term Conservation Tillage on Soil Nutrients in
555
Sloping Fields in Regions Characterized by Water and Wind Erosion [J]. Scientific Reports,
556
2015, 5, 17592.
557
18. Wu J, Cai L Q, Luo Z Z, et al. Effects of conservation tillage on soil physical properties of
558
rainfed field of the Loess Plateau in Central of Gansu [J]. Journal of Soil & Water
559
Conservation, 2014, 28(2): 112-117.
560
19. Peng Z K, Li L L, Xie J H, et al. Effects of conservational tillage on water characteristics in
561
dryland farm of central Gansu,Northwest China [J]. Chinese Journal of Applied Ecology,
562
2018, 29(12): 4022-4028.
563
20. Bescansa P, Imaz M J, Virto I, et al. Soil water retention as affected by tillage and residue
564
management in semiarid Spain [J]. Soil & Tillage Research, 2006, 87(1): 19-27.
565
21. Cai L Q, Luo Z Z, Zhang R Z, et al. Effect of Different Tillage Methods on Soil Water
566
Retention and Infiltration Capability of Rainfed Field [J]. Journal of Desert Research, 2012,
567
32(5): 1362-1368.
568
22. Shao Y, Xie Y, Wang C, et al. Effects of different soil conservation tillage approaches on soil
569
nutrients, water use and wheat-maize yield in rainfed dry-land regions of North China [J].
570
European Journal of Agronomy, 2016, 81, 37-45.
571
23. Brunel N, Seguel O, Acevedo E. Conservation tillage and water availability for wheat in
572
the dryland of central Chile [J]. Journal of Soil Science & Plant Nutrition, 2013, 13(3):
622-573
637.
574
24. Li L L, Huang G B, Zhang R Z, et al. Effects of no-till with stubble retention on soil water
575
regimes in rainfed areas [J]. Journal of Soil and Water Conservation, 2005, 19(05): 96-8+118.
576
25. Su Z, Zhang J, Wu W, et al. Effects of conservation tillage practices on winter wheat
water-577
use efficiency and crop yield on the Loess Plateau, China [J]. Agricultural Water
578
Management, 2007, 87(3): 307-314.
579
26. Yin W, Yu A Z, Chai Q, et al. Wheat and maize relay-planting with straw covering increases
580
water use efficiency up to 46% [J]. Agronomy for Sustainable Development, 2015, 35(2):
581
815-825.
582
27. Tao Z, Li C, Li J, et al. Tillage and straw mulching impacts on grain yield and water use
583
efficiency of spring maize in Northern Huang–Huai–Hai Valley [J]. The Crop Journal, 2015,
584
3(5): 445-450.
585
28. Gong Z. Chinese soil taxonomy [M]. Science press, 2001.
586
29. FAO. Soil map of the world: revised legend. World Soil Resources Report 60. Food and
Agriculture Organization of the United Nations, Rome. [J]. 1990.
588
30. Zhu X, LI Y, Peng X, et al. Soils of the loess region in China [J]. Geoderma, 1983, 29(3):
237-589
255.
590
31. Gubiani P I, Reichert J M, Campbell C, et al. Assessing errors and accuracy in dew-point
591
potentiometer and pressure plate extractor meaurements [J]. Soil Science Society of
592
America Journal, 2013, 77(1): 19-24.
593
32. Luo T, Wu J. Analysis of The Moisture Transmission Resistance of Corn and the
594
Distribution Characteristics of Stomatal Morphological Index of Leaves under Drip
595
Irrigation [J]. Water saving irrigation, 2018, 8, 19-29.
596
33. O’Kelly B C. Accurate determination of moisture content of organic soils using the oven
597
drying method [J]. Drying Technology, 2004, 22(7): 1767-1776.
598
34. Plauborg F. Evaporation from bare soil in a temperate humid climate—measurement
599
using micro-lysimeters and time domain reflectometry [J]. Agricultural & Forest
600
Meteorology, 1995, 76(1): 1-17.
601
35. Eberbach P, Humphreys E, Kukal S. The effect of rice straw mulch on evapotranspiration,
602
transpiration and soil evaporation of irrigated wheat in Punjab, India [J]. Agricultural
603
Water Management, 2011, 98(12): 1847-1855.
604
36. Bittelli M. Measuring soil water potential for water management in agriculture: a review
605
[J]. Sustainability, 2010, 2(5): 1226-1251.
606
37. Tinus R W. Root growth potential as an indicator of drought stress history [J]. Tree
607
Physiology, 1996, 16(9): 795-799.
608
38. AL-Darby A M, Lowery B, Daniel T C. Corn leaf water potential and water use efficiency
609
under three conservation tillage systems [J]. Soil & Tillage Research, 1987, 9(3): 241-254.
610
39. Zhang M, Zhang R Z, Cai L Q. Leaf water potential of spring wheat and field pea under
611
different tillage patterns and its relationships with environmental factors [J]. Chinese
612
Journal of Applied Ecology, 2008, 19(7): 1467-1474.
613
40. Salem H M, Valero C, Muñoz M Á , et al. Short-term effects of four tillage practices on soil
614
physical properties, soil water potential, and maize yield [J]. Geoderma, 2015, 237-238(s
615
237–238): 60-70.
616
41. Zhu W, Wang J. Surface Mulching and Conservation of Soil Water [J]. Research of Soil &
617
Water Conservation, 1996, 3(3): 141-145.
618
42. Peng Z K, Li L L, Xie J H, et al. Effects of different tillage practices on water consumption
619
structure and water use efficiency during crop growth period in arid farmland [J]. Journal
620
of Soil and Water Conservation 2018, 32(05): 214-221.
621
43. Wang K P, Zhang R Z, Dong B, et al. Effect of long-term conservation tillage on soil water
622
regimes and leaf water potential of crops in rainfed areas of the Loess Plateau [J]. Acta
623
Ecologica Sinica, 2014, 34(13): 3752-3761.
624
44. Zhang B, Zhang T L, Zhao Q G. Relationship between water potentials of red soiland crop
625
leaves under five farming systems andtheir responses to drought stress in dry season [J].
626
Acta Pedologica Sinica, 1999, 36(1): 101-110.
627
45. Li L L, Huang G B, Zhang R Z, et al. Effects of conservation tillage on soil water regimes
628
in rainfed areas [J]. Acta Ecologica Sinica, 2005, 25(09): 2326-2332.
629
46. Li Q, Chen Y, Liu M, et al. Water potential characteristics and yield of summer maize in
630
different planting patterns [J]. Plant Soil and Environment, 2008, 54(1): 14-19.
47. Liu C M. Study on interface processes of water cycle in soil-plant-atmosphere continuum
632
[J]. Acta Geographica Sinica, 1997, 4, 366-373.
633
48. Zhang M J, Li L L, Xie J H, et al. Effects of tillage practices on root spatial distribution and
634
yield of spring wheat and pea in the dry land farming areas of central Gansu,China [J].
635
Chinese Journal of Applied Ecology, 2017, 28(12): 3917-3925.
636
49. Wang J B, Yan C R, Liu E K, et al. Effects of long-term no-tillage with straw mulch on
637
photosynthetic characteristics of flag leaues and dry matter accumulation and
638
translocation of winter wheat in dryland [J]. Journal of Plant Nutrition & Fertilizer, 2015,
639
21(2): 296-305.
640
50. Hou X, Jia Z, Han Q, et al. Effects of rotational tillage practices on soil water characteristics
641
and crop yields in semi-arid areas of north-west China [J]. Soil Research, 2011, 49(7):
625-642
632.
643
51. Wang J, Lin Q, Ni Y J, et al. Effect of conservation tillage on photosynthetic characteristics
644
and yield of winter wheat in dry land [J]. Journal of Triticeae Crops, 2009, 480-483.
645
52. Liu N, Yang W X. Photosynthetic Rate and Water Utilization of Rainfed Wheat with Plastic
646
Mulching on the Semiarid Loess Plateau, China [J]. Proceedings of the National Academy
647
of Sciences, India Section B: Biological Sciences, 2018, 1-10.
648
53. Jiang X, Yun W, Hou L, et al. Effects of minimum tillage and no-tillage systems on
649
photosynthetic characteristics at late growth stages of winter wheat [J]. Transactions of the
650
Chinese Society of Agricultural Engineering, 2006, 22(5): 66-69.
651
54. Unkovich M, Baldock J, Farquharson R. Field measurements of bare soil evaporation and
652
crop transpiration, and transpiration efficiency, for rainfed grain crops in Australia – A
653
review [J]. Agricultural Water Management, 2018, 205, 72-80.
654
55. Wang X J, Huang G B, Li Q P, et al. Characteristics of the evapotranspiration and its yield
655
performance of rainfed spring wheat and peas fileds [J]. journal of Arid Land Resources
656
and Environment 2010, 24(05): 172-177.
657
56. Garofalo P, Rinaldi M. Water-use efficiency of irrigated biomass sorghum in a
658
Mediterranean environment [J]. Spanish Journal of Agricultural Research, 2013, 11(4):
659
1153-1169.
660
57. Dam R F, Mehdi B B, Burgess M S E, et al. Soil bulk density and crop yield under eleven
661
consecutive years of corn with different tillage and residue practices in a sandy loam soil
662
in central Canada [J]. Soil & Tillage Research, 2005, 84(1): 41-53.
663
58. Zhang S, Li P, Yang X, et al. Effects of tillage and plastic mulch on soil water, growth and
664
yield of spring-sown maize [J]. Soil and Tillage Research, 2011, 112(1): 92-97.
665
59. Anikwe M A N, Mbah C N, Ezeaku P I, et al. Tillage and plastic mulch effects on soil
666
properties and growth and yield of cocoyam (Colocasia esculenta) on an ultisol in
667
southeastern Nigeria [J]. Soil & Tillage Research, 2007, 93(2): 264-272.
668
60. Li X Y, Gong J D, Gao Q Z, et al. Incorporation of ridge and furrow method of rainfall
669
harvesting with mulching for crop production under semiarid conditions [J]. Agricultural
670
Water Management, 2001, 50(3): 173-183.
671
61. Liu Y, Yang S, Li S, et al. Growth and development of maize ( Zea mays L.) in response to
672
different field water management practices: Resource capture and use efficiency [J].
673
Agricultural & Forest Meteorology, 2010, 150(4): 606-613.
674
62. Jin H, Wang Q, Li H, et al. Effect of alternative tillage and residue cover on yield and water
use efficiency in annual double cropping system in North China Plain [J]. Soil & Tillage
676
Research, 2009, 104(1): 198-205.
677
678
679
Table 1. Soil physical and water characteristics in 2001. 680
Soil layer (cm) Bulk density (g cm−3)
Upper limit of soil drainage (cm3 cm−3)
Lower limit of effective moisture in wheat
(cm3 cm−3)
0−5 1.29 0.27 0.09
5−10 1.23 0.27 0.09
10−30 1.32 0.27 0.09
30−50 1.20 0.27 0.09
50−80 1.14 0.26 0.09
80−110 1.14 0.27 0.11
110−140 1.13 0.26 0.11
140−170 1.12 0.26 0.12
170−200 1.11 0.26 0.13
Table 2. Annual, fallow period, and growing season rainfall, drought index (DI), and soil water condition for 2016, 2017, and the
2001−2015 average.a
Year Annual rainfall (mm)
DI for annual rainfall
Annual soil water conditionb
Fallow period rainfall
DI for fallow period
rainfall
Fallow period soil water condition
Growing season rainfall (mm)
DI for growing
season rainfall
Growing season soil water condition
2016 300.2 −1.29 Dry 60.8 −2.25 Dry 239.4 0.85 Wet
2017 361.4 −0.47 Dry 175.4 −0.35 Normal 186.0 −0.31 Normal
Average
(2001−2015) 396.7 − − 196.5 − − 200.2 − −
a Annual (January through December), fallow period (January through March and August through December), and growing season (April
through July)
practicea 0−10 0−10 10−30 0−10 10−30 0−10 10−30 30−50
2016
T −2.60b −3.50a −2.54a −0.76b −0.43ab −2.95a −2.25a −2.17a
NTS −1.50a −3.30a −2.53a −0.42a −0.25ab −2.84a −2.87a −3.16a
NT −3.03b −3.00a −2.66a −0.53ab −0.20a −3.20a −3.08a −3.32a
TS −2.61b −3.36a −3.08a −0.73b −0.82b −2.32a −2.20a −3.54a
TP −1.52a −2.20a −1.65a −0.38a −0.62ab −1.89a −2.11a −3.16a
NTP −1.15a −1.92a −0.94a −0.51ab −0.25ab −2.23a −2.78a −2.66a
2017
T −1.39b −1.91a −2.12a −0.76a −1.61b −5.54ab −4.84b −5.11c
NTS −0.81a −1.58a −1.59a −0.41a −1.32b −5.42ab −4.17b −3.57b
NT −1.26b −1.96a −2.05a −0.63a −1.48b −6.50b −3.82ab −3.25b
TS −0.74a −1.81a −1.75a −0.61a −1.44b −5.91b −4.54b −2.95ab
TP −0.63a −1.57a −1.54a −0.42a −0.46a −3.65a −2.38a −1.89a
NTP −0.60a −1.33a −1.37a −0.63a −0.81ab −3.86a −3.30ab −3.36b
Average
T −2.00bc −2.71a −2.33b −0.76b −1.02bc −4.24ab −3.54a −3.64a
NTS −1.16a −2.44a −2.06b −0.41a −0.79ab −4.13ab −3.52a −3.37a
NT −2.15c −2.48a −2.40b −0.58ab −0.84abc −4.85b −3.45a −3.29a
TS −1.68b −2.59a −2.42b −0.67b −1.13c −4.11ab −3.37a −3.25a
TP −1.07a −1.89a −1.60ab −0.40a −0.54a −2.77a −2.25a −2.53a
NTP −0.87a −1.63a −1.16a −0.57ab −0.53a −3.04a −3.04a −3.01a
Within a column for a given year, means followed by different letters are significantly different (P ≤ 0.05).
a T, conventional tillage with no straw; NTS, no-till with straw cover; NT, no-till with no straw; TS, conventional tillage with straw incorporated; TP, conventional
Year Tillage practicea
Seedling Tillering Jointing Flowering
0−10 0−10 10−30 0−10 10−30 0−10 10−30 30−50
2016
T −3.06b −5.54b −4.30a −1.45bc −1.04a −3.34a −4.69a −5.65a NTS −1.94a −4.52ab −3.74a −0.63ab −1.71a −3.92a −4.55a −6.01a NT −3.21b −3.04a −3.50a −0.73ab −0.85a −3.24a −4.70a −6.20a TS −3.03b −4.44ab −3.65a −2.01c −1.17a −2.98a −4.23a −5.27a TP −1.74a −3.70ab −3.60a −0.41a −1.79a −2.37a −4.25a −4.29a NTP −1.55a −2.48a −2.65a −0.56a −1.22a −2.95a −4.87a −5.63a
2017
T −1.55b −2.25ab −2.72b −2.95d −2.71c −8.44c −7.20c −10.77c NTS −1.13ab −2.14ab −2.50ab −1.24ab −1.79abc −5.82ab −4.84a −4.58a
NT −1.43b −2.55b −2.70b −1.83bc −2.16c −7.02bc −6.82bc −8.05b TS −1.26b −1.94ab −1.79a −2.31cd −1.96bc −6.06ab −6.74bc −7.88b TP −1.24ab −2.07ab −2.40ab −0.66a −0.87a −4.24a −6.54bc −5.54a NTP −0.73a −1.65a −2.01ab −1.60b −0.94ab −4.35a −5.75ab −4.42a
Average
T −2.31c −3.90c −3.51b −2.20c −1.87b −5.89b −5.95a −8.21b NTS −1.53b −3.33bc −3.12ab −0.94b −1.75ab −4.87ab −4.70a −5.30a NT −2.32c −2.80ab −3.10ab −1.28b −1.51ab −5.13ab −5.76a −7.13b TS −2.15c −3.19bc −2.72ab −2.16c −1.57ab −4.52ab −5.49a −6.58ab TP −1.49ab −2.89ab −3.00ab −0.54a −1.33ab −3.30a −5.40a −4.92a NTP −1.14b −2.06a −2.33a −1.08b −1.08a −3.65a −5.31a −5.03a
Within a column for a given year, means followed by different letters are significantly different (P ≤ 0.05).
a T, conventional tillage with no straw; NTS, no-till with straw cover; NT, no-till with no straw; TS,
conventional tillage with straw incorporated; TP, conventional tillage with plastic mulch; NTP, no-till with
Table 5. Leaf water potential (Mpa) as affected by tillage practice for different growth stages of wheat in 2016 and 2017.
Year Tillage
practicea Seedling Tillering Jointing Flowering
2016 T −7.19c −7.08abc −5.27a −9.41b
NTS −4.49ab −5.73ab −3.41a −8.20ab NT −6.77bc −7.99c −4.32a −9.63b
TS −5.48abc −7.39bc −4.01a −8.60b TP −4.39a −5.49ab −3.48a −5.87a NTP −3.84a −4.99a −3.23a −7.03ab
2017 T −5.22c −3.53b −3.13b −9.36b
NTS −3.30b −2.64a −2.64ab −8.69ab NT −5.03c −3.05ab −3.19b −8.64ab TS −4.04b −2.67a −2.77ab −9.33ab TP −2.11a −2.56a −2.23a −7.99a NTP −3.35b −2.47a −2.16a −8.74ab
Average T −6.21c −5.31b −4.20c −9.39b
NTS −3.90ab −4.19a −3.02ab −8.44ab NT −5.90c −5.52b −3.75bc −9.14b
TS −4.77b −5.03b −3.39abc −8.96b TP −3.25a −4.02a −2.86ab −6.93a NTP −3.59a −3.73a −2.70a −7.89ab
Within a column for a given year, means followed by different letters are significantly
different (P ≤ 0.05).
a T, conventional tillage with no straw; NTS, no-till with straw cover; NT, no-till with
no straw; TS, conventional tillage with straw incorporated; TP, conventional tillage
Year Tillage practicea
Seedling Tillering Jointing Flowering 0−10 0−10 10−30 0−10 10−30 0−10 10−30 30−50
2016
T 0.46a 2.04a 1.77a 0.70ab 0.61a 0.39ab 2.45a 3.47a NTS 0.43a 1.22a 1.21a 0.21b 1.46a 1.08a 1.68a 2.84a NT 0.18a 0.05a 0.84a 0.20b 0.66a 0.04b 1.63a 2.87a TS 0.42a 1.08a 0.57a 1.28a 0.35a 0.66ab 2.03a 1.73a TP 0.22a 1.50a 1.95a 0.03b 1.17a 0.48ab 2.13a 1.13a NTP 0.41a 0.55a 1.71a 0.06b 0.97a 0.73ab 2.09a 2.97a
2017
T 0.15c 0.33a 0.60a 2.19a 1.09a 2.91a 2.36ab 5.67a NTS 0.32bc 0.56a 0.90a 0.83cd 0.46a 0.40b 0.67b 1.01b NT 0.16c 0.59a 0.65a 1.20bc 0.68a 0.52b 3.00ab 4.81a TS 0.53ab 0.13a 0.04a 1.70ab 0.52a 0.15b 2.20ab 4.93a TP 0.61a 0.50a 0.86a 0.24d 0.41a 0.59b 4.16a 3.65a NTP 0.13c 0.32a 0.64a 0.97bcd 0.13a 0.50b 2.45ab 1.06b
Average
T 0.31ab 1.19a 1.18a 1.44a 0.85a 1.65a 2.41a 4.57a NTS 0.38ab 0.89a 1.06a 0.52ab 0.96a 0.74b 1.17a 1.93c NT 0.17b 0.32a 0.75ab 0.70b 0.67a 0.28b 2.32a 3.84ab
TS 0.47a 0.61a 0.31b 1.49a 0.44a 0.41b 2.11a 3.33abc TP 0.42ab 1.00a 1.40a 0.14c 0.79a 0.53b 3.15a 2.39bc NTP 0.27ab 0.44a 1.17a 0.52bc 0.55a 0.61b 2.27a 2.01c
Within a column for a given year, means followed by different letters are significantly different (P ≤ 0.05).
a T, conventional tillage with no straw; NTS, no-till with straw cover; NT, no-till with no straw; TS,
conventional tillage with straw incorporated; TP, conventional tillage with plastic mulch; NTP, no-till with
Year Tillage practicea
Seedling Tillering Jointing Flowering 0−10 0−10 10−30 0−10 10−30 0−10 10−30 30−50
2016
T 4.13a 1.54b 2.78a 3.82a 4.23a 6.07a 4.71a 3.76a NTS 2.56a 1.21b 1.99a 2.78a 1.70b 4.27a 3.64a 2.19a NT 3.56a 4.94a 4.49a 3.58a 3.46ab 6.39a 4.93a 3.43a TS 2.45a 2.95ab 3.74a 2.00a 2.84ab 5.62a 4.37a 3.33a TP 2.66a 1.78b 1.88a 3.07a 1.69b 3.50a 1.62a 1.57a NTP 2.28a 2.51ab 2.34a 2.67a 2.01b 4.07a 2.16a 1.40a
2017
T 3.67a 1.29a 0.81ab 0.18b 0.42b 0.92d 2.16ab 1.54c NTS 2.17b 0.50a 0.14c 1.40a 0.85ab 2.87bc 3.85a 3.36ab
NT 3.60a 0.50a 0.35abc 1.36a 1.03ab 1.63cd 1.82ab 1.72c TS 2.78ab 0.72a 0.87a 0.47b 0.81ab 3.27ab 2.58ab 2.93ab TP 0.87c 0.49a 0.16bc 1.57a 1.36a 3.76ab 1.45b 2.60bc NTP 2.62ab 0.82a 0.46abc 0.56b 1.23ab 4.39a 2.99ab 3.69a
Average
T 3.90a 1.41b 1.80ab 2.00ab 2.33a 3.49a 3.44a 4.71a NTS 2.36bc 0.85b 1.07b 2.09ab 1.28b 3.57a 3.75a 1.60c NT 3.58ab 2.72a 2.42a 2.47a 2.25a 4.01a 3.37a 4.12ab
TS 2.61bc 1.84ab 2.31a 1.23b 1.82ab 4.44a 3.48a 4.13ab TP 1.77c 1.14b 1.02b 2.32a 1.53ab 3.63a 1.54a 2.61bc NTP 2.45bc 1.67ab 1.40ab 1.61ab 1.62ab 4.23a 2.58a 1.23c
Within a column for a given year, means followed by different letters are significantly different (P ≤ 0.05).
a T, conventional tillage with no straw; NTS, no-till with straw cover; NT, no-till with no straw; TS,
conventional tillage with straw incorporated; TP, conventional tillage with plastic mulch; NTP, no-till with
Year Tillage practicea
Seedling Tillering Jointing Flowering 0−10 0−10 10−30 0−10 10−30 0−10 10−30 30−50
2016
T 4.59a 3.58a 4.55a 4.52a 4.84a 6.46a 7.16a 7.23a NTS 2.99a 2.43a 3.20a 2.99a 3.15a 5.36a 5.32ab 5.03ab
NT 3.74a 4.99a 5.33a 3.79a 4.12a 6.43a 6.55ab 6.31ab TS 2.87a 4.04a 4.31a 3.28a 3.18a 6.28a 6.40ab 5.06ab TP 2.88a 3.28a 3.83a 3.10a 2.86a 3.98a 3.75b 2.70b NTP 2.69a 3.06a 4.05a 2.72a 2.98a 4.80a 4.25b 4.36ab
2017
T 3.83a 1.62a 1.41a 2.37a 1.52a 3.83ab 4.52a 11.33a NTS 2.48bc 1.05a 1.04a 2.23a 1.32a 3.27bc 4.52a 2.02b
NT 3.76a 1.09a 1.00a 2.56a 1.70a 2.14c 4.82a 9.61a TS 3.31ab 0.85a 0.92a 2.16a 1.33a 3.42bc 4.78a 9.86a TP 1.48c 0.99a 1.01a 1.81a 1.77a 4.34ab 5.61a 7.30a NTP 2.75ab 1.14a 1.10a 1.53a 1.36a 4.89a 5.44a 2.11b
Average
T 4.21a 2.60a 2.98a 3.44a 3.18a 5.14a 5.84a 9.28a NTS 2.74bc 1.74a 2.12a 2.61ab 2.24a 4.31a 4.92a 3.53c NT 3.75ab 3.04a 3.16a 3.17ab 2.91a 4.29a 5.69a 7.96a TS 3.09abc 2.45a 2.62a 2.72ab 2.26a 4.85a 5.59a 7.46ab TP 2.18c 2.14a 2.42a 2.45ab 2.32a 4.16a 4.68a 5.00bc NTP 2.72bc 2.10a 2.57a 2.13b 2.17a 4.84a 4.85a 3.24c
Within a column for a given year, means followed by different letters are significantly different (P ≤ 0.05).
a T, conventional tillage with no straw; NTS, no-till with straw cover; NT, no-till with no straw; TS,
conventional tillage with straw incorporated; TP, conventional tillage with plastic mulch; NTP, no-till with
Table 9. Transpiration at the growing season, biomass and grain yields, and water use efficiency of grain yield and biomass yield (WUEb and WUEg, respectively) of wheat as affected by tillage practice in 2016 and 2017.
Year Tillage practicea
Transpiration (mm)
Biomass yield (kg ha−1)
WUEb
(kg ha−1
mm−1)
Grain yield
(kg ha−1)
WUEg
(kg ha−1
mm−1)
2016
T 176.4c 4107d 15.38bc 1430c 5.36bc NTS 209.1b 4798b 16.73ab 1859a 6.48a
NT 177.3c 3916d 14.75c 1216d 4.50c TS 171.1c 4367c 17.08a 1560bc 6.13ab TP 214.5b 4669b 18.08a 1686ab 6.55a NTP 252.0a 5150a 17.25a 1839a 6.15ab
2017
T 58.7c 2498bc 13.77b − −
NTS 120.2b 2994b 13.09bc − −
NT 68.6c 2090c 10.70c − −
TS 84.7c 2369bc 11.11bc − −
TP 170.0a 4310a 18.23a − −
NTP 161.4a 4074a 18.29a − −
Average T 117.58c 3303c 14.58b 1460bc 5.48bc NTS 164.68b 3896b 14.91b 1862a 6.78a
NT 122.96c 3003c 12.73c 1416c 5.56c TS 127.88c 3368c 14.10bc 1647b 6.28b TP 192.26a 4489a 18.16a 1776ab 6.90ab NTP 206.70a 4612a 17.77a 1815ab 6.78ab
Within a column for a given year, means followed by different letters are significantly
different (P ≤ 0.05).
a T, conventional tillage with no straw; NTS, no-till with straw cover; NT, no-till with
no straw; TS, conventional tillage with straw incorporated; TP, conventional tillage