Article
1
Structural Equation Model for Investigating the
2
Causal Relationships between Project Complexities
3
and Project Cost: An Empirical Study from New
4
Zealand
5
Linlin Zhao 1*, and Huirong Zhang 1
6
1 College of Architecture and Civil Engineering, Beijing University of Technology, Beijing 100124, China;
7
[email protected] (L.Z.); [email protected] (H.Z.)
8
Abstract: Project complexity is usually considered as one of main causes of cost overruns, resulting
9
in poor performance and thus project failure. However, empirical studies focused on evaluating its
10
effects on project cost remain lacking. Given this circumstance, this study attempts to develop the
11
relationships between project cost and the multidimensional project complexity elements. We
12
establish complexity as a multidimensional factor including the task, organization, market, legal,
13
and environment complexities. This study uses an empirical evidence-based structural model to
14
account for the relationships between project cost and project complexity. By doing so, a
15
quantitative assessment of multi-dimensional project complexity has been developed. The findings
16
suggest that task and organization complexities have direct effects on project cost, while market,
17
legal and external environment complexities have indirect effects on project cost. The practical
18
contribution is that the findings can improve the understanding of which dimension of complexity
19
significantly influence project cost, and the need to focus efforts on strategically addressing that
20
complexities.
21
Keywords: project cost; project complexity; structural equation modeling; New Zealand
22
23
1. Introduction
24
Construction projects are undertaken in an uncertain and dynamic environment, which presents
25
a raft of challenges for all the stakeholders involved. These challenges are associated with uncertainty
26
and complexity in construction projects [1, 2]. Project complexity impacts the modelling and
27
management of projects and the objectives of cost, time, quality and safety [3-5]. It is usually
28
considered as one of main causes of cost overruns, resulting in poor performance and thus project
29
failure [4]. Construction projects are constantly exposed to a variety of complexities and uncertainties
30
from project inception to completion. These complexities stem from many sources, such as task,
31
organization, and environment, imposing significant upward pressure on the project’s cost. It is not
32
uncommon for construction enterprises to suffer massive losses due to ineffective management or
33
unidentified complexities. Identification of potential effects of complexities on project cost improves
34
performance of project management. Therefore, the impacts on cost of various project complexities
35
should be explored.
36
Project complexities are abstract and difficult to measure, which is multidimensional. There is a
37
need to define project complexity, identify the factors that can represent project complexity. Based
38
on the suggestion of [6], project complexity can be described by a system of several interdependent
39
factors. Assessing the effects of project complexity on project cost can provide reference for industry
40
professionals. However, few studies about project complexity have been conducted [7-9].
41
Additionally, no previous studies provides a structural model for quantitively evaluating the effects
42
of project complexity on project cost. Therefore, this study tends to develop a systematic model for
43
evaluating the effects of project complexity on project cost, using structural equation modelling
44
(SEM). SEM can examine the relationships between the measurement indicators and latent
45
constructs; and investigate the relationships between latent constructs [10]. A valid model that
46
describes the relations between project complexity and project cost is developed by considering New
47
Zealand’s construction industry. Therefore, the resulting model can be seen as country specific.
48
This study is organized as follows. Section 2 reviews the definition of project complexity,
49
categorizes project complexity attributes (elements), and forms the hypotheses. Section 3 presents the
50
data collection and analysis methods. Section 4 illustrates the structural model development and
51
hypotheses testing. Section 5 presents model validation. The results are discussed in Section 6. Section
52
7 presents the conclusion.
53
2. Literature review and hypotheses formation
54
2.1. Project complexity and attributes
55
A variety of definitions of project complexity have been proposed in the existing literature. There
56
is no uniform definition on what complexity really is, in a project context [11-13]. It is difficult to
57
capture the whole concept with a single definition. In fact, there is still no consensus on the definition
58
of project complexity [14-17]. Many previous studies have made efforts to define project complexity.
59
In [18], complexity is seen as the sum of the factors: the differentiation of functions in a project
60
between clients, consultants, and contractors, or the differentiation of an organization’s structure; the
61
dependencies between systems, and the process of decision making. In [19], the study examined the
62
number of influencing factors and their interrelationships as elements of complexity. In [20],
63
complexity was considered as the interdependencies among the product, process, and the difficulties
64
of project objectives. Project complexity can be defined as the number and heterogeneity of different
65
elements that are interdependent [7].
66
Although the definitions have slightly different views on project complexity, the consensus
67
seems to be that project complexity is inherent, associated with the multi-dimensions of a project and
68
is strongly related to the project management and objectives [21]. Moreover, “project complexity,” as
69
used by industry practitioners, usually refers to the challenges associated with project management
70
and the difficulties related to delivering the desired project objectives [22]. These challenges, in turn,
71
link to project tasks, stakeholders’ expectations, and a multitude of dimensions related to the projects.
72
The uncertainty and unpredictability induced by the combined effects of such factors pose a variety
73
of challenges for successful project management [23, 24]. Experience suggested that the
74
interdependencies among the project components and project context are more complicated. A model
75
may be produced as a set of interrelated or interacting factors. Hence, in this study, the complexity
76
elements are grouped into categories to formulate a model through which we can consider the project
77
complexity as a whole, and which work collaboratively to impact the project performance.
78
[25] suggested that project complexity requires a more structured method of project
79
management. Prior to any examination, it is important to first identify the attributes or elements of
80
project complexity. To define project complexity, it is necessary to identity the attributes that can
81
represent complexity. These attributes include project type, project location, project size, project team
82
expertise and experience, market conditions, and political issues [26]. In [27], the study suggested
83
that complexity can be defined in different aspects, such as task, organization and environment
84
complexities. In [28], the study pointed out the attributes of project complexity including project size,
85
project interrelationships, and factors of context. Additionally, this study categorized project
86
complexity by providing a project complexity model called ALOE. [11] suggested that project
87
complexity consists of dynamic, uncertainty and structural complexity. In [29], the study discusses
88
project complexity as being comprised of project type, project size, construction method, and external
89
environment. In [30], the study summarized a list of project complexity attributes, consisting of
90
dispute resolution process, project scope, political issues, market conditions, environment issues, and
91
types of financing.
2.2. Categories of the project complexity attributes and hypotheses setting
93
[31] asserted that clustering dimensions of project complexity represents an appropriate way to
94
appraise it. Moreover, [32] concluded that complexity in construction projects has a
multi-95
dimensional nature, supporting the need for developing a comprehensive framework to capture
96
project complexity. Furthermore, several previous studies have categorized project complexity. For
97
example, in [26], the study grouped project complexity into two categories such as stakeholder
98
management and legal complexity. In [33], project complexity was grouped into six categories,
99
including inherent complexity, uncertainty, technological complexity, rigidity of sequence, overlap
100
of phases or concurrency, and organization complexity. In [34], this study developed a framework
101
for characterizing project complexity, which grouped project complexity into three groups:
102
technology, organization and environmental complexity In [35], the study developed a HoPC (house
103
of project complexity) model that classified project complexity into three groups: performance,
104
technical complexity, and organization complexity.
105
As addressed in [36], categorization of complexity attributes is regarded to be highly subjective.
106
Refinement of the correct measurement indicators to accurately represent the latent constructs is a
107
complex task. A framework consists of 19 attributes, which were categorized into five groups: task,
108
organization, market, legal, and environment complexities. This was formulated based on a
109
comprehensive literature review and experts’ opinions. While the definition of project cost could
110
differ from one organization to another, the most reliable and reasonable project cost definition lies
111
in three dimensions: capital construction cost, associated capital cost, and client-related cost [37]. A
112
comprehensive list of attributes or elements that clearly represents the corresponding complexity
113
was developed, as shown in Table 1. The proposed hypotheses are presented in Table 2.
114
2.2.1 Task complexity
115
Task dimension can broadly relate to the physical, structural composition of the project, as well
116
as certain aspects of its operating environment, depending on the defined boundaries of the project.
117
Task complexity has been widely cited as a critical dimension of project complexity. Task complexity
118
indicates that project complexity originates from the inherent nature of the project tasks, such as
119
complicatedness, scope ambiguity, site location, and technological risks [34, 38-40]. The increasing
120
requirements of construction products and the trend of increasing applications of innovative
121
technology also increase task complexity [41, 42]. Four attributes of task complexity were included
122
in this study: project buildability, the inherent uncertainty in scope, site accessibility, and new
123
technology. Based on previous studies, the following hypothesis can be formulated.
124
H1: Task complexity can significantly impact project cost
125
2.2.2 Organization complexity
126
Project development includes a variety of parties, organizational structures and procedures.
127
Consequently, organizational complexity can also represent a dimension of project complexity [43].
128
Increasing attention is being paid to the fundamentals of organizational complexity, namely
129
organizational hierarchy structure, administration, technical abilities, and experiences of the working
130
staff [32, 34, 44, 45]. Moreover, [46, 47] also emphasized the importance of the management of
131
material, labor, and suppliers. The study describes a system through which the project planning and
132
controlling strategies, resource market, competition advantage (technologies and relationships) and
133
expertise or experience of project professionals are combined in the project alliance organization [48].
134
Based on an extensive literature review, four attributes are identified as the principal elements of
135
organizational complexity: resource management, technological and leading ability, experience and
136
collaboration of stakeholders, and planning and controlling. Accordingly, the following hypothesis
137
can be generated.
138
H2: Organization complexity can significantly impact project cost
2.2.3 Market complexity
141
Exogenous factors are defined as the activities that are unavoidable and beyond the control of
142
an organization [49]. Market condition is one of the major exogenous factors. According to [50], for
143
sustainable development, companies should appropriately manage factors they can control, as well
144
as take into account the factors beyond their control. Indeed, project cost performance is heavily
145
affected by market-based factors [51-53]. Moreover, as [51] stated, market uncertainties are an
146
inherent part of the market-based factor. These uncertainties can be caused by government policies,
147
macro-economic conditions, and social effects. Furthermore, [54] suggested that project performance
148
are closely related to their capability of coping with the competition. Additionally, working capital
149
and adequate liquidity are of importance for construction projects. They are vital to enable start up
150
and to support day-to-day construction activities [55]. More projects have failed due to lack of a
151
capital source than from a shortage of technical capability. Also, market complexity can translate into
152
financial impacts on the construction project [56]. The following hypothesis can be proposed.
153
H3: Market complexity can significantly impact project cost.
154
2.2.4 Legal complexity
155
According to [57], legal issues involve legal system effectiveness, the legal framework, judiciary
156
independence, property rights, and intellectual property rights. Legal complexity should not be
157
overlooked when managing the project cost, because it can cause dynamic changes in the project
158
environment, resulting in significant impacts on the construction project. [58] suggested that legal
159
complexity might be induced by contractual conditions such as flawed contractual clauses, improper
160
contractual documents, and inappropriate contract type. Moreover, [56] concluded that unfamiliarity
161
with the administrative procedures and local legal systems causes inefficient and complicated project
162
management, as construction companies are subject to the approval of project development permits.
163
Consequently, administrative procedures, applicable regulations, influences from local councils, and
164
contract conditions were identified as the elements of legal complexity. Thus, the following
165
hypotheses can be proposed.
166
H4: Legal complexity can significantly impact project cost
167
2.2.5 External environment complexity
168
A modern project operating in an increasingly turbulent environment presents unique
169
challenges for the project system, and pressure on project cost [59]. Based on the work of [60], the
170
term “environment” in management does not necessarily represent physical surroundings; it can also
171
be seen as a separate entity representing all the influences that surround and affect business
172
organizations. In recognition of the importance of the environment complexity, previous studies and
173
research have highlighted the relationship between environmental influences and project cost
174
management [59, 61]. In this study, variables describing aspects of environment complexity include
175
factors such as weather conditions, unforeseen nature disasters, and differences in
176
social/culture/language [31, 47, 62, 63]. Based on the existing literature review, the following
177
hypothesis can be proposed.
178
H5: External environment complexity can significantly impact project cost
179
2.3 Indirect relationships
180
The reason why we hypothesized the indirect effect of market complexity on project cost is that
181
market conditions and legal systems create a variety of potential internal and external influences.
182
They can impose either direct or indirect effects on project cost. For example, they can directly
183
increase resources prices to increase project cost. Also, they can indirectly increase financing costs
184
and thereby increase the cost, or they can extend the permit approval process to extend the time and
185
increase project cost. A vast number of factors that are beyond the control of the project team,
186
imposed by the market conditions and legal system can contribute toward project overspending.
187
Accordingly, we proposed that:
H6: Mediated by task complexity, market complexity has a significantly indirect effect on project
189
cost.
190
H7: Mediated by organization complexity, market complexity has a significantly indirect effect
191
on project cost
192
H8: Mediated by task complexity, legal complexity has a significantly indirect effect on project
193
cost
194
H9: Mediated by organization complexity, legal complexity has a significantly indirect effect on
195
project cost
196
Furthermore, as construction projects are usually conducted in this dynamic environment, a
197
multitude of factors can impact the project cost through task complexity and organization
198
complexity. Similarly, the external environment complexity can impose indirect effects on project
199
costs, through market complexity or legal complexity. Market conditions may be impacted by the
200
external environment influence, the level depending on the market structure and size. For example,
201
unexpected natural disasters and political instability may significantly influence the market
202
conditions.
203
H10: Mediated by task complexity, external environment complexity has a significantly indirect
204
effect on project cost
205
H11: Mediated by organization complexity, external environment complexity has a significantly
206
indirect effect on project cost
207
H12: Mediated by market complexity, external environment complexity has a significant indirect
208
effect on project cost
209
H13: Mediated by organization complexity, external environment complexity has a significantly
210
indirect effect on project cost
211
H14: Mediated by market complexity and task complexity, external environment complexity has
212
a significant indirect effect on project cost
213
H15: Mediated by market complexity and organization complexity, external environment
214
complexity has a significant indirect effect on project cost
215
H16: Mediated by legal complexity and task complexity, external environment complexity has
216
a significant indirect effect on project cost
217
H17: Mediated by legal complexity and organization complexity, external environment
218
complexity has a significant indirect effect on project cost
219
2.4 Gaps in existing literature
220
A deeper understanding of project complexity can help industry professionals navigate the
221
challenges brought about by project complexity. Some literature suggests that an understanding of
222
the sources and effects of such complexity can help professionals to select appropriate and efficient
223
management strategies and processes [28, 64]. However, the studies reflecting the current
224
understanding of project complexity and its effects on project cost management are few. In this study,
225
the project complexity attributes are explored, categorized and investigated. The identified project
226
complexity attributes were categorized into five groups based on comprehensive literature review
227
and experts’ opinion. Moreover, the five-group project complexity are built into a structural model
228
to examine their holistic effects on project cost.
Table 1. Latent constructs and corresponding measurement indicators
239
Constructs Factors Sources
Task Complexity (TCL)
Buildability (TCL1) [28, 31, 65]
Uncertainties in scope (TCL2) [31, 66]
Site location (TCL3) [67, 68]
Novel technologies (TCL4) [20, 69]
Organization Complexity (OCL)
Resources management (OCL1) [31, 46, 47]
Technological & leadership abilities (OCL2) [28, 31] Experience & collaboration of stakeholders (OCL3) [31, 44, 45] Planning & controlling (OCL4) [44, 46, 70] Market Complexity
(MCL)
Market uncertainties (MCL1) [62, 71]
Competition level (MCL2) [28]
Economic & financial dynamics (MCL3) [31, 47, 72]
Market structure (MCL4) [49]
Legal Complexity (LCL)
Administrative procedures (LCL1) [26, 73]
Applicable regulations (LCL2) [31, 73]
Influence from local councils (LCL3) [26, 74, 75]
Contract conditions (LCL4) [31, 46, 68]
External Environment Complexity (EEC)
Weather conditions (ECL1) [62, 66]
Unforeseen natural disasters (ECL2) [31, 63]
Differences in social/cultural/language (ECL3) [46, 47] Project cost
(PC)
Capital construction cost (PC1)
[37] Associated capital cost (PC2)
Client-related cost (PC3)
240
241
Table 2. Hypothetical relationship of the study
242
Latent Constructs Code Hypothetical relationship External Environment
Complexity EEC
EEC→ PC; EEC→ TCL→ PC; EEC → OCL→ PC; EEC→ MCL → PC; EEC→ LCL→ PC
Legal Complexity LCL LCL→ PC; LCL→ TCL→ PC; LCL → OCL→ PC Market Complexity MCL MCL→ PC; MCL→TCL→ PC; MCL→ OCL→ PC Organization Complexity OCL OCL→ PC
Task Complexity TCL TCL→ PC
Project Cost PC Goal of the model
243
3. Research Methodology
244
The research method includes three principal parts. The first part includes a literature survey
245
and a pilot survey to identify 19 project complexity elements, and then a questionnaire survey that
246
was designed based on the identified project complexity elements. Next, the questionnaire with
247
covering letter was distributed online to contractors and project managers who are registered
248
members of the New Zealand Institute of Building (NZIOB). The third part is data analysis, including
249
model development and assessment.
250
3.1 Data collection method—questionnaire survey
251
Before undertaking the survey, a pilot survey was carried out among 15 experts who have
252
extensive experience in the construction industry. The research objectives, scope, and the questions
253
were clearly illustrated to the 15 participants, in order to validate the indicators and constructs. Based
on the experts’ feedback, the questionnaire was refined and reworded in order to improve its clarity.
255
Ethics notification was obtained from the University Human Ethics Committee before distribution of
256
the survey.
257
A questionnaire was used to collect data from contractors and project managers in the
258
construction industry of New Zealand. The questionnaire includes four main sections. The first
259
section is a covering letter including the research aim and objectives and the Human Ethics
260
Notification. In section two, the participants were requested to rank the importance of the
261
components of project cost on a five-point Likert Scale where 1 represents unlikely important, 2
262
represents slightly important, 3 represents neutral, 4 represents important, and 5 represents fairly
263
important. The Likert scale was first introduced by Rensis Likert in 1932 [76]. A Likert-scale is a
264
measurement tool that can be used to gauge values, attitudes, and opinions, to assign a quantitative
265
value to qualitative data [77]. A Likert-scale is typically used in a questionnaire-based survey in order
266
to require participants to indicate the extent to which they agree or disagree with a set of statements
267
[78]. Section three required the participants to provide background information, such as profession,
268
position, and experience. The last section was a request form that could be used by participants to
269
request a copy of the research findings. A total of 489 surveys were distributed across New Zealand
270
in an effort to obtain a representative sample of the population. The final count of useable
271
questionnaires was 136, including general contractors and project managers. Contractors made up 43
272
percent of the participants and project managers the other 57 percent. A summary of the respondents’
273
professional information is shown in Table 3.
274
Table 3. The respondents’ profiles
275
Profession Percent Experience Percent Organization Percent
Contractor 36.2 10-15 13.9 Property Development 18.5
Project Manager 42.7 16-25 30.2 Consultancy 32.1
Construction Manager 19.3 >25 53.6 Construction 47.3
Other 1.80 Others 2.30 Other 2.10
3.2 Data analysis method- Structural equation modelling
276
Since structural equation modelling (SEM) has the capability of coping with latent variables, it
277
has been widely used as a statistical analysis method in the social sciences [79]. The development of
278
SEM is usually considered as second-generation multivariate analysis, which can be used in empirical
279
validation in many research fields [80]. It has been widely acknowledged that structural equation
280
modelling can perform measurement and structural analysis through factor analysis and path
281
analysis [81-84]. Structural equation modelling (SEM) can 1) handle both observed and latent
282
variables, 2) represent latent variables by using observed variables and 3) estimate causal
283
relationships between variables—either the relationship between latent and observed variables or
284
latent variables and latent variables [80, 85]. Additionally, SEM can provide a vivid graph model of
285
the proposed relationships by using the variables. As explained above, latent variables are difficult
286
to observe and measure. Several observed variables can represent one latent variable [86].
287
A structural equation model is often comprised of a measurement model, which examines the
288
relationships between the measurement indicators and latent constructs; and a structural model,
289
which tests the relationships between latent constructs [10]. The measurement model includes several
290
latent variables and their corresponding observed variables. The structural model consists of all the
291
latent variables and their relationships. For model development purposes, structural equation
292
modelling (SEM) can be used to examine the hypothesis related to the latent variables and explore
293
the causal relationships between the latent variables. In structural equation modelling, rectangles
294
indicate observed variables, while ellipses denote latent variables, circles indicate errors and arrows
295
denote the direction of effects. The newly-developed computer program AMOS, developed by [87],
296
has made it much easier to carry out SEM analysis. The application of structural equation modelling
297
(SEM) in construction studies is relatively new [88]. SEM can help to deepen the understanding of
298
the studied phenomenon.
4. Data Analysis
300
4.1. Proposed structural model
301
For the purpose of the study, Table 1 shows latent constructs (project cost, five- dimension of
302
project complexity), their corresponding measurement indicators and variable abbreviations. There
303
were six latent constructs and 22 measurement indicators. The goal variable was project cost (PC).
304
The three basic measurement indicators of project cost are construction capital cost (PC1), associated
305
capital cost (PC2), and client-related cost (PC3). The project complexity constructs consist of: 1) task
306
complexity (TCL) with four indicators such as buildability (TCL1), uncertainties in scope (TCL2), site
307
location (TCL3), and novel technologies (TCL4); 2) organization complexity (OCL) with four
308
indicators such as resources management (OCL1), technological and leadership abilities (OCL2),
309
experience and collaboration of stakeholders (OCL3), and planning and controlling (OCL4); 3)
310
market complexity (MCL) with four indicators such as market uncertainties (MCL1), competition
311
level (MCL2), economic & financial dynamics (MCL3), and market structure (MCL4); 4) legal
312
complexity (LCL) with four indicators such as administrative procedures (LCL1), applicable
313
regulations (LCL2), influence from local councils (LCL3), and contract conditions (LCL4); 5) external
314
environment complexity (EEC) with three indicators such as weather conditions (EEC1), unforeseen
315
natural disasters (EEC2), and differences in social/cultural/language (EEC3).
316
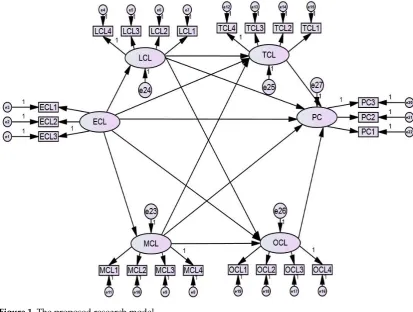
Based on the dimension of project complexity and hypotheses setting, the proposed research
317
model is shown in Figure 1. The e1 to e22 indicate the measurement error of observed variables, while
318
e23 to e27 represent the residual error of latent constructs. The proposed research model was used to
319
examine the relationships between measurement indicators and corresponding latent constructs, and
320
among latent constructs. The selection of the best-fit model was carried out based on various criteria
321
recommended by [89].
322
323
Figure 1. The proposed research model
324
4.2. Measurement model
325
Several iterations of competing models and individual model refinement were carried out until
326
the best-fit model was identified for the dataset. Using the proposed research model in Figure 1, the
collected data were fed into an SPSS program prepared for data imported to AMOS. The analysis
328
results for the measurement indicators and latent constructs are shown in Table 4. Moreover, the
329
internal consistency of the measurement indicators was checked by Cronbach’s alpha test. For this
330
test, a threshold value of 0.7 is used to indicate an acceptable level [90]. The results are also shown in
331
Table 4. Considering the measurement indicators in Table 4, the computed p value at a 0.001 level
332
indicated that significant relationships existed between all the measurement indicators and their
333
corresponding latent constructs. This suggests that regression coefficients for the 22 measurement
334
indicators in the predication of six latent constructs are significantly different from zero at the 0.001
335
level (two-tailed). Moreover, all the factor loadings of the 22 measurement indicators exceed the
336
threshold value of 0.5, indicating they are acceptable. Therefore, none of them were dropped from
337
the model.
338
The overall fit of the research model was assessed by GOF measures. The goodness-of-fit indices
339
were computed using the SEM results from the AMOS analysis. The GOF indices used in this study
340
included a chi-square ratio test (X2/df), the goodness of fit (GOF), adjusted goodness of fit (AGFI),
341
normed fit index (NFI), comparative fit index (CFI), Tucker- Lewis (TLI) and root mean square error
342
of approximation (RMSEA). The results are shown in Table 6. It could be observed that they are all
343
higher than the acceptable levels cited in the existing literature [91].
344
Table 4. Measurement model results
345
Measurement Indicators Estimate SE p-value Cronbach’s
alpha
Complicatedness (TCL1) 0.956 0.175 ***
0.719
Uncertainties in scope (TCL2) 1.065 0.182 ***
Site location (TCL3) 0.991 0.167 ***
Resources management (OCL1) 0.964 0.085 ***
0.818 Technological/Leading ability (OCL2) 1.005 0.085 ***
Experience & Collaboration of stakeholders
(OCL3) 1.007 0.087 ***
Market uncertainties (MCL1) 0.986 0.053 ***
0.907
Competition (MCL2) 0.985 0.053 ***
Economic & Financial dynamics (MCL3) 0.976 0.057 *** Administrative procedures (LCL1) 0.976 0.059 ***
0.894
Applicable regulations (LCL2) 0.959 0.059 ***
Influence from local councils (LCL3) 0.970 0.059 ***
Weather condition (EEC1) 1.010 0.066 ***
0.858 Unexpected natural disasters (EEC2) 1.001 0.062 ***
Capital construction cost (PC1) 0.927 0.100 ***
0.756
Associated capital cost (PC2) 1.032 0.120 ***
Notes: SE=standard error; *** =significant at 0.001 level
4.3. Hypothesis Testing
346
Having examined the adequacy of the model, it was necessary to test hypothetical relationships
347
presented in the initial model. The results are shown in Table 5. According to [92], the critical ratio
348
(CR) value above 1.96 at p<0.05 indicates that the hypothesis cannot be rejected at a high level of
349
confidence. The final model results show that task complexity (TCL) has the strongest direct effect on
350
project cost (PC), having the CR value of 3.488 that is greater than 1.96. Then, the hypothesis (H1)
351
TCL→PC is supported. Besides this effect, organizational complexity (OCL) directly affects the
352
project cost (PC) with almost the same significance, with the CR value of 3.299. Hence, the hypothesis
353
(H2) OCL→PC is supported. On the basis of existing literature, the hypothesis (H3) MCL→PC was
354
set to show that market complexity directly affects project cost, but the CR value 0.4 is too small to be
355
significant. Hence, the hypothesis (H3) is not supported. The same is observed for the hypothesis
356
(H4) MCL→PC, having a CR value of 0.221. This suggested that the hypothesis (H4) is not supported.
As for the hypothesis (H5) EEC→PC with the CR value of 0.645, the data analysis does not support
358
it.
359
In order to examine the indirect relationship, a new estimated should be generated. If the
360
product of the path coefficients between complexity factor and project cost is greater than 0.3, the
361
project complexity has a significantly indirect effect on project cost. For example, the path coefficient
362
between market complexity (MCL) and organization complexity is 0.734, and the path coefficient
363
between organization complexity (OCL) and project cost (PC) is 0680, then the indirect effect between
364
MCL and PC is 0.499 (=0.734*0.68). As 0.466 is greater than 0.3, MCL has a significantly indirect effect
365
on project cost. Then the hypothesis (H7) MCL→ OCL→ PC is supported by the analysis results. But
366
the hypothesis (H6) MCL→ TCL→ PC with estimate 0.068 that is less than 0.3, is not supported.
367
Moreover, the product of path coefficient between legal complexity (LCL) and task complexity (TCL)
368
and the path coefficient between TCL and PC, is greater than 0.3, then the hypothesis (H8) LCL→
369
TCL→ PC is supported. Similarly, the hypothesis (H9) LCL→ OCL→ PC is supported with the
370
estimate 0.466. However, the estimate (0.117) of hypothesis (H10) EEC→ TCL→ PC, the estimate
371
(0.150) of hypothesis (H11) EEC→ OCL→ PC, the estimate (0.084) of hypothesis (H12) EEC→ MCL
372
→ PC, the estimate (0.035) of hypothesis (H13) EEC→ LCL→ PC, the estimate (0.074) of hypothesis
373
(H14) EEC→ MCL→ TCL→ PC, are less than 0.3, then the hypotheses are not supported. In
374
addition, the hypothesis (H15) EEC→ MCL→ OCL→ PC, the hypothesis (H16) EEC→ LCL→ TCL
375
→ PC, the hypothesis (H17) EEC→ LCL→ OCL→ PC, are supported with estimates 0.542, 0.323,
376
and 0.494, respectively.
377
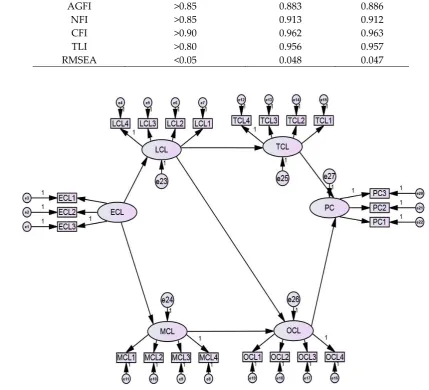
Of 17 hypothetical relationships among the dimensions of project complexity, eight are shown
378
to be significant. In order to obtain the best-fit model, the insignificant relationships among the latent
379
constructs were removed from the model. The final model is shown in Figure 2, the GOF measures
380
of the final model are presented in Table 6.
381
Table 5. Structural model results
382
Hypotheses Path link Estimate SE CR p-value Significant
H1 TCL→ PC 0.993 0.285 3.488 *** Yes
H2 OCL→ PC 0.680 0.206 3.299 *** Yes
H3 MCL→ PC 0.077 0.192 0.400 0.689 No
H4 LCL→ PC 0.033 0.149 0.221 0.825 No
H5 EEC→ PC 0.304 0.472 0.645 0.519 No
H6 MCL→ TCL→ PC 0.068 No
H7 MCL→ OCL→ PC 0.499 Yes
H8 LCL→ TCL→ PC 0.304 Yes
H9 LCL→ OCL→ PC 0.466 Yes
H10 EEC→ TCL→ PC 0.117 No
H11 EEC→ OCL→ PC 0.150 No
H12 EEC→ MCL→ PC 0.084 No
H13 EEC→ LCL→ PC 0.035 No
H14 EEC→ MCL→ TCL→ PC 0.074 No
H15 EEC→ MCL→ OCL→ PC 0.542 Yes
H16 EEC→ LCL→ TCL→ PC 0.323 Yes
H17 EEC→ LCL→ OCL→ PC 0.494 Yes
MCL→ TCL 0.068 0.463 0.147 0.987
MCL→ OCL 0.734 0.243 3.019 0.003**
LCL→ TCL 0.306 0.119 2.568 0.010**
LCL→ OCL 0.686 0.274 2.502 0.012**
EEC→ MCL 1.086 0.075 14.48 ***
EEC→ LCL 1.061 0.080 13.25 ***
EEC→ TCL 0.118 0.127 1.486 0.137
Notes: SE=standard error; ***=significant at 0.001 level; **=significant at 0.05level Estimate>0.3 indicates significant indirect relationship
383
Table 6. GOF measures
384
GOF indices Recommended values Proposed model Final model
X2/df 1.00-2.00 1.687 1.662
GFI >0.90 0.910 0.909
AGFI >0.85 0.883 0.886
NFI >0.85 0.913 0.912
CFI >0.90 0.962 0.963
TLI >0.80 0.956 0.957
RMSEA <0.05 0.048 0.047
385
386
387
Figure 2. Final research model
388
4.4. Assessment of Multivariate Normality
389
As one of the main assumptions in SEM for generating unbiased estimates, multivariate
390
normality should be examined by using multivariate kurtosis in AMOS. The multivariate kurtosis
391
value and related critical value were computed in AMOS. Based on the recommendation by [93], the
392
critical value of multivariate kurtosis greater or equal to 5 suggests a departure from multivariate
393
normality. In this application, the critical value of 80.704 was far greater than the criterion value; thus,
394
multivariate non-normality exists in the sample. Then the boot-strapping procedure in AMOS was
395
introduced to test the appropriateness of the model, without assuming multivariate normality. The
396
model requested 500 bootstrap samples from AMOS. In this study, analysis results explored that
397
model fit in 277 of the 500 samples, indicating 277/500=0.555. The value of 0.555 is the obtained
p-398
value of overall model fit, which is greater than significance p-value of 0.05. Hence, the hypothesis
399
that the research model is correct, is supported. And the model fits the data well.
5. Model Validation
401
In order to obtain a qualified model to support the decision-making model, validation plays an
402
important role in the model development process. Although the internal reliability and validity of
403
the model have been examined by the SEM procedure, the real-world feedback from the industry
404
professionals was considered. The participation of the industry professionals was valuable and
405
appreciated. A total of 27 surveys were received and proved useful. Overall, four participants
406
suggested minor modifications to the best fit model, while the other 23 participants accepted the
407
causal structure of the model. The external feedback helped to identify the model accepted by the
408
industry. Then, the model was slightly adjusted for applicability in the real world.
409
The top tier in the model involves the more tangible aspects of construction, such as labor,
410
material and project properties, which have direct effects on project costs. This aspect is also
411
supported by the participants, whose suggested modifications did not include any changes in this
412
aspect. That being said, some professionals suggested moving regulatory complexity to the top tier
413
in the model. Based on the feedback and ranking provided, the model can properly describe the
414
relationships between the project complexities and project cost. Task complexity and organization
415
complexity are the top concerns in regard to uncertainties and potential for wide variation.
416
6. Results Discussion
417
A structural research model was set up to assess the effects of project complexity on project cost.
418
Model fit and reliability and validity test results were found to be satisfactory. In this model, project
419
complexity was represented by five-dimensional factors: task complexity, organizational complexity,
420
legal complexity, market complexity, and environment complexity. The results indicate task
421
complexity (TCL) and organization complexity (OCL) can significantly impact the project cost. While
422
the market complexity (MCL) has a significantly indirect effect on project cost (PC) mediated by
423
organization complexity (OCL). Similarly, legal complexity (LCL) has a significantly indirect effect
424
on project cost (PC) mediated by task complexity (TCL) and organization complexity, respectively
425
(OCL). Moreover, the external environment complexity (EEC) has a significantly indirect effect on
426
project mediated by market complexity (MCL) and organization complexity (OCL). While the
427
external environment complexity (EEC) has a significantly indirect effect on project cost (PC)
428
mediated by legal complexity (LCL) and task complexity (TCL). Also, the external environment
429
complexity (EEC) has a significantly indirect effect on project cost (PC) mediated by legal complexity
430
(LCL) and organization complexity (OCL).
431
6.1 Direct Effects
432
Task complexity includes buildability, uncertainty in scope, site location, and novel technology.
433
Buildability typically relates to the project delivery process. To incorporate construction experience
434
into the design phase, the associated benefits can be realized during project execution. Uncertainties
435
in project scope can be due to several reasons including change orders, inspection issues, and
436
ineffective communication among involved parties. Changes in scope may delay the project process
437
and frustrate the project team, resulting in project cost overruns. These findings are supported by
438
previous studies [67, 94, 95]. It is well acknowledged that new technologies can improve project
439
productivity, which enhances project cost performance. However, successful application of new
440
technologies require regulatory encouragement, strong capabilities of the project team, and adequate
441
industrial structure [96, 97].
442
Analysis results indicate that organization complexity has significant effects on building project
443
costs in New Zealand. Organization complexity includes resource management, technological and
444
leadership abilities, experience and collaboration of stakeholders, and planning and control. Based
445
on the findings of [98], complexity may impose negative effects on project management performance.
446
A project team with capabilities such as expertise, experience, and effective communication may help
447
keep the project on track. The findings of this study suggest that knowledge and required experience
448
are important to stakeholders and the project team. Continue professional development and training
is required for project professionals to better understand the project context and innovative
450
technologies. Moreover, the organization should financially support construction research programs
451
to advance construction knowledge and technology.
452
Moreover, resources in the New Zealand construction industry include financial resources,
453
materials and equipment, and human resources. Sometimes, although a contractor has been awarded
454
a contract, the contractor may face challenges with obtaining the resources that are required to
455
execute the project. This hinders the process of the project, which leads to project cost overruns. Even
456
if the project manager has effectively planned the project prior to its execution, external influences
457
that are beyond the control of the project team can still impose negative effects on the project. This
458
finding agrees with previous studies [99-101] and implies that it is important for New Zealand
459
contractors to have reliable suppliers of resources. Project planning and control play a key role in
460
project goal setting, risk management, and procurement management [102], the importance of which
461
is obvious. Improper planning and control can lead to late completion [103]. Effective planning and
462
control is the backbone of any project. Even if sufficient resources are provided, weak planning and
463
control still lead to project failure and loss of money [104].
464
6.2 Indirect Effects
465
As shown in the Table 5, 12 total indirect relationships were developed, six of which are
466
statistically significant. Thus, the combined effect of market complexity, legal complexity, and
467
external environment complexity indirectly or partially impacts the project cost. The total indirect
468
effects indicate the aggregated mediating relationships in the model. Market complexity, although
469
not explicitly intangible, is a concern that is out of a project manager’s control, as it relies considerably
470
on other economic and industry influences. Similarly, the regulatory complexity is intangible for the
471
industry professionals, in the sense that they are heavily influenced by the local statutory and
472
regulatory regime. The results showed that these second-tier project complexities are important to
473
the completion of construction projects and are essential to the interrelationship between a project’s
474
complexities. The findings of this study supported by [105, 106], which found that exogenous factors,
475
such as market conditions and legal regimes, modify the structure and form of an organization.
476
[107] suggested that market conditions have the power to affect project cost, through the
477
stakeholders’ perceptions and objectives, market power and structure. Moreover, [108, 109] found
478
that the attributes of organizational complexity, such as resource management and planning and
479
controlling, are mainly dependent on the market structure. Additionally, [110, 111] stated that
480
elements in organizational complexity, namely technological/ leading ability and resource
481
management, are strongly related to the market competitive forces that determine the bargaining
482
power of suppliers and the opportunities or threats of new entrants and existing enterprises.
483
Regulatory policies have a significant impact on the project delivery process and project
484
productivity. Stringent regulations may prolong the process of obtaining a building permit or having
485
an inspection conducted. On the other hand, regulations encourage the application of new
486
technologies and innovations. Regulations may increase the demand for improved technologies in
487
the construction industry, which enhances productivity. Therefore, regulators requires knowledge
488
related to advanced technologies, industry structure and competition, and market structure and
489
conditions so that they can strategically and positively formulate regulations. This finding is also
490
supported by previous studies [96]. A construction contract clearly illustrates the rights and
491
obligations among the involved parties, guarantees, risk allocation, conflict resolution, and assurance
492
[112, 113]. Favorable contract conditions can decrease exposure to risk during a project. It is also
493
suggested that in order to achieve good project cost performance, construction practitioners should
494
improve their understanding of the local regulations and try to develop a good relationship with
495
government agencies. The related regulations might affect the resource management and project
496
planning and control, through the compulsory requirement of innovative construction techniques,
497
equipment and materials.
498
The results confirm the finding of [114], which emphasized that external environment is very
499
important because construction projects do not operate in a vacuum. The difference in
social/cultural/language may impose impacts on market structure and regulatory regime and thus
501
finally impact the project delivery process and project productivity. Natural disasters may cause
502
imbalance supply and demand relationships. For example, the 2011 Christchurch earthquake caused
503
a sudden demand of housing, the increased demand led to dramatically increases in prices of
504
materials, skill labor and equipment. This unexpected increases in prices delayed project delivery
505
and raised project cost. However, this effect may alleviate or exacerbate based on the market
506
efficiency to balance the supply and demand. Also, the regulatory regime may help during the
re-507
balance process.
508
In fact, the impacts of the factors such as market conditions, legal system and external
509
environment influence on the project costs are beyond the project team’s control. They inherently
510
impose many challenges to meet project objectives. They can impose risks on the projects, but the
511
task complexity and organization complexity can either alleviate or exacerbate the risks.
512
513
7. Conclusion
514
It requires considerable and extensive research to investigate the project complexity relevant to
515
and influencing project cost. This study sheds some light on the puzzle. This study developed a model
516
to evaluate the effects of project complexity on projects using structural equation modelling (SEM).
517
The results identify a set of complexity elements or attributes that truly reflect project complexity.
518
The results indicate that both task and organization complexity can significantly impact project cost,
519
while legal complexity has a significantly indirect effect on project cost mediated by task complexity
520
and organization complexity, respectively. Market complexity has a significantly indirect effect on
521
project cost mediated by organization complexity. External environment complexity has a
522
significantly indirect effect on project cost mediated by market complexity and organization
523
complexity. It has significantly indirect effects on project mediated by legal complexity and task
524
complexity and mediated by legal complexity and organization complexity. Based on the direct and
525
indirect relationships between project complexity and project cost and the quantified effects of project
526
complexity on project cost, decision-makers can obtain the knowledge of project complexity and
527
improve understanding of the inherent risks of projects and thus formulate appropriate strategies for
528
project management.
529
One of the main contributions of this study is the insight gained in the attempt to classify the
530
project complexity, while also considering the different activities and aspects of project complexity.
531
Project complexity is a multifaceted phenomenon that combines project task, organizational, market,
532
legal, and external environmental activities. The study contributes to the knowledge by using a
533
holistic method, structural equation modelling (SEM), to model project complexity and cost.
534
Moreover, this study takes exogenous factors into account, as they are unavoidable for any
535
construction project, even if rarely discussed in construction management. This study improves the
536
understanding of the effects of the exogenous factors on project cost, where exogenous factors are
537
separated in terms of market-based factors, the legal regime, and external environmental aspects.
538
This study set up a mediation model in which task complexity and organizational complexity
539
mediate the effect of legal complexity, market complexity, and environmental complexity on project
540
cost. Furthermore, this model can be used as a decision support system for monitoring project cost,
541
based on their cost management practices. In addition, by making the construction professional
542
aware of the activities of project complexity that could significantly affect project cost, the
543
construction professional should become more concerned with the critical complex activities for
544
improving project cost performance.
545
Further investigations are required to develop a greater understanding of the aspects of project
546
complexity for various types of projects. The level of examination has a great potential to be a
547
valuable topic for future research. Moreover, future research can focus on managing risk related to
548
project complexity. Although this model has the flexibility to accommodate various project types in
549
different project operating environments, it is likely that the levels of the dimensions of project
550
complexity that will be affected will differ. Modification of the dimensions and activities could be
undertaken to formulate a qualifying model suitable for a specific construction project. Additionally,
552
this study gathered data from a sample of contractors and project managers; however, future research
553
should address other professions’ viewpoints, such as those of clients and consultants, to identify
554
critical project activities in different perspectives.
555
556
Author Contributions: Conceptualization, L.Z. and H.Z.; methodology, L.Z.; software, H.Z.; validation, L.Z.,
557
H.Z.; resources, L.Z.; writing—original draft preparation, L.Z.; writing—review and editing, H.Z.; visualization,
558
L.Z, H.Z.
559
Funding: This research was funded by China Scholarship Council, grant number 201206130069, Massey
560
University, grant number 09166424, and Beijing University of Technology, the grant number is 004000514119067.
561
The APC was funded by the three grants.
562
Acknowledgments: The authors would like to thank the China Scholarship Council (CSC) for its support
563
through the research project and also the Massey University. The authors would like to thank the New Zealand
564
Industry Associations for provide research data. In addition, I would like to thank all practitioners who
565
contributed to this project.
566
Conflicts of Interest: The authors declare no conflict of interest.
References
569
570
1. Brady, T.; Davies, A., Managing structural and dynamic complexity: A tale of two projects. Project
571
Management Journal 2014, 45 (4), 21-38.
572
2. Faridi, A.; El-Sayegh, S., Significant factors causing delay in the UAE construction industry. Journal of
573
Construction Management and Economics 2006, 24 (11), 1167-1176.
574
3. Qazi, A.; Quigley, J.; Dickson, A.; Kirytopoulos, K., Project Complexity and Risk Management
575
(ProCRiM): Towards modelling project complexity driven risk paths in construction projects. International
576
Journal of Project Management 2016, 34 (7), 1183-1198.
577
4. Sohi, A. J.; Hertogh, M.; Bosch-Rekveldt, M.; Blom, R. In Does Lean & Agile Project Management Help
578
Coping with Project Complexity?, 29th World Congress International Project Management Association (IPMA)
579
Westin Playa Bonita, Panama, 28-30 September – 1 October 2015; Serpell, A.; Ferrada, X., Eds. Procedia - Social
580
and Behavioral Sciences Westin Playa Bonita, Panama, 2016; pp 252-259.
581
5. Cristóbal, J. R. S. In Complexity in Project Management, International Conference on Project MANagement,
582
Barcelona, Spain, 8-10 November 2017; Cruz-Cunha, M. M.; Varajão, J. E. Q.; Rijo, R.; Martinho, R.;
583
Peppard, J.; Cristóbal, J. R. S.; Monguet, J., Eds. Procedia Computer Science Barcelona, Spain, 2017; pp 762-766.
584
6. Mihm, J.; Loch, C.; Huchzermeier, A., Problem-solving oscillations in complex engineering projects.
585
Management Science 2003, 46 (6), 733-750.
586
7. Burke, C. M.; Morley, M. J., On temporary organizations: a review, synthesis and research agenda. Human
587
Relations 2016, 69, 1235–1258.
588
8. Luo, L.; He, Q.-H.; Xie, J.-X.; Yang, D., Investigating the relationship be- tween project complexity and
589
success in complex construction projects. Journal of Management and Engineering 2017, 33 (2), 1-12.
590
9. He, Q.; Luo, L.; Hu, Y.; Chan, A. P. C., Measuring the complexity of mega construction projects in
591
China—A fuzzy analytic network process analysis. International Journal of Project Management 2015, 33, 549-563.
592
10. Meyer, S. M.; Collier, D. A., An empirical test of the causal relationships in the Baldridge Health Care pilot
593
criteria. Journal of Operations Management 2001, 19 (4), 403-426.
594
11. Geraldi, J.; Maylor, H.; Williams, T., Now, let's make it really complex (complicated): a systematic review
595
of the complexities of projects. International Journal of Operations & Production Management 2011, 31 (9), 966-990.
596
12. Padakar, M.; Gopinath, S., Are complexity and uncertainty distinct concepts in project management? A
597
taxonomical examination from literature. International Journal of Project Management 2016, 34, 688-700.
598
13. Vidal, L. A.; Marle, F.; Bocquet, J. C., Measuring project complexity using the Analytic Hierarchy Process.
599
International Journal of Project Management 2011, 29 (6), 718-727.
600
14. Browning, T. R., Managing complex project process models with a process architecture framework.
601
International Journal of Project Management 2014, 32 (2), 229-241.
602
15. Qureshi, S. M.; Kang, C., Analysing the organizational factors of project complexity using structural
603
equation modelling. International Journal of Project Management 2015, 33 (1), 165-176.
604
16. Ramasesh, R. V.; Browning, T. R., A conceptual framework for tackling knowable unknown unknowns in
605
project management. Journal of Operations Management 2014, 32 (4), 190-204.
606
17. Saunders, F. C.; Gale, A. W.; Sherry, A. H., Conceptualising uncertainty in safety-critical projects: a
607
practitioner perspective. International Journal of Project Management 2015, 33 (2), 467-478.
608
18. Brockmann, C.; Girmscherd, G., Complexity in Megaprojects. In CIB World Building Congress, 2007.
609
19. Ward, S.; Chapman, C., Transforming project risk management into project uncertainty management.