Article
Measurement of High Numerical Aperture
Cylindrical Surface with Iterative Stitching
Algorithm
Dingfu Chen 1, Junzheng Peng 2, Sergiy Valyukh 3, Anand Asundi 4 and Yingjie Yu 1,*
1 Lab of Applied Optics and Metrology, Department of Precision Mechanical Engineering, Shanghai
University, Shanghai 200072, People’s Republic of China; [email protected] (C.D.)
2 Guangdong Provincial Key Laboratory of Optical Fiber Sensing and Communications, Department of
Optoelectronic Engineering, Jinan University, Guangzhou 510632, China; [email protected] (P.J.)
3 Department of Physics, Chemistry and Biology (IFM), Linköping University, SE-581 83 Linkoping,
Sweden; [email protected] (S.V.)
4 Centre for Optical and Laser Engineering, School of Mechanical and Aerospace Engineering, Nanyang
Technological University, Singapore 639798, Singapore; [email protected] (A.A.) * Correspondence: [email protected]; Tel.: +86-021-6613-0822
Featured Application: The proposed method is used to test the contour of cylindrical lens and improves the performance of the optical systems.
Abstract: There are some limitations in the null test measurement in the stitching interferometry. In order to meet the null test conditions, the moving distance between the sub-apertures often deviates from the theoretical preset distance, which leads to a position deviation of sub-apertures under measurements. To overcome this problem, an algorithm for data processing is proposed. We used iterative calculation of the deviations between the sub-apertures to adjust their positions, to ensure the local validity of the linear approximation algorithm and realize the exact stitching. A cylindrical lens as an object for experimental examination of the proposed method was taken. The obtained results demonstrate the validity, reliability and feasibility of our iterative stitching algorithm.
Keywords: null test measurement; stitching interferometry; cylindrical surface; iterative algorithm
1. Introduction
Requirements for optical instruments are constantly increased from one product generation to the next. Many of them need one dimensional shaping of the light source that is realized by cylindrical lenses. Cylindrical lenses have been widely used in high intensity laser system, spectroscopic and interferometric devices. Their manufacturing technical processes which include cutting, grinding, polishing is more complex and difficult than spherical ones [1,2]. Therefore, quality control and characterization are much desires.
The tactile measurements are usually based on a coordinate measuring machine or a cylindricity measuring instrument. This technology is in use for a long time and has been matured. Its advantages are the high accuracy and various error compensation, yet its drawback is small numbers of sampling points in a certain direction [3]. Besides, it is necessary to be extra careful in case of the damage of the precision instrument.
Non-contact measurements are realized with optical interferometric techniques that are known because of their high accuracy and dynamic measurement capability coupled with non-destructiveness. At present, the plane and spherical interferometers, e.g. such that are developed by Zygo Co., have reached relatively high accuracy. However, there are some difficulties in the use of interferometry to measure optical surfaces of large sizes or high numerical apertures, because of the problems in manufacturing reference optics for these purposes. The sub-aperture stitching technique [4-9] has to be applied in this case. In Ref. [9,10], J Peng proposed a stitching interferometry of high
numerical aperture cylindrical optics without using a fringe-nulling routine. A plane wave outgoing from an interferometer is converted into a cylindrical wave by using Computer Generated Hologram (CGH) [11,12]. Although this work simplified the measurement procedure without meeting the null test condition [13], the described method cannot totally remove the high-order errors. In Ref. [14], the first order approximation method of cylindrical coordinate transformation is introduced to measure the complete 360° cylinder's surface. The wavefront of the light carrying information on the large aperture is divided by several sub-parts, and the whole surface profile of the metal cylindrical shaft is obtained by using the stitching algorithm. However, the sub-aperture stitching technique based on the null test method gives errors, when the axes of the lens, the wavefront and the rotation stage do not coincide each other. A multi-dimensional adjustment device is used to satisfy the null test condition by adjusting the position of the axis of the rotation and to get the interferogram with a minimal number of the fringes in a measured part (sub-aperture) of the lens. Nevertheless, the actual errors of the turntable movements can cause the miss-arrangement of the sub-apertures. In order to overcome this problem, we propose an iterative algorithm to correct the mismatch and to build up an interferometric stitching measurement system for cylindrical lenses examination. It is based on a CGH cylinder null as the cylindrical wave converter. We obtain a more accurate stitching result of the surface of the cylindrical lens.
The outline of the paper is following. In section 2, it is introduced the principles of the stitching algorithm that has been well used during the past few decades. In this part, the interferometric system of the cylindrical measurement is described. Besides, considering the adjustment errors caused by the null test, we described a cylinder stitching model based on the iterative algorithm, which can constantly adjust the position of the sub-aperture in the global coordination. In section 3, the results of the simulations based on the proposed iterative algorithm and the traditional one is compared. The result of the proposed method shows good performance and eliminates almost the error we added to the sub-apertures. Section 4 is devoted to experimental measurements of a cylindrical lens, here the obtained data are processed by using the iterative algorithm. Finally, conclusions of the work will be done.
2. Principle
2.1. Experimental setup and Error analysis
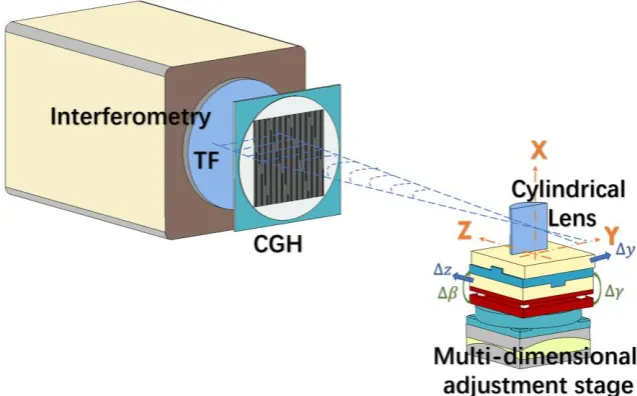
Figure 1. Schematic view of the cylindrical interference system.
sub-apertures must be adjusted in such a way when the interferograms contain minimum fringes. In this paper, a CGH is chosen as a null corrector to measure the cylindrical lens.
Fig. 1 presents the cylindrical interferometric stitching system. Firstly, the plane wave throughout from the interferometer is converted to a cylindrical wave by the CGH and projected on the cylindrical lens to be tested. Then, after interaction with the cylindrical lens surface, the reflected light goes back to the CGH, where the cylindrical wavefront is converted to the plane wavefront and directed back into the interferometer. After that, by analyzing the recorded interferograms, the discrepancy between the measured and reference cylindrical surfaces are obtained. In order to measure cylindrical lenses with large apertures, it is necessary to have CGH with the small f-number (usually greater than 1). The CCH used in our experiment had the f-number equal to 3 that enables observation and detection within 20° and, as a result, makes impossible to get the whole surface profile of a cylindrical lens in general case by one scanning.
The problem mentioned above is solved usually with the sub-aperture stitching technique [4-10] Such an approach will be also helpful for characterization of optical components having high numerical apertures. The multiple scanning of a sample requires preliminary planning of dividing the whole aperture by the sub-apertures at different angles of observation. To be sure that the whole tested surface is covered during the measurements, as well as to control the stitching process, the adjacent segments from the sub-apertures must have overlapping regions. The reconstructed profiles of these overlapping regions have to be identical and to supplement smoothly and continuously the information obtained from the non-overlapping regions.
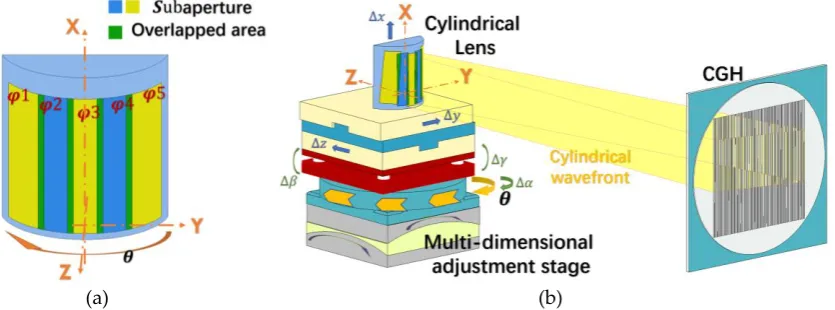
In the measuring approach, we set the global Cartesian coordinate system is such a way that the X axis coincides with the focus of the CGH, the optical axis of the tested sample and the axis of rotation of the rotatable stage (Fig. 2(a)). Z represents the direction of defocus and Y represents the horizontal direction. Since the actual positions of the sub-apertures are unknown in the traditional algorithm [5], it is assumed that the areas covered by the sub-apertures are uniformly allocated on the tested surface. To get uniform allocations of the overlapped and non-overlapped regions, the rotation axis of the multi-dimensional adjustment device platform is adjusted with the optical axis of the cylinder and with the focus of the CGH (Fig. 2(b)).
(a) (b)
Figure 2. Schematic diagram of sub-aperture layout (a). Schematic view of a multi-dimensional adjustment stage (b).
[ 𝜌2 𝛩2 𝑋2] = [
𝜌1 𝛩1 𝑋1] + [
𝑐𝑜𝑠𝛩1 𝑠𝑖𝑛𝛩1 0 −𝑋1𝑠𝑖𝑛𝛩1 𝑋1𝑐𝑜𝑠𝛩1 0 −𝑠𝑖𝑛𝛩1⁄𝜌1 𝑐𝑜𝑠𝛩1⁄𝜌1 0 −𝑋1𝑐𝑜𝑠𝛩1⁄𝜌1 −𝑋1𝑠𝑖𝑛𝛩1⁄𝜌1 1 0 0 1 𝜌1𝑠𝑖𝑛𝛩1 −𝜌1𝑐𝑜𝑠𝛩1 0 ] [ ∆𝑧 ∆𝑦 ∆𝑥 ∆𝛾 ∆𝛽 ∆𝛼]
, (1)
Since the measured phase, is associated with the lens surface, the radius can be replaced by the phase in this equation.
At present, the minimum resolution of a commercial precision turntable rotating stage can be less than 1'. Such a low deviation cannot be registered by the CCD camera in our experimental setup. Therefore, ∆α and ∆x can be ignored.
2.2. Stitching algorithm for the cylindrical lens
Suppose that the entire cylindrical surface can be totally covered by the N sub-apertures forming the N-1 overlapped areas as shown in Fig. 2(a)). Due to the non-ideality of the rotating stage and the position errors, each measurement after a rotation requires preliminary tuning for minimization of the fringes in the interferogram. This, in turn, forces us to describe the sample position at the i measurement with the correction based on the errors ∆𝑧𝑖, ∆𝑦𝑖, ∆𝛾𝑖, ∆𝛽𝑖.
Let the whole interferogram of the lens consists of MK pixels. The results of a measurement of each sub-aperture can be presented by the matrix MK that includes the measured sub-aperture and the zero (nan) values. In particular, the data for the first sub-aperture characterized by 𝜑1 (Fig.2) looks like
1= [
𝜑11,1 𝜑11,2 ⋯ 𝜑11,𝐿 𝑛𝑎𝑛 ⋯ 𝑛𝑎𝑛 𝑛𝑎𝑛 𝑛𝑎𝑛 ⋯ 𝑛𝑎𝑛 𝑛𝑎𝑛 𝑛𝑎𝑛 𝜑12,1 𝜑12,2 ⋯ 𝜑12,𝐿 𝑛𝑎𝑛 ⋯ 𝑛𝑎𝑛 𝑛𝑎𝑛 𝑛𝑎𝑛 ⋯ 𝑛𝑎𝑛 𝑛𝑎𝑛 𝑛𝑎𝑛
⋯ ⋯ ⋯ ⋯ ⋯ ⋯ ⋯ ⋯ ⋯ ⋯ ⋯ ⋯ ⋯
𝜑1𝑀,1 𝜑1𝑀,2 ⋯ 𝜑1𝑀,𝐿 𝑛𝑎𝑛 ⋯ 𝑛𝑎𝑛 𝑛𝑎𝑛 𝑛𝑎𝑛 ⋯ 𝑛𝑎𝑛 𝑛𝑎𝑛 𝑛𝑎𝑛 ]
whereas the matrix characterizing the second sub-aperture is:
2= [
𝑛𝑎𝑛 ⋯ 𝑛𝑎𝑛 𝜑21,1 𝜑21,2 ⋯ 𝜑21,𝐿 𝑛𝑎𝑛 𝑛𝑎𝑛 ⋯ 𝑛𝑎𝑛 𝑛𝑎𝑛 𝑛𝑎𝑛 𝑛𝑎𝑛 ⋯ 𝑛𝑎𝑛 𝜑22,1 𝜑22,2 ⋯ 𝜑22,𝐿 𝑛𝑎𝑛 𝑛𝑎𝑛 ⋯ 𝑛𝑎𝑛 𝑛𝑎𝑛 𝑛𝑎𝑛
⋯ ⋯ ⋯ ⋯ ⋯ ⋯ ⋯ ⋯ ⋯ ⋯ ⋯ ⋯ ⋯
𝑛𝑎𝑛 ⋯ 𝑛𝑎𝑛 𝜑2𝑀,1 𝜑2𝑀,2 ⋯ 𝜑2𝑀,𝐿 𝑛𝑎𝑛 𝑛𝑎𝑛 ⋯ 𝑛𝑎𝑛 𝑛𝑎𝑛 𝑛𝑎𝑛 ]
The rows in the matrixes correspond to the data obtained along the X axis data and the columns correspond to the data got along the 𝛩 axis. Because of the overlapped region between the two measurements, the exact positions of the measured values in 2 can be determined only after comparison the maps of the first and second measurements and finding the exact overlapping between them.
Since each element of the matrixes can be considered as a function of X and 𝛩, the relative position error of adjacent sub-apertures can be eliminated by using the correlation of the overlapped areas. Within an overlapped area, the relationship between the relative position errors and the two sub-apertures can be expressed:
∆𝑠𝑡𝑖𝑡𝑐ℎ𝑒𝑑(𝑋, 𝛩) =𝑖𝑎,𝑏−
𝑖+1𝑎,𝑏= 𝛥𝑧𝑐𝑜𝑠𝛩 + 𝛥𝑦𝑠𝑖𝑛𝛩 − 𝛥𝛾𝑋𝑠𝑖𝑛𝛩 + 𝛥𝛽𝑋𝑐𝑜𝑠𝛩, (2)
where 𝛥𝑧 = ∆𝑧𝑖− ∆𝑧𝑖+1, 𝛥𝑦 = ∆𝑦𝑖− ∆𝑦𝑖+1, etc., 𝑎 =𝑋𝑋−𝑋𝑚𝑖𝑛
𝑚𝑎𝑥−𝑋𝑚𝑖𝑛(𝑀 − 1) + 1,𝑏 =
−𝑚𝑖𝑛
𝑚𝑎𝑥−𝑚𝑖𝑛(𝐾 − 1) + 1. Here the subindex min and max correspond to the minimum and maximum values, respectively. In order to make the calculation easy, 𝑖 is preferred to be transformed into column vectors in advance. 𝑖 + 1 should be at the range of 2 to N.
To get the full aperture map of the tested cylindrical surface, the sum of the squared differences for all overlapped areas should be minimized simultaneously [14] in the following manner:
∑𝑁−1∑𝑎,𝑏{[𝑖𝑎,𝑏+ ∆𝑧𝑖𝑐𝑜𝑠𝛩 + ∆𝑦𝑖𝑠𝑖𝑛𝛩 − ∆𝛾𝑖𝑋𝑠𝑖𝑛𝛩 + ∆𝛽𝑖𝑋𝑐𝑜𝑠𝛩] − [𝑖+1𝑎,𝑏+ ∆𝑧𝑖+1𝑐𝑜𝑠𝛩 + ∆𝑦𝑖+1𝑠𝑖𝑛𝛩 − 𝑖=1
∆𝛾𝑖+1𝑋𝑠𝑖𝑛𝛩 + ∆𝛽𝑖+1𝑋𝑐𝑜𝑠𝛩]} 2
which means that the deviation of any two adjusted subapertures in the overlapped area should be small enough in the meantime. The Eq. 3 can be transformed to a linear equation system. The misalignment error coefficients of the 𝑖𝑡ℎ sub-aperture which have been mentioned in section 2.1 can be formed as 4 × 1 vector 𝑅𝑖:
𝑅𝑖= [∆𝑧𝑖, ∆𝑦𝑖, ∆𝛾𝑖, ∆𝛽𝑖]𝑇, (4) where the superscript T denotes the transpose operation. For the 𝑖𝑡ℎ sub-aperture measurements, we construct a 4 × 1 vector 𝑃𝑖:
𝑃𝑖= [𝑓𝑖,𝑖−1𝑇(𝑖𝑎,𝑏−𝑖−1𝑎,𝑏)]+[𝑓𝑖,𝑖+1𝑇(𝑖𝑎,𝑏−𝑖+1𝑎,𝑏)], (5)
that is associated with the overlapping areas of the sub-aperture. Here it is necessary to note that for the first sub-aperture (i=1), the first part of the right side of Eq. 5 is zero, whereas for the Nth sub-aperture (i=N), the second part of the right side of Eq. 5 is zero. The 𝑓𝑖,𝑖±1 in Eq. 5 is expressed as:
𝑓𝑖,𝑖±1= [𝑐𝑜𝑠𝛩, 𝑠𝑖𝑛𝛩, −𝑋𝑠𝑖𝑛𝛩, 𝑋𝑐𝑜𝑠𝛩]𝑇, (6) where X and related with the corresponding a and b in the overlapping area as was defined above. Then, a 4 × 4 matrix 𝑄𝑖,𝑖±1 is built with 𝑓𝑖,𝑖±1:
𝑄𝑖,𝑖±1= 𝑓𝑖,𝑖±1𝑇𝑓𝑖,𝑖±1, (7) Combining Eq. (4-7) and choosing the 𝑚𝑡ℎ sub-aperture (m∈ [1, N]) as a benchmark sub-aperture, it is possible to rewrite the Eq. 3:
[ 𝑃1 𝑃2 𝑃𝑚−1 𝑃𝑚+1 𝑃𝑁 ] = [
−𝑄1,2 𝑄1,2
𝑄1,2 −𝑄1,2− 𝑄2,3 𝑄2,3
⋮
𝑄𝑚−2,𝑚−1 −𝑄𝑚−2,𝑚−1− 𝑄𝑚−1,𝑚
𝑄𝑚,𝑚+1 −𝑄𝑚,𝑚+1−𝑄𝑚+1,𝑚+2
⋮
−𝑄𝑁−1,𝑁 𝑄𝑁−1,𝑁][
𝑅1
𝑅2
𝑅𝑚−1
𝑅𝑚+1
𝑅𝑁 ]
, (8)
The right side of the Eq. 8 is a product of the 4(𝑁 − 1) × 4(𝑁 − 1) matrix by the 4(𝑁 − 1) × 1 vector, where the benchmark sub-aperture is not included. By calculating the Eq. 8, it is possible to find the position error 𝑅𝑖. After that, the stitching map of whole surface 𝜑̂ can be performed as the right array division through dividing each element of the sum of the corrected sub-apertures by the corresponding element of sum of mask:
𝜑̂(𝑋, 𝛩) = ∑𝑖=1𝑁 (𝑖+ ∆𝑧𝑖𝑐𝑜𝑠𝛩 + ∆𝑦𝑖𝑠𝑖𝑛𝛩 − ∆𝛾𝑖𝑋𝑠𝑖𝑛𝛩 + ∆𝛽𝑖𝑋𝑐𝑜𝑠𝛩).⁄∑𝑁𝑖=1𝑚𝑎𝑠𝑘𝑖, (9) where the 𝑚𝑎𝑠𝑘𝑖 is a matrix MK having elements equal to 1 or 0. Positions of the nonzero elements coincide with the positions of the measured values 𝜑𝑖𝑀,𝐿in 𝑖. For example, the 𝑚𝑎𝑠𝑘1 is:
𝑚𝑎𝑠𝑘1= [
1 1 ⋯ 1 0 ⋯ 0 0 0 ⋯ 0 0 0 1 1 ⋯ 1 0 ⋯ 0 0 0 ⋯ 0 0 0 ⋯ ⋯ ⋯ ⋯ ⋯ ⋯ ⋯ ⋯ ⋯ ⋯ ⋯ ⋯ ⋯ 1 1 ⋯ 1 0 ⋯ 0 0 0 ⋯ 0 0 0 ].
2.3 Iterative algorithm for the cylindrical sub-aperture
Getting the surface profile of the high NA cylindrical lens by stitching the collected phase data with the approach described in section 2.2 may not have a seamless result at once. One of the reasons of this is the restriction by the first order of the Taylor expansion in Eq. 1. Besides, the cylindrical lens is not a closed surfaced, unlike the cylindrical shaft, the lens is lack of some constrain in the circumference direction. To get a better stitching, an iterative algorithm is preferred that enables us a constant adjustment of the position of each sub-aperture. This is possible to realize by applying the least square method for finding the position errors 𝑅𝑖 according to Eq. 8. Then, 𝑅𝑖 are substituted to the Rigid Body Transformation to correct the mismatch of the apertures. After correcting the sub-apertures, the new corrected position errors 𝑅𝑖 are calculated. The loop with the iterations enables us to get more reliable results. The specific steps of the algorithm are as follows:
Step. 1. It is assumed that the measuring aperture is arranged in space according to the preset coordinates. Then, the initial values of the cumulative errors have to be set as 𝐸𝑟𝑟𝑖0= (∆𝑧
∆𝛾𝑖0,∆𝛽𝑖0) = (0,0,0,0). The initial phase values 𝜑 𝑖 0= 𝜑
𝑖 are the measured phase data by the interferometer. The superscript denotes a current iteration number, the subscript 𝑖 denotes the number of sub-apertures.
Step. 2. Substitute 𝜃, X and 𝜑𝑖(𝑡) into Eq. 8 to get the least squares solutions (∆𝑧𝑖(𝑡+1), ∆𝑦𝑖(𝑡+1),∆𝛾𝑖(𝑡+1),∆𝛽𝑖(𝑡+1)) = 𝑅𝑖(𝑡+1), which is the error vector in the cylindrical coordination system. The superscript t denotes the iteration number, 𝑡 = 0,1,2 …
Step. 3. Find a new corrected 𝐸𝑟𝑟𝑖(𝑡+1) according to the equation:
𝐸𝑟𝑟𝑖(𝑡+1)= 𝐸𝑟𝑟𝑖(𝑡)+ 𝑅𝑖(𝑡+1), (10) Step. 4. Change 𝜑𝑖(𝑡) into the Cartesian coordinate and substitute it into the transformation matrix, which includes the coefficients 𝑅𝑖𝑡. After that it is necessary to change it into the cylindrical coordination back:
𝑦𝑖(𝑡)= 𝜑𝑖(𝑡)× cos(𝜃𝑖(𝑡)) ; 𝑧𝑖(𝑡)= 𝜑𝑖(𝑡)× 𝑠𝑖𝑛(𝜃𝑖(𝑡)); 𝑥𝑖(𝑡)= 𝑋𝑖(𝑡+1), (11) [𝑦𝑖(𝑡+1) 𝑧𝑖(𝑡+1) 𝑥𝑖(𝑡+1) 𝐼] = [𝑦𝑖(𝑡) 𝑧𝑖(𝑡) 𝑥𝑖(𝑡) 𝐼] ∗ 𝑇1𝑇2𝑇3𝑇4, (12) where 𝑇1,𝑇2, 𝑇3, 𝑇4 are the transformation matrixes with taking 𝑅𝑖(𝑡+1) into account. 𝐼 is the unity matrix;
𝜑𝑖(𝑡+1)= √𝑦𝑖(𝑡+1)2+ 𝑧𝑖(𝑡+1)2; 𝑋𝑖(𝑡+1)= 𝑥𝑖(𝑡+1); 𝜃𝑖(𝑡+1)= arctan (z(𝑡+1)
y(𝑡+1)), (13) Step. 5. Repeat the steps described above until 𝑅𝑖(𝑡+1) is less than the threshold or reaches the
iteration time (usually 10-3 μm or 3 times of iterations according to practical experience). Then we
can obtain the more reliable result for 𝜑𝑖(𝑡+1).
3. Simulation
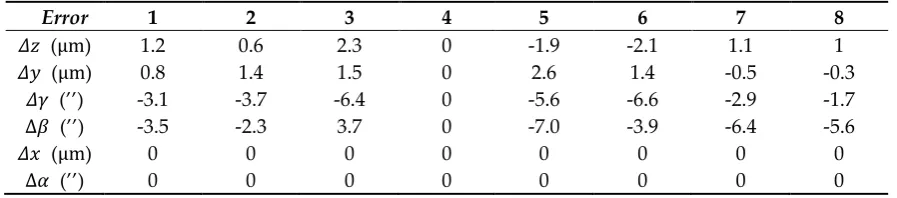
In order to estimate the accuracy of the proposed method, we carried out a simulation of stitching interferometry for a high NA cylindrical surface by using MATLAB. First, a cylindrical surface of 50 mm height and 26.4 mm radius was built (Fig. 3 (a)). The angular aperture in this case equals 102°. Then, the simulated surface was divided by eight equal fragments, each of which is observed under the sub-aperture of about 18°. The rotation angle of each fragment is 12°, and the overlapped area composes 6°. Each fragment is associated with own position error as shown in Table 1. The 4th fragment (sub-aperture) was chosen as the benchmark, therefor its errors are zero. Besides, because of the errors 𝛥𝑥 and ∆𝛼 are negligible, they were set zero. The errors given in the table correspond to an actual situation in a measurement.
Table 1. the errors of the sub-aperture given to the sub-aperture.
Error 1 2 3 4 5 6 7 8
𝛥𝑧 (μm) 1.2 0.6 2.3 0 -1.9 -2.1 1.1 1
𝛥𝑦 (μm) 0.8 1.4 1.5 0 2.6 1.4 -0.5 -0.3
𝛥𝛾 (’’) -3.1 -3.7 -6.4 0 -5.6 -6.6 -2.9 -1.7
∆𝛽 (’’) -3.5 -2.3 3.7 0 -7.0 -3.9 -6.4 -5.6
𝛥𝑥 (μm) 0 0 0 0 0 0 0 0
∆𝛼 (’’) 0 0 0 0 0 0 0 0
(a)
(b)
Figure 3. The simulation of the proposed method. An ideal cylindrical surface was built (a). 8 sub-apertures were segmented to cover the whole surface and each sub-aperture was attached with some position errors (b).
(a) (b)
(c) (d)
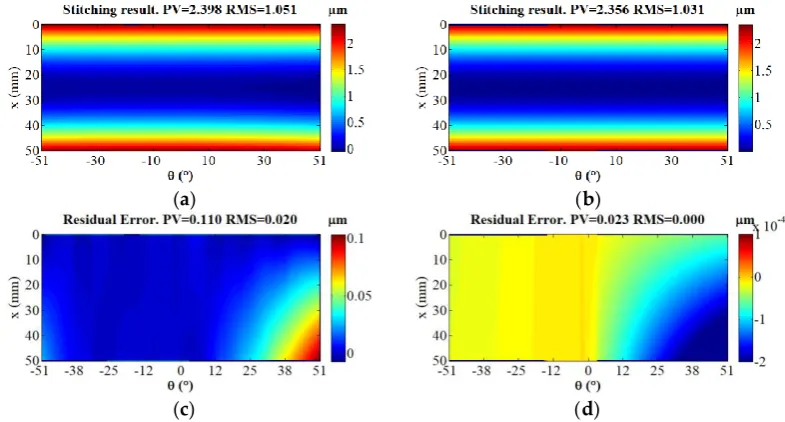
Figure 4. The stitching result without using the iteration algorithm (a). The result by the proposed iterative method (b). The residual error between the origin map and tradition method (c). The residual error between the origin map and iterative method (d).
For demonstration of the advantage of the proposed algorithm, we give the adjustment value 𝑅𝑎𝑘 of the sub-apertures in the continuous iterative process in table (2, 3). It is possible to see that only in one times of iteration, the value of 𝐸𝑟𝑟𝑖𝑡 is quite near to the negative preset value. With the increase of the number of the iterations, the deviation between 𝐸𝑟𝑟𝑖𝑡 and the preset value in table (1) is 0.1nm, which is 0.01% from the preset value. The proposed method is proved to have a quite fast convergent speed and a wide range of the adjustment.
Table 2. the adjustment error of each sub-aperture for 1 iteration.
𝑬𝒓𝒓𝒊(𝟏) 1 2 3 4 5 6 7 8
𝛥𝑦 (μm) -0.8002 -1.4002 -1.5003 0 -2.5999 -1.4000 0.5000 0.3001
𝛥𝛾 (’’) -3.1 -3.7 -6.4 0 -5.6 -6.6 -2.9 -1.7
∆𝛽 (’’) -3.5 -2.3 3.7 0 -7.0 -3.9 -6.4 -5.6
Table 3. the adjustment error of each sub-aperture for 3 iterations.
𝑬𝒓𝒓𝒊(𝟑) 1 2 3 4 5 6 7 8
𝛥𝑧 (μm) -1.2000 -0.6000 -2.3000 0 1.9000 2.1000 -1.1000 -1.0000 𝛥𝑦 (μm) -0.8000 -1.4000 -1.5000 0 -2.5999 -1.3999 0.5001 0.3001
𝛥𝛾 (’’) -3.1 -3.7 -6.4 0 -5.6 -6.6 -2.9 -1.7
∆𝛽 (’’) -3.5 -2.3 3.7 0 -7.0 -3.9 -6.4 -5.6
4. Experimental demonstration
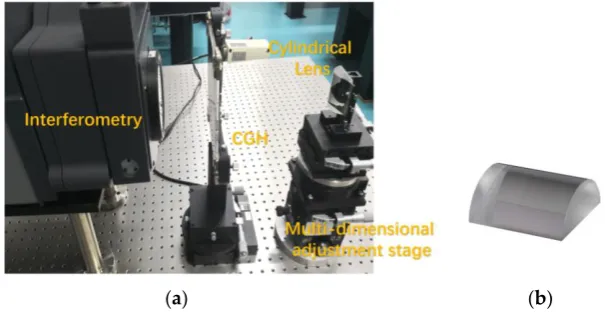
In order to verify the practicality of the proposed algorithm, experimental measurements have been carried out. The experimental arrangement consists of a Fizeau interferometer (Zygo GPI/XP 4), a CGH cylinder null (Diffraction international, H80F3C) and a multi-dimensional adjustment stage (Fig. 5). The CGH cylinder null with size of 80×80 mm (Height×Width)was used as the cylindrical wavefront converter of the interference system. The maximum aperture angle that can be measured was nearly 18.9° (the treatment of the image borders leads to the measured angle less than 20 degrees). The size of the cylindrical lens was 53×50.8 mm (Height×Width) and curvatures radius was 26.4 mm. For obtaining the whole surface of the cylindrical lens, we collected 13 sub-apertures and set the rotation angle as 12°. By using the multi-dimensional adjustment stage, each sub-aperture was tilted and leveled before measurement (without vertical movement and extra rotation around the turntable rotation stage axis). So that each current sub-aperture satisfied the null test condition.
(a) (b)
Figure 5. Photograph of the experimental system (a) and the experimental sample (b).
(a) (b)
Figure 6. Interferograms measured of different sub-aperture, fringe map of sub-apertures(a). and the phase map of sub-apertures (b).
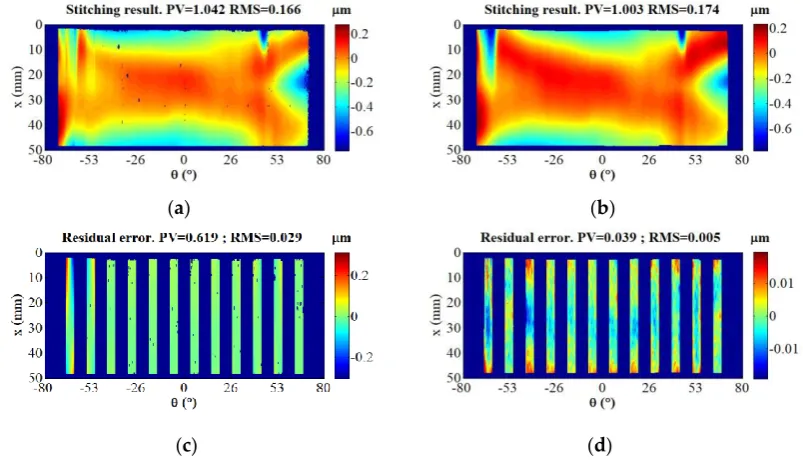
The stitching result map without the iterations is expressed in Fig. 7(a). where it is seen the stitching marks. Accordingly, the result map after 3 iterations (Fig. 7 (a)) is seamless, the peaks-and-valleys (PV) value of the stitching result is 1.003 μm and the root mean square (RMS) value is 0.174
μm. To evaluate the effectiveness of the proposed stitching method, we observed the variation of the mismatch map within the overlap regions, as shown in Fig. 7 (c, d). It was yielded by calculating the radial deviations of corresponding points in the overlap region, it can be thought of as the residual noise following stitching process. The PV value of the residual error without iteration is 0.619 μm and the RMS value is 0.029 μm. On the contrary, the RMS value by using the purposed method is 0.005 μm, which confirms that the proposed stitching model is able to eliminate the discrepancies among the overlap regions (The invalid points in Fig. 7 (a) is caused by the spurious fringe in the central sub-aperture. Due to the interpolation process in the coordinate transformation, there is no invalid point in the middle part of the stitching result in Fig. 7 (b))
(a) (b)
(c) (d)
Figure 7. Stitching result without interation and the mismatch map (a, b) compare with the proposed method with three iterations (c, d).
iteration of the two sub-apertures. The experimental data (Fig. 8) show that after three iterations the y-direction and z-direction errors can be stabilized within a very small range. From the graph, it is seen that for the whole experimental system and its operation, the rotation errors around the Y and Z axes are relatively small. Finally, we give the adjustment error 𝑅𝑎𝑘 in three iterations in the table. 4. The sub-aperture 9 is selected as the benchmark.
(a) (b)
Figure 8. (a, b) The change of the relative motion errors of two sub-apertures in 10 iterations. Table 4. the adjustment error of each sub-aperture for 3 iterations.
𝑬𝒓𝒓𝒊(𝟑) 1 2 3 4 5 6 7 8
𝛥𝑧 (μm) 1.2137 -0.5741 0.8844 0.7786 0.7942 0.7232 0.5038 0.4332 𝛥𝑦 (μm) -4.4061 2.7769 -0.1865 0.0128 0.0205 0.0574 0.1129 0.0850
𝛥𝛾 (’’) -14 -16 -0.7 -0.5 -0.27 0 0.2 0.3
∆𝛽 (’’) -3.51 -2.27 3.71 0 -7.01 -3.92 -6.39 -5.57
9 10 11 12 13
𝛥𝑧 (μm) 0 0.4166 -0.6006 0.5141 0.5827 𝛥𝑦 (μm) 0 0.1540 -0.5952 0.3576 0.3520
𝛥𝛾 (’’) 0 -1.6 -4.4 -0.3 -0.3
∆𝛽 (’’) 0 -4.1 4.6 -0.8 -0.9
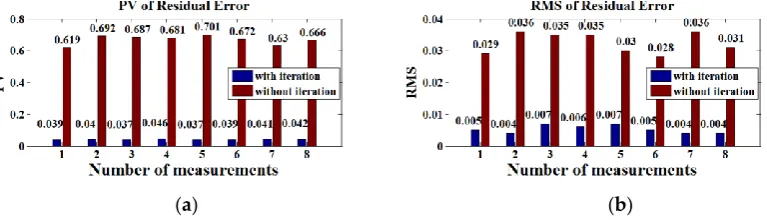
In addition, to verify the robustness of the algorithm, the lens was measured 8 times, with or without the iteration to compare the residual errors (Fig. 9). The PV value and the RMS value of the residual error are as a rule kept within a stable range, which further verifies the high reliability of the measurement.
(a) (b)
Figure 9. Data comparison of 8 groups of the PV value of residual error (a). The RMS value of the residual error (b).
From the experiment, it is seen that the stitching result by using our algorithm has advantages in comparison with the traditional technique. Among the next practical steps for improvement of the proposed method can be its slight modification and adaptation for characterization of complex structured materials and surfaces [16,17] as well as for inline quality control in a product line [18] that is often highly required in mass production of optical components.
5. Conclusion
surface topography of a cylindrical lens with high NA. By constantly calculate the deviation of the measured overlapping area and then adjusting the position of each sub-aperture, the obtained experimental results have fewer residual errors than that of the traditional method. Possible registered miss-arrangements during a measurement are corrected in the data processing. This advantage of the new method enables us to state about its higher reasonability and reliability than the traditional techniques. The calculation results can be quickly converged. With the increase of the iteration, the improvement of accuracy is not obvious. In addition, due to the high accuracy of the experimental device, the higher numbers of iteration will not be of great significance.
Author Contributions: Writing-Original Draft Preparation and Software C.D.; Formal Analysis, Investigation and Methodology P.J.; Project Administration and Supervision Y.Y. and A.A.; Supervision A.A.; Editing & Review and editing Y.Y. and S.V.
Funding: The authors are grateful for support from the following research grants: (1) the National Natural Science Foundation of China (NSFC) (No. 51775326); (2) National Science and Technology Major Project (No.2016YFF0101905); (3) Natural Science Foundation of China (NSFC) (No. 61605126);
Conflicts of Interest: The authors declare no conflict of interest. References
1. Fang, F.; Zhang, X.; Hu, X. Cylindrical coordinate machining of optical freeform surfaces. Optics Express. 2008, 16, 7323-7329, DOI:10.1364/OE.16.007323.
2. Zhang, X.; Zeng, Z.; Liu, X.; Fang, F. Compensation strategy for machining optical freeform surfaces by the combined on- and off-machine measurement. Optics Express. 2015, 23, 24800-24810, DOI:10.1364/OE.23.024800.
3. Ramaswami, H.; Kanagaraj, S.; Anand, S. An inspection advisor for form error in cylindrical features. Int J Adv Manuf Technol. 2009, 40, 128-143, DOI: 10.1007/s00170-007-1321-4.
4. Chen, M.; Cheng, W.; Wang, CWW. Multi aperture overlap scanning technique for large-aperture test, Proc. SPIE. 1991, 1553, 626-635, DOI:10.1117/12.135344.
5. Otsubo, M.; Okada, K.; Tsujiuchi, J. Measurement of large plane surface shapes by connecting small aperture interferograms. Optical Engineering. 1994, 33, 608-613. DOI:10.1117/12.152248.
6. Peng, J.; Chen, D.; Guo, H.; Zhong, J.; Yu, Y. Variable optical null based on yawing CGH for measuring steep acylindrical surface. Optics Express. 2018, 16, 20306-20318, DOI:10.1364/OE.26.020306
7. Wen, Y.; Cheng, H.; Tam, H. Y.; Zhou, D.; Modified stitching algorithm for annular subaperture stitching interferometry for aspheric surface. Appl. Opt. 2013, 52, 5686-5694, DOI:10.1364/AO.52.005686
8. Tricard, M.; Kulawiec, A.; Bauer, M.; Subaperture stitching interferometry of high-departure aspheres by incorporating a variable optical null. CIRP Annals-Manuf. Technol. 2010, 59, 547–550. DOI:10.1016/j.cirp.2010.03.125
9. Peng, J.; Wang, Q.; Peng, X.; Yu, Y. Stitching interferometry of high numerical aperture cylindrical optics without using a fringe-nulling routine. J. Opt. Soc. Am. A. 2015, 32, 1964–1972. DOI:10.1364/JOSAA.32.001964.
10. Peng, J.; Xu, H.; Yu, Y. Stitching interferometry for cylindrical optics with large angular aperture. Meas. Sci. Technol. 2015, 26, 025204, DOI:10.1088/0957-0233/26/2/025204.
11. Mac Govern A.J.; Wyant J.C. Computer Generated Holograms for Testing Optical Elements. Applied Optics. 1971, 10(3), 619-624, DOI:10.1364/AO.10.000619
12. Asfour, J.M.; Poleshchuk, A.G. Asphere testing with a Fizeau interferometer based on a combined computer-generated hologram. J. Opt. Soc. Am. A. 2006, 23, 172-178, DOI:10.1364/JOSAA.23.000172. 13. Tricard, M.; Kulawiec, A.; Bauer, M.; Subaperture stitching interferometry of high-departure aspheres by
incorporating a variable optical null. CIRP Annals-Manuf. 2010, 59, 547-550, DOI:10.1016/j.cirp.2010.03.125. 14. Peng, J.; Yu, Y.; Chen, D. Stitching interferometry of full cylinder by use of the first-order approximation
of cylindrical coordinate transformation. Optics EXPRESS. 2017, 25, DOI:10.1364/OE.25.003092.
15. Guo, H.; Chen, M. Multiview connection technique for 360-deg 3D measurement. Optical Engineering. 2003, 42, 900-905, DOI:10.1117/1.1555056.
17. Valyukh, S.; Valyukh, I.; Skarp, K. Spectrophotometric determination of reflective liquid crystal cell parameters. Journal of Applied Physics, 2006, 99, 053102, DOI:10.1063/1.2177376.