THE EFFECTS OF FLOW RATE
CHANGES
ON
FILTER PERFORMANCE
ANNE THURSTON
UNIVERSITY COLLEGE LONDON
ProQuest Number: U642482
All rights reserved
INFORMATION TO ALL USERS
The quality of this reproduction is dependent upon the quality of the copy submitted.
In the unlikely event that the author did not send a complete manuscript and there are missing pages, these will be noted. Also, if material had to be removed,
a note will indicate the deletion.
uest.
ProQuest U642482
Published by ProQuest LLC(2015). Copyright of the Dissertation is held by the Author.
All rights reserved.
This work is protected against unauthorized copying under Title 17, United States Code. Microform Edition © ProQuest LLC.
ProQuest LLC
789 East Eisenhower Parkway P.O. Box 1346
ABSTRACT
Filtration is an essential process within potable water treatment. Recent outbreaks of
Cryptosporidiosis have brought filter performance into the spotlight, as it is widely
acknowledged to be the most important stage for the removal of pathogens. There are
many variables which can affect the efficiency of filtration, both within the filter
itself, such as media type and size, and also stages preceding filtration such as
coagulant dosing.
This research focuses on the effects of flow changes on filter performance, because
although researchers as early as the 1960’s have suggested that increasing the flow
will increase particulate breakthrough, no attempts have been made to actually
quantify or explain these effects.
Work has been carried out at laboratory and full-scale, and computer simulations have
also been conducted. In the laboratory, temporary, permanent and gradual flow
increases have been applied to a Im bed in a 2m high filter column. These increases
were o f varying magnitude and at different stages of the filter cycle, to determine
which type of flow change is most harmful in terms of increased particle
breakthrough. Various media configurations and coagulants have been investigated.
The effluent quality was recorded using a particle counter, rather than a turbidimeter,
so that the particle size distribution of the breakthrough could be assessed.
Breakthrough in the specific Cryptosporidium size range (2-5pm) could be
The results have shown that in general, flow increases do cause an increase in particle
breakthrough, and that the larger and later the flow change is applied, the higher the
level of breakthrough is observed. However, this pattern was not observed in all
cases, and it was clear that external factors are just as important as the flow change
itself in determining the amount of breakthrough from the filter. One of the most
important variables is water temperature. Results have shown that when using alum
as the coagulant, an identical flow change will cause more breakthrough at higher
water temperatures than that observed during periods of colder influent water. Poly
aluminium chloride provided more consistent breakthrough patterns through a range
of water temperatures, but this coagulant did not perform as well as alum in cold
influent conditions.
The effects o f mechanical vibrations on breakthrough was also investigated, and
although there has been very little published research on this phenomena, this work
found that vibrations have a great effect on the filter performance, both at laboratory
and at full-scale.
All of these results suggest a very complex pattern of filter breakthrough, whereby a
number of factors must be considered when trying to predict the amount of particle
CONTENTS
PAGE
Abstract 2
List of Figures 10
List of Tables 13
1) Introduction 14
1.1: Aims of the project 16
2) Literature Review 18
2.1: Types of filters and filtration process 18
2.2: Media properties 23
2.3: Backwashing 29
2.4: Coagulation 37
2.5: Shear stress 43
2.6: Floe strength 45
2.7: Effects of water temperature 48
2.8: Effects of flow rate changes 50
2.9: Viewing techniques 53
2.10: Particle counting methods 57
2.11: Cryptosporidium 63
2.12: Filtration modelling 69
2.13: Summary 71
3) Methodology 72
3.1: Filter column apparatus 72
3.2: Media selection 75
3.2.1: Headless measurements 77
3.3: Influent water properties 80
3.3.1: Alum coagulation j ar tests 81
3.3.2: Temperature effects on alum 83
3.3.3: Polyaluminium chloride coagulant 84
3.3.4: Temperature effects on PAX 85
3.4: Backwashing regimes 86
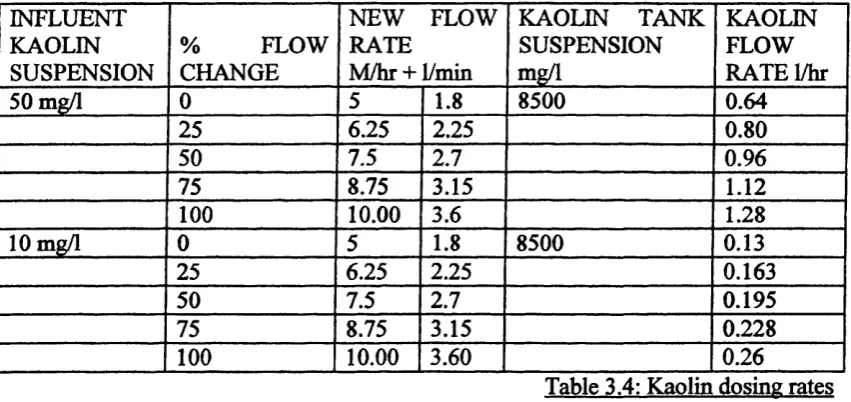
3.5: Flow rates 87
3.5.1: Flow changes performed on a mono-media bed 88
3.5.2: Flow changes performed on a dual media bed 90
3.6: PDA 2000 91
3.7: Video endoscopy 93
3.8: Filterflex computer simulation model 95
4) Results 96
4.1: Temporary flow changes 96
4.1.1: 50mg/l kaolin influent suspension 97
4.1.2: lOmg/1 influent suspension 103
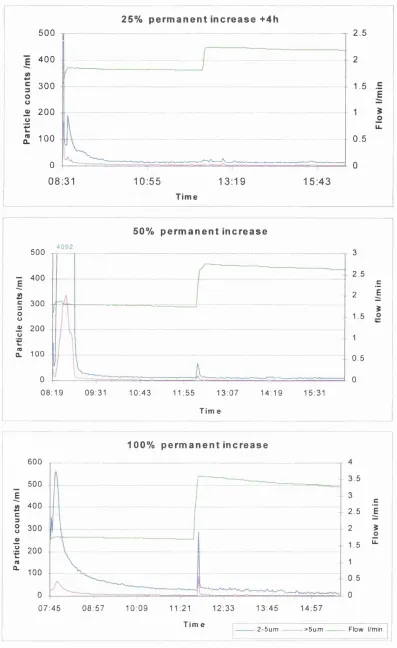
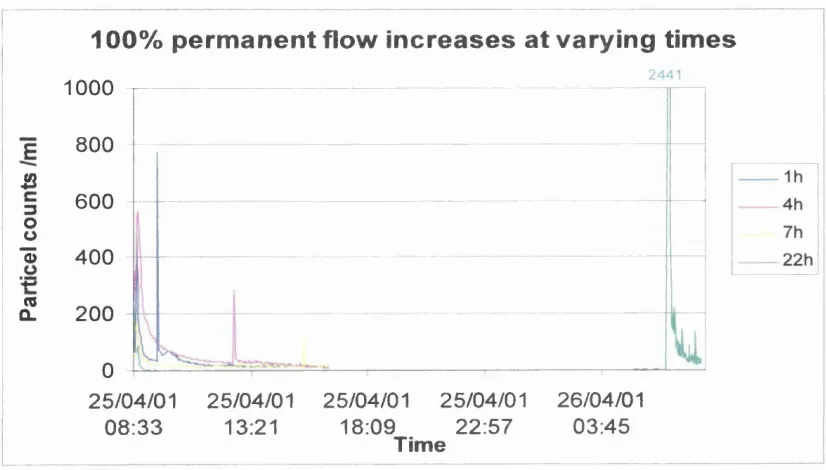
4.2: Permanent flow increases 107
4.2.1: 50mg/l kaolin influent suspension 107
4.2.2: lOmg/1 kaolin influent suspension 110
4.3: Gradual flow changes 114
4.3.1: 50mg/l influent suspension 115
4.3.2: 1 Omg/1 influent suspension 116
4.4.1: Temporary flow changes 120
4.4.2: Permanent flow changes 124
4.4.3: Gradual flow changes 125
4.5: Dual media bed experiments , 127
4.5.1: Temporary flow changes 127
4.5.2: Permanent flow changes 130
4.5.3: Gradual flow changes 132
4.6: Higher starting flow rates 134
4.6.1: 1 Om/h starting rate 134
4.6.2: 7.5m/h starting rate 137
4.7: Polyaluminium chloride (PAX) coagulant 139
4.7.1: Winter influent water (16°C) 140
4.7.2: Summer influent water (25°C) 144
4.8: Summary of results 149
5) External Variables 151
5.1: Influent water temperature 151
5.1.1: Jar tests at varying temperatures 153
5.1.2: PAX and alum comparisons 154
5.1.3: PDA 2000 investigations 158
5.1.4: Shear stresses 161
5.2: Vibration effects 165
5.3: Summary 167
6) Full-Scale plant studies 169
6.1: Plant X water treatment works 169
6.1.2: Pilot column statistics 171
6.1.3: Filter 1 history 171
6.1.4: External factors 172
6.1.5: Backwashing observations 173
6.1.6: Results 173
6.1.7: Filter 1 assessment 183
6.1.8: Conclusions 184
6.1.9: Recommendations 185
6.2: Plant Y Water treatment works 186
6.2.1: Filter statistics 187
6.2.2: Results 188
6.2.3: General analysis 202
6.2.4: Conclusions 205
6.3: Plant Z Water treatment works 206
6.3.1: Filter statistics 208
6.3.2: Results 208
6.3.3: General analysis 215
6.3.4: Conclusions 215
6.4: Full-Scale plant general analysis 216
7) Video endoscopy 219
7.1 : Observations of a 20h flow change at 25®C 220
7.2: Observations of a 20h flow change at 16°C 222
8) Filterflex computer model 225
8.1: Im sand media simulation 225
8.1.2: Simulations using varying influent suspensions 227
8.1.3: Temporary flow changes 228
8.1.4: Permanent flow changes 231
8.1.5: Graduai flow changes 232
8.2: Reduced bed depth simulations 233
8.3: Simulations using a dual media bed depth configuration 234
8.3.1: 1 Om/h starting flow rate simulations 236
8.4: Simulations at different influent temperatures 238
8.5: Summary 239
9) Discussion 241
9.1 : Laboratory filter runs 241
9.2: External factors affecting filter performance 250
9.2.1: Temperature effects 250
9.2.2: Vibration effects 255
9.3: Video endoscopy observations 256
9.4: Full-Scale plant observations 257
9.5: Filterflex computer model 260
9.6: Summary 261
10) Conclusions 263
10.1: Further research 267
APPENDICES
1) Conference presentations
IWA Conference, Paris France. 2000
AWWA WQTC conference, Salt Lake City, USA. 2000
CIWEM conference, London, UK. 2001
IWA Melbourne, AUS. 2002
2) Anthracite specification sheet
3) Filterflex parameters
LIST OF FIGURES
PAGE
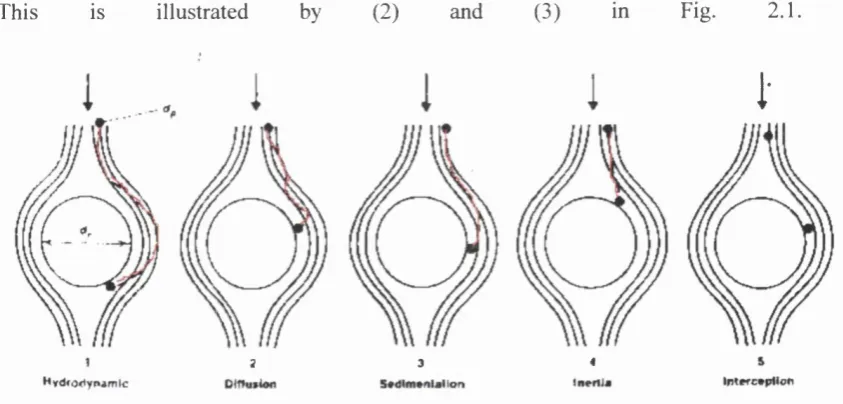
2.1: Transport mechanisms of filtration (Ives, 1982) 19
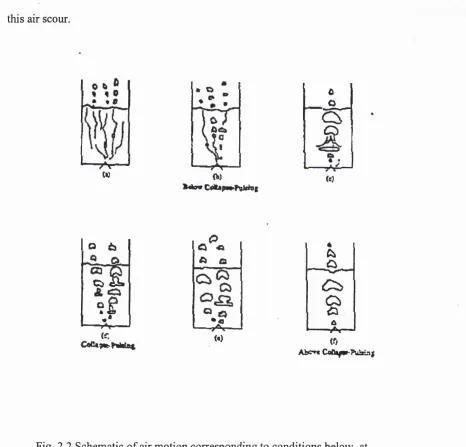
2.2: Schematic of air motion corresponding to conditions below, at, and 31 exceeding collapse-pulsing (Amirtharajah, 1993)
2.3: Microscopic view of air cavities and sand grains during air scour 32 (Amirtharajah, 1993)
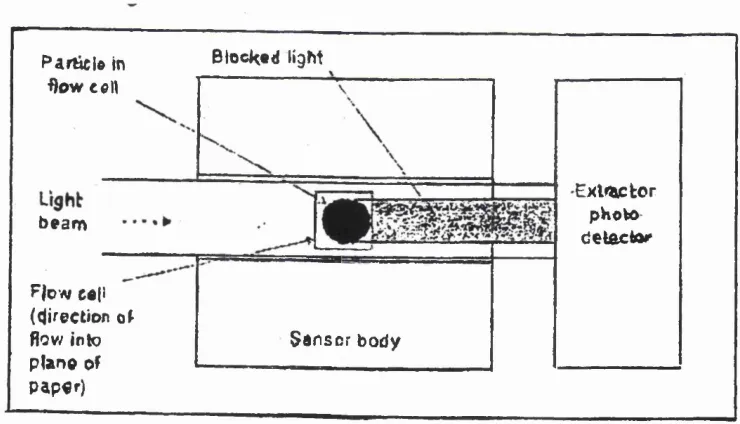
2.4: Schematic of particle counter operation (UKWIR 1999) 57
3.1: Schematic diagram of filter apparatus 73
3.2: Cumulative percentage eight of each sieve 76
3.3: Illustration of varying time spent at higher flow rate, due to 90
Gradual flow increase
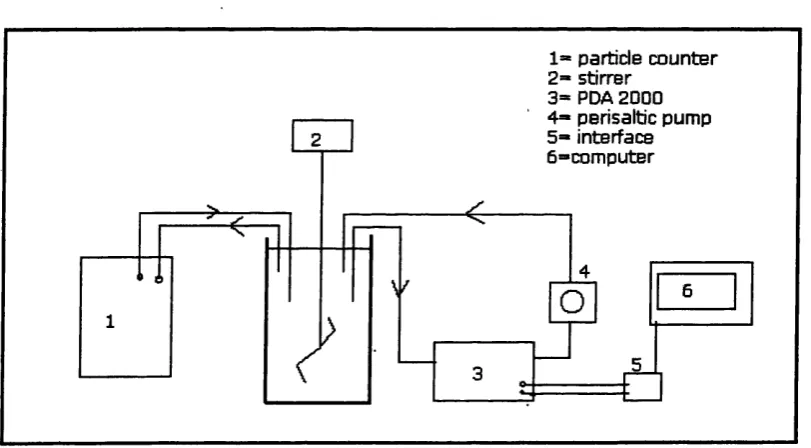
3.4: Schematic diagram of the PDA 2000 apparatus 92
3.5: Schematic diagram of the video endoscopy apparatus 94
4.11: 50mg/l kaolin control run 97
4.12: Temporary flow increases of varying magnitudes after Ih 99
4.13: Temporary flow changes of varying magnitudes applied after 7h 100
4.14: 100% temporary flow changes applied at various times during the cycle 101
4.15: 100% flow changes at varying times during the filter cycle ( 1 Omg/1 kaolin) 104
4.16: Temporary flow increases after 1 hour (10 mg/1 kaolin) 105
4.17 Temporary flow increases after 22h 106
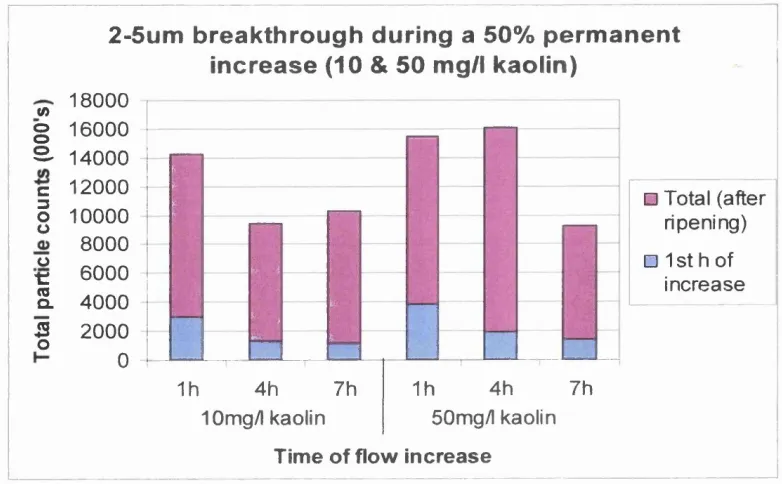
4.21: 50% permanent increases after 1, 4 and 7h 108
4.22: Permanent flow changes of varying magnitudes applied after 4h 109
4.23: Permanent flow changes applied after 4h 111
4.25 : Comparison of total particle shedding between kaolin concentrations 113
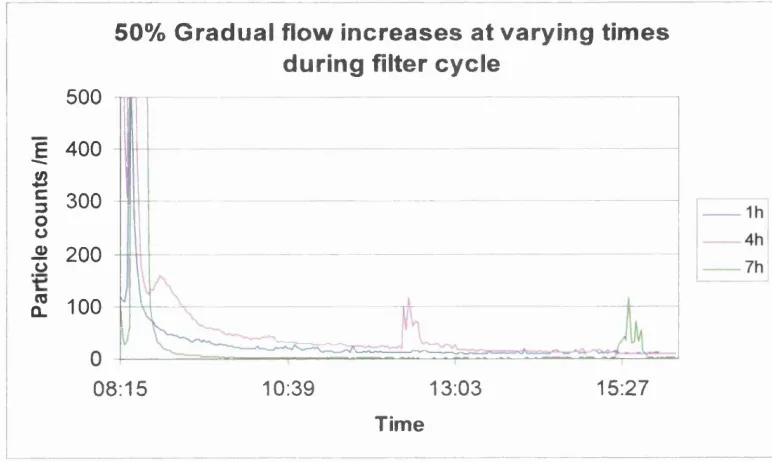
4.31: 50% gradual flow changes applied at varying times during the cycle 115
4.32: 50% gradual increases at varying times during the cycle (1 Omg/1 kaolin) 117
4.33 : Gradual flow changes of varying magnitudes applied after 4h 117
4.41: Reduced media bed control run 120
4.42: 25% and 50% temporary increases after 20h 122
4.43: 50% temporary flow increases applied after 1, 4 and 20h 123
4.44: 50% permanent flow increases at varying times during the cycle 124
4.45: 25 and 50% gradual flow increases after 20h 126
4.46: 50% gradual increases after 1, 4 and 20h 127
4.51: 50% temporary flow increases after 1, 4 and 20h 129
4.52: 50% permanent increases after 1, 4 and 20h 131
4.53: 50% gradual flow increases after 1, 4 and 20h 133
4.61: 1 Om/h starting flow rate control run 135
4.62: 25% temporary flow increases applied after 1,4 and 20h 136
4.63: 25% temporary flow increases after 1, 4 and 20h (7.5m/h starting rate) 138
4.71: 25% temporary flow increases after 1, 4 and 20h (16°C) 141
4.72: 50% temporary flow increases after 1, 4,and 20h (16°C) 143
4.73: PAX control run with 25®C influent temperature 144
4.74: 25% temporary flow increases after 1, 4, and 20h (25°C) 145
4.75: 50% temporary flow increases after 1, 4, and 20h (25°C) 147
4.76: Headloss comparison between PAX experiments at different temperatures 148
5.11: Particle breakthrough observed at different influent water temperatures 152
5.12: Comparison of alum and PAX performance at different temperatures 156
pi
5.15: Size distribution of floe growth using PDA 2000 161
5.21 : The effects of vibrations on particle breakthrough in the laboratory 165
5.22: Particle breakthrough during demolition work at plant Y. 166
6.11: Plant X Non refurbished filter performance, last 30-50h of filter run. 174 Flow rate 5m/h
6.12: Plant X refurbished filter performance. Last 30-70h of filter run. 177 Flow rate 5m/h
6.13: Breakthrough during entire filter cycles ( 1 OOh) Flow rate 5m/h 179
6.14: Comparison between individual filter performance. Last 30h o f filter cycle. 181 Flow rate 5m/h
6.15: Particle breakthrough observed firom pilot column. 72 & lOOh cycles. 25% 182 flow increases of 30 minutes duration upon flow rate of 5m/h (311/h)
6.16: Combined filtrate particle count data for 1 month 183
6.21: Comparison of 3 different particle counters, to establish recording accuracy 189
6.22: Breakthrough in original filters, entire filter runs (24h). 191 Starting flow rate 6m/h
6.23 : Filter performance during spate periods (poor influent water quality) 193
6.24: Breakthrough in new design filters, entire filter runs. ' 195 Starting flow rate 6m/h
6.25 : Breakthrough during demolition work (15m distance fi*om filter) 196
6.26: Breakthrough recorded on the combined counter. 1 week of data per graph. 199
6.27a: Headloss build up during Powdered Activated Carbon (PAC) addition 200
6.27b: Headloss build up during spate conditions for old and new filters 200
6.31 : Particle breakthrough in filters 1 and 2, entire filter runs (60h). 211 Starting flow rate 5.1m/h
6.32: Particle breakthrough in filters 3 and 4, 60h time period 212 (incomplete filter runs) Starting flow rate 5.1m/h
6.33: Particle breakthrough measured on the combined filtrate particle counters; 214 1 weeks data
8.12: Simulated breakthrough using varying concentrations of influent 227 suspension
8.13: 50% temporary flow changes applied at varying times during the run 229
8.14: Flow changes of differing magnitudes applied after 4 hours 230
8.15: 50% permanent flow increases applied to the model at varying times 231
8.16: 50% gradual increases applied to the model at varying times 232
8.21 : Temporary flow increases applied to a dual media bed 233
8.31: 50% temporary flow increases applied to a dual media bed 235
8.32: Temporary flow increases using a starting flow rate of 1 Om/h 236
8.41: 50% temporary flow increases using different influent temperatures 238
LIST OF TABLES
3.1: Sand fraction weights 75
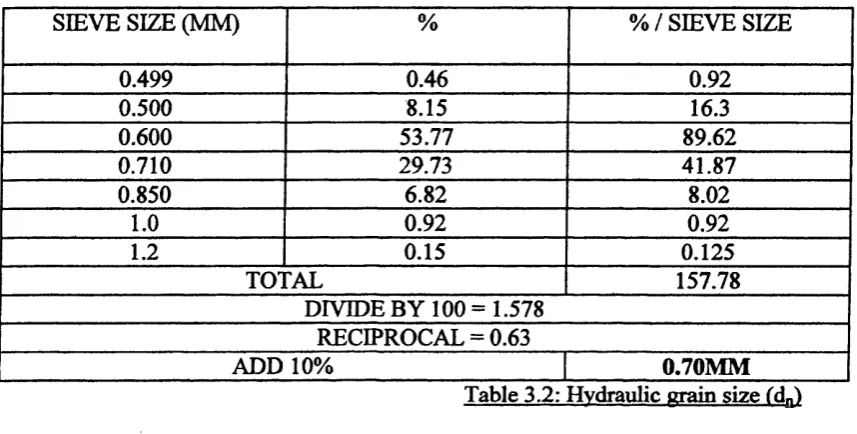
3.2: Hydraulic grain size (dn) 77
3.3: Clean bed headloss values 78
3.4: Kaolin dosing rates 80
3.5: Particle size analysis using both old and new particle counters 83
3.6: Floe development using alum at varying water temperatures 84
3.7: Floe development using PAX at varying water temperatures 86
5.1: Jar tests using alum at different water temperatures 154
5.2: Jar tests using PAX at different water temperatures 155
5.3: Maximum shear stress values during flow changes 162
1
INTRODUCTION
Drinking water treatment is a complex process and relies on the correct operation of
each stage of the process in order to provide high quality potable water.
The basic processes involved in water treatment are; screening to remove large
objects such as leaves, chemical dosing to destabilise the suspended particles in the
water, sedimentation to remove the majority of particles, filtration to remove the
remaining particles and finally disinfection to kill any remaining pathogens. These
processes vary from plant to plant, and additional stages such as dissolved air flotation
(DAF) and secondary filtration maybe used where required. All of these stages
collectively strive to provide water that meets ever increasingly stringent standards.
Water quality issues have been raised in the public domain with several highly
publicised outbreaks of waterborne diseases, Cryptosporidiosis in particular. These
outbreaks, such as those in Swindon in 1988 and Milwaukee 1993, caused a large
overhaul in water standards, and the publication of 2 Badenoch reports which
suggested new working practices for water treatment plants. However, the latest
Cryptosporidiosis outbreak in Glasgow in August 2002, suggests that there is still
more to be done to ensure that the water consumed is of the highest quality possible.
One of the most important processes is the filtration stage, especially when
considering the fact that Cryptosporidium is resistant to most forms of disinfection.
Filtration involves passing pre-treated water through a bed of granular material which
removes the suspended particles as the water flows by. This immediately gives the
impression of the granular media sieving the sediment out of the water. However, in
so it is actually a more complex process of interactions between the particles and the
grains, whereby van der Waals and electrostatic forces attract the particles.
The media is contained within structures so that the water flows down under
gravitational forces through approximately Im of media. This depth is usually
sufficient to provide satisfactory filtration. There are several types o f granular media
that can be used, for example sand, anthracite and granular activated carbon (GAC).
The type chosen is usually specific to the needs of the individual plant.
There are many factors that can affect the performance of the filtration process, and
great care must be taken when designing the filtration system to ensure optimal
operation. These factors include the amount of solids going onto the filter (i.e. the
solid loading), the flow rate of the influent suspension, and whether this rate is subject
to fluctuations, the type and dose of coagulant used and finally the influent water
temperature. Some of these factors will be investigated in more detail in this project.
Filters cannot continue to provide high quality water indefinitely, and after a certain
time either the headloss reaches unacceptably high levels (due to the particles
clogging the media pores), or particle breakthrough levels rise as floes are detached
fi*om within the filter and removed into the effluent. When either of these occurs, the
filter must be cleaned. There are several methods of backwashing the filter, (as
described in more detail in chapter 2.3) but all generally involve passing water and/or
air back up through the filter to remove the particles that have coated the media
grains. The efficiency of this process greatly influences the subsequent performance
of the filter, because if the media is not cleaned properly, the remaining solids left in
Once the correct design and cleaning processes have been established, the filter
should be able to cope well with a range of influent conditions, and provide high
quality water during normal operation. What remains less clear is how well the
filtration process copes during periods of unstable operation, i.e. flow changes and
external effects such as vibrations. This research is intended to provide this
information, and will investigate at a range of levels, firom computer simulations to
full-scale studies.
1.1; Aims of the research project
There have been many studies over the past 4 decades to investigate various aspects
of the filtration system, and the overall process of particle capture is fairly well
known. However one area where there has not been extensive investigation is what
happens to the particles within the filter during a flow change, and which flow
changes cause most breakthrough.
The main aim of this project was to investigate the effects of flow changes on the
filter performance as a whole, and the objective was to introduce several different
types of flow change on a laboratory filter column and record the subsequent particle
breakthrough.
Special attention was paid to the 2-5 pm size range as this represents the
Cryptosporidium size range, and the reduction of potential outbreaks of
Cryptosporidiosis was the driving force behind this research. However, as pathogens
oocysts were actually used in this study, due to the inability to inactivate and fluoresce
the cysts themselves in the laboratory. In this respect, only the potential risk of a
Cryptosporidium outbreak could be assessed, based on the fact that at full-scale plants,
particle breakthrough in this size range could be oocysts.
As well as performing filter runs on the laboratory column, additional processes were
investigated, such as coagulation at a range of temperatures, and floe development
both before and within the filter. The results of which would assist in providing a
comprehensive view of particle breakthrough under a range of process variables.
Another aim of the research was to see how the laboratory results could be compared
to full-scale operation. This involved spending time at several water treatment works
and recording the breakthrough patterns of the filters. In addition, for every
laboratory run performed, a corresponding run was carried out on a computer
simulation model, Filterflex. The results evaluated whether the model could
successfully be used as a predictive tool for filter breakthrough.
Initially, the desired outcome of the project was to provide some operational
parameters that could be used at treatment plants to introduce flow changes (created
by backwashing and increases in demand) in such a way as to limit the amount of
additional breakthrough.
As the project progressed, it became clear that this would not be possible as there
were too many variables that could affect the shedding. The research changed tack
slightly to provide a thorough investigation of the processes before, during and within
the filtration cycle that cause breakthrough, and how floes behave during flow
2
LITERATURE REVIEW
The filtration process is arguably the most important part of water treatment. There
are a number of variables which can affect the efficiency of the filter. Within the
filter itself, the media type and size used, the backwashing regime, and the influent
flow rate are all important. Similarly, the processes preceding the filter, such as
coagulant choice and dosing rate must be optimised to aid the filter operation. All of
these processes must work in conjunction with each other to provide high quality
water. This chapter explains these processes in more detail, along with the methods
used to monitor the effluent water.
2.1: Types of filters and filtration processes
Filtration of suspensions through porous media is an important stage in the treatment
of potable water to achieve final clarification (Tebbutt, 1992).
There are two main types of filter. Slow Sand Filters (SSF) and Rapid Gravity Filters
(RGF). SSFs however are less fi*equently used in modem potable water companies, as
they are slow and take up a large area (having said this, they are still used successfully
by Thames Water in the UK). They may be suited to developing countries as they use
low technology. In drinking water treatment plants, rapid gravity filters are designed
to function as depth filtration units (Amirtharajah, 1988). Filtration is a widely
researched and documented operation, fi’om early pioneers in the field such as
Cleasby and Ives in the 1960’s, who worked on the basic concepts of filtration, to
today’s researchers such as Carlson and Johnson (2001), who use the latest
Amirtharajah (1988) wrote a comprehensive review concerning filtration mechanisms.
He reported that filter performance is influenced by many factors such as the physical
and chemical characteristics o f the filter media, the suspension flowing through it, as
well as the operational practices o f the filter itself. In general the particles in
suspension are much smaller than the media pores, in most cases the pores are 100 -
1000 tim es larger than the particles themselves, and so it is obvious that it is not just a
case o f the particles being unable to pass through the pores. Instead, other forces must
be acting upon the particles for them to be held in the filter.
Amirtharajah stated that the particles attach to the filter media either by electrostatic
interactions, Van der Waals forces or chemical interactions. Once the particles slow
down on approaching a media grain, they are captured by these forces and then they
too act as collectors. Ives (1982) illustrated that for particles to be collected, they
must first cross through the streamlines around the media grains and that for water
filtration, diffusion and sedimentation are the most important transport mechanisms.
This is illustrated by (2) and (3) in Fig. 2.1.
I-3 3 4
Diffusion is more likely to affect those particles <lpm as it results from Brownian
motion of the water molecules, pushing the particle close enough to the collector.
Sedimentation however is a function of gravity and the settling velocity of the
particle, causing it to cut through the streamlines. This process requires particles of a
larger and denser nature and so sizes >lpm are more likely to be trapped by this
method.
Filtration is by no means a static process. There are several stages that a filter goes
through within a single run, and many factors can affect the duration and overall
outcome within these stages, such as water flow rates and influent water quality.
Filter ripening is a well known process. Clark et a l (1992) stated that ripening is the
increase in removal efficiency that occurs for some time after each backwash (This is
the process of cleaning the filter and is discussed in more detail in section 2.3). This
occurs because particles becoming attached to the filter media aid in the subsequent
collection of other particles, thus improving the overall effluent quality. It is well
documented that effluent quality is much higher after approximately the first hour of
the filter run and that this quality is then maintained for some time before
deteriorating (Amirtharajah and Wetstein, 1980).
Clark et a l (1992) examined this efficiency in more detail by designing experiments
to analyse the effects of particle and media size on removal. They found that the
effluent particle size distribution varied over the duration of the filter run, a result
which is masked by only taking turbidity measurements. Particle sizes between 6pm
and 13 pm were least likely to be removed by the filter. The identification of removal
pathogenic organism outbreaks, as they usually have a distinct size range, although
the pathogens can also be contained within larger floes. It was also found that large
media sizes resulted in low effluent quality, although removal occurred at greater
depths. This result suggested that multiple layers of different media sizes are
preferable (Moran et a l 1993).
It is the early stages of filtration that are of great concern as studies suggest that >90%
of particles that pass through a filter do so during the initial stages (Amirtharajah
1988). However, ripening and subsequent high quality filtration does not continue
indefinitely. Moran et a l (1993) and many others have conducted experiments to
show that after a certain length of time, the effluent quality starts to deteriorate and
this can be attributed to breakthrough.
Breakthrough is a function of two factors, reduction in particle attachment efficiency
and particle detachment. The latter factor has been qualitatively analysed by Ives
(1989) and others and in all cases, the media grains were observed to firstly
accumulate sediment largely on the top of the grains. As more particles were
deposited, the accumulations became unstable and were detached. This process
continued throughout the depth of the filter, eventually leading to breakthrough into
the effluent. Clark et al (1992) stated that detachment occurs in the later stages of
filtration as a build up of particles within the media causes interstitial velocities to
increase so that shear forces overcome the attachment forces. Previous studies were
unable to differentiate between detached particles and those passing straight through
the filter firom the influent water. Moran et a l (1993) however, carried out an
experiment in which the influent water was switched to reduced particle water during
attributed to detachment. (An implication of this could be that any Cryptosporidium
initially removed by the filter could be re-entrained into the effluent.) The result was
that the concentrations of all particle sizes >1.4pm increased after the reduced
suspension was passed through the filter and they concluded that detachment of
previously retained particles and floes is probably the dominant factor of filter
breakthrough. Filter stability is a dynamic process that requires additional particles to
maintain the balance and so was reduced when clean water was passed through the
filter. The actual processes that lead to detachment, such as fluid drag forces, are
dealt with in more detail in section 2.5.
Most importantly for this study, they noted that the preferential size for particle
detachment is 3 -7pm, which includes the size of Cryptosporidium oocysts. Despite
this, detachment appeared to decrease with bed depth so deep media beds may prevent
actual breakthrough as detached particles are re-captured before passing out of the
filter bed (Moran et al, 1993). However, beds that are too deep will become
uneconomical in terms of both construction and media costs, and also backwash water
volumes.
The size distribution of particles during filtration has been studied in greater detail by
Mackie and Bai (1993). They conducted experiments using suspensions of varying
particle size distributions. They concluded that the size distribution of the influent
suspension is very important for the efficiency of the filter. They found that the
presence of larger particles aids in the removal of the smaller ones, as they speed up
initial filter ripening (and thus efficiency). They also concluded that finer particles
cause more rapid headloss development. Although this tends to even out when taken
as using headloss curves from the top layer of the filter alone will prove inaccurate
when applied to the whole bed.
A mathematical model has been developed by Stevenson (1997a), which is based on
the Kozeny-Carman equation and aims to predict particle behaviour and detachment
during filtration. Both voidage and particle size distribution are included to provide a
more realistic model, and shear stress values determine whether deposition occurs or
not. The results produce similar features to real filters, such as the development of
“wormholes”. This model has been incorporated into a PC software program in
BASIC, MFLX (Multilayer flexible model, now called Filterflex), which will be used
to compare theoretical results with the findings of this study. This is discussed in more
detail in section 2.12 and Chapter 3.8.
2.2: Media Properties
Before filtration can take place, the correct media type must be chosen for the specific
task in hand. There are several factors which dictate the choice of media, for example
cost and backwashing procedures. There are four main types of media commonly
used:
• Sand
• Anthracite
• Gravel (Although only as a support medium)
• GAC
Sand is the most common granular media used as it is readily available, and so
found in the optimum size range, which has been quoted as 0.5 - 1mm for rapid
gravity filters (Stevenson, 1994). Another benefit of sand is that it is very
hardwearing and so withstands attrition during backwashing, resulting in no reduction
in grain size (Humby and Fitzpatrick, 1996). It has been reported in some literature
that sand grains are rounded and that filter performance is enhanced by this fact.
However, in reality, some angularity in the grains is inevitable and this may actually
benefit filtration rates due to the altered voidage within the filter (Stevenson, 1997b).
It will also increase the surface area available for attachment.
Anthracite grains are produced by crushing massive amounts of the material until a
suitable size is achieved. This is not an exact procedure and so a wide range of grain
sizes will be produced, not all of which will be suitable for use in filtration. This
makes it slightly more expensive than sand, but is often used in conjunction with sand
for dual media beds.
Gravel is used, although mainly to support the sand or other media and prevent it
being washed out. Several grain size grades can be used, although traditional bed
design with separate air scour backwash will often only use one size of gravel to
prevent sand entering the air nozzles.
Finally, Granular Activated Carbon (GAC) can be used as an alternative to sand,
although it is predominantly used as an absorbent. It is more friable than sand and
anthracite, but it is a lightweight material that copes well with normal filtration
conditions. However it performs less well under backwashing conditions as it has a
tendency to break up and be carried away with the wash water as it has such a low
Also used as media are:
Garnet - This is used in triple media filters in conjunction with sand and anthracite.
(This was favoured by Anglian Water in the early 1990’s and these filters are still in
operation today).
Shale and Lytag - Used in Biologically Aerated Filters, BAF’s.
Bone Char - This is used for adsorption rather than solids removal and is a type of
GAG.
All of these materials, (with the exception of GAG), are fairly cheap when compared
to synthetic media as they are mostly naturally occurring. However, a filter currently
being developed, which uses a synthetic porous media and boasts impressive results in
terms of filtration rates and economical backwashing, may offset the higher costs of
the media. The media itself is unusual in that it is porous and so the suspension flows
both around and through the media grains. The media is compressible and so the bed
properties can be modified to suit the suspension to be filtered. Results have shown
similar turbidity removal levels to conventional filters but at 6 times the flow rate, and
backwashing which requires 2% water compared to 6-15% for granular media
(Galiskaner et a l, 1999). This improved particle removal has been confirmed by
Gimbel et a l (2000), who conducted similar studies with Permeable Synthetic
Collectors (PSGs), which are constructed fi*om open porous plastic foam or non
woven fabrics o f millimetre dimensions. Although he was looking at waste water
The size o f the media grains used depends mostly on the suspension to be filtered.
Large grains will provide a lower headloss due to the larger pores, but only smaller
grains are suitable for removal of smaller particles. Clark et ah (1992) found that
media grains larger than 3.7mm diameter filtered no particles at all. Clearly, careful
planning is required to provide a suitable media size.
Voidage (which can also be referred to as porosity), is the space between the grains
expressed as a fraction of the total bed volume (Stevenson, 1997). It is these spaces
where particles are trapped and the voidage partly determines the headloss caused by
the suspension flowing through the grains. Each type of media has a different
voidage; sand has a range of 36-43%, whereas anthracite ranges from 41-50% as it is
more angular and so does not fit as tightly together. The voidage also varies
depending on the state of the filter, i.e. whether the media has just been put in, or been
backwashed, or has been subjected to air scour.
It can be seen that each type and size of media can be used for a specific purpose.
However, it is common practice to incorporate more than one size and/or type of grain
into the filter to provide a wider range of function and so improve the overall
performance of the filter. These are called multi-media filters and usually comprise of
two types of media although sometimes three are used.
The grains are put into the filter in layers without any barrier between them, and
ideally the grading becomes finer in the direction of flow. This is achieved by using
larger grained material that is of a lower density than the fine-grained media so that it
rests on top of it. The lower density of the larger grained material also means that
the less dense media will be carried to the top of the media bed. A common example
of this is anthracite on top of sand. This grading has the benefit that the anthracite has
larger voids (due to the larger grains), and so has a large particle holding capacity, and
allows longer filter runs to be maintained, whilst the sand provides the finer filtration
and so produces high quality effluent without excessive headloss. This also prevents
undesirable surface filtration.
However, dual media filters have to utilise the same space within the filter as one
media type would occupy and so in effect, both media beds are halved in depth. This
could have consequences for the effluent quality (Stevenson, 1997). A recent full-
scale experiment was carried out in Philadelphia, USA, whereby the media in four
dual media filters was replaced with identical sand and gravel, but with anthracite of
differing uniformity coefficients, (UC). The results showed that the lower the UC, the
longer the filter runs, by as much as 50%, and the fewer backwashes required
throughout the year’s trial. The filter efficiency in terms of removal was also
superior, with up to 38% better removal in the 2-5pm range (Yohe et AL 2002). This
is likely to be due to less stratification of the anthracite with a lower UC.
Backwashing of dual media filters needs more careful design as the anthracite tends to
be lost and it is more expensive to replace than sand. The cost of replacing the media
is an important consideration, as a recent study by Rhaly et a/. (2000) found that the
filter efficiency of dual media beds at a water treatment plant decreased by 10% in 4
years. The filters were all identical in design and usage, and the reduction in
retaining the sediment. This maybe an anomalous set of results, as four years is a
unusually short time span for hard wearing materials such as sand to degrade.
There have been several experiments to test the benefits of triple media beds and even
those testing five layers (Fox and Metcalf, 1974). However, the general consensus is
that adding more layers does not automatically improve filtrate quality and that a well
designed and operated dual media filter will provide results similar to single bed
filters with longer run times (Cleasby, 1990). This is a somewhat simplistic view, as
there are so many factors and variables to consider at each plant, and even within the
plants themselves.
It is clear that filter media must be chosen carefully to ensure high quality filtration at
reasonable cost, and to construct the beds sensibly so as to avoid high backwashing
losses. This however can be reduced by the good design of wash out weirs and the
2.3; Backwashing
Backwashing is the process of cleaning the filter bed after each filtration run to
remove the particles from the bed itself. Fitzpatrick (1998), stated that this is done
every 24 - 48 hours on average (although during this study, filter runs of up to 120h
were observed at the full scale plants) and involves reversing the flow of water
upwards through the bed. Filters used in direct filtration application, i.e. without an
upstream clarification process such as flotation or sedimentation, however, can have a
much shorter run time of between 6-12 hours, depending on the load (Ostrowski, J.
Pers. Comm. 2000).
The effectiveness of the backwashing is important as it dictates to a large extent the
immediate effluent quality of the next run (Cleasby et al, 1975, Amirtharajah, 1993).
Cleasby and Logsdon, (1999), have also stated that the backwashing system is the
most frequent cause of filter failure. Suggestions have been made by Kawamura
(1991) that backwashing sequences at plants are too long and are detrimental to the
filter by prolonging the ripening period of the following run. Caution must be taken
with this view, as any sediment left in the filter is likely to cause a turbidity spike in
the short term, and in the longer term cause “mudballing” within the filter.
In the past there have been three main methods of backwashing, firstly with water
alone, secondly using air scour and thirdly a combination of the two (Tebbutt, 1992).
Water washing is very ineffective in cleaning the bed and over the last two decades,
water washing combined with air scour has shown to be the more effective. There are
two main regimes for this, for example separate air scour backwash - “SASBW”, and
together, finished off with a water only rinse. Amirtharajah (1993) reported on the
progress and performance of combination backwashing, in which he outlined the
mechanisms of the process and also optimum parameters for effective cleaning.
Another important consideration for successful filter cleaning is the design of the
washwater system. This is plant specific and there are many variables to consider.
Washout troughs are located either to one side or in the middle of the filter bed. These
may contain baffles to help retain the media, and/or siphons to speed drain down
times. There may be surface jets positioned to aid the movement of the sediment into
the washout troughs. The height of the trough determines how much bed expansion
can occur during backwashing, and this varies widely between plants. Some plants
leave only 0.15m between the expanded media and the trough, whereas others have a
gap of over 1.5 metres (Logsdon et al. 2000). All of these factors must be considered
when designing a backwash system, and as always, a balance must be made between
cost and filter efficiency.
Fluidisation occurs when the backwash water balances the weight of the media grains
(Fitzpatrick, 1998) and so flow rate is occasionally expressed as a percentage of the
minimum fluidisation velocity (Vmf). This enables patterns and characteristics to be
expressed quantitatively. Amirtharajah (1993) reported on different phases of air
motion by considering the airflow rate to be fixed and to vary the water flow rate fi’om
0 to 100%Vmf. He found that at low velocities (<10%Vmf) the air bubbles moved
through the media with little disturbance to the grains. At 10 - 20% Vmf air cavities
form and expand, and at 25 - 50% Vmf, air cavities formed on top of each other,
This activity caused the greatest amount of abrasion among the media grains and thus
the greatest detachment of particles. At higher velocities, as the bed approaches
fluidisation, this phenomenon reduces and at 100% Vmf air is able to move freely
through the bed.
Fig. 2.2 shows the passage of air through the filter at varying velocities, including
those which induce collapse pulsing, and Fig. 2.3 illustrates the grain motion during
this air scour.
i r r
(a) -7^
l^»w c«*apwiekhig
o
6
«
A
A
a
o
&
C)
• f
••
a
I—
---
- O
-
---- ^ --
A
<•)
Abot CeOi^?u2aL-i|
Fig. 2.2 Schematic of air motion corresponding to conditions below, at
WAtar flow
V - 0 - 10
#*nd fifaîna V - 1 0 - 2 9 %V_
air motion a# channel
ir orifice sir motion as bubbles
40:
(ormaAon of jraarra<i:gofTiant cavity and compression
Qt «and çrajns
lb)
rapiort o f Stagnent w a t« f
formation of air channels above cavtty
air cavrty fi^ld flow much lafQer thnni^h than çrû»ns
Ischemattel V •» t o - 2 0
fc]
region wnare send is being com pressed
form ation o f new bubble above
V ^ 2 /
\ J —^ «and slip lines
145 ^
«Ir cavity coiiepsing
sand collapsing
voder actHvQ
Renklne sta te
at and of coDapeo and slwrt of poising, air Cavity site simitar to send grains
sand sw esses under active Rsnktne state
swfatt* tar.siciA fwpw
doe to m enisci Id pores
pore w ater pressure V = 2 5 - 5 0
tdl (B]
Fig. 2.3: Microscopic view of air cavities and sand grains during air scour
(Amirtharaiah. 1993)
Fitzpatrick (1993) has taken these observations further with the use of video
endoscopy (which is reviewed in more detail in section 2.9). Her experiments
water with air combinations for both clean and clogged beds. For experiments using
water alone, it was found that up to 50%Vmf, no grain movement was observed but after that, it was random and jerky. Clogging the bed with kaolin reduced the required
velocity to produce movement due to smaller pore spaces.
Once the bed was fully fluidised, all loosened deposits were flushed out and grains
were observed to have random velocities and direction due to uneven washwater
distribution.
Air scour alone was observed to only activate the top few centimetres of the filter bed,
although some parts of the bed were left unmoved as the air rose through distinct
passages (Fitzpatrick, 1993, Amirtharajah, 1984, 1993). This resulted in ineffective
filter cleaning. Collapse-pulsing was observed to be the most efficient backwashing
mechanism with grains moving in a highly agitated state and good bed circulation
ensuring that all deposits were detached and removed. This reinforced Amirtharajah’s
earlier observations. It also provided the most economical procedure as it requires the
least wash water and after 1 - 2 minutes of collapse - pulsing, all grains were
observed to be fi-ee of deposits. Fitzpatrick recommended that backwashing with air
and water should be followed by a short fluidising wash to flush out all the trapped air
and remaining deposits. This fluidising value will vary, dependent on the temperature
of the water. Warm water has a lower viscosity, and so will require a higher water
rate to provide the same amount of expansion. The temperature should be monitored
so that there is sufficient flow for fluidisation, but that it is not so great as to wash
media out into the troughs. This also has implications for the amount of washwater
used. In warmer periods, if the backwash times remain the same, more water will have
have sufficient capacity for this extra water, as failure to do so will limit the
productivity of the plant (Logsdon et al. 2000).
The use of video also enabled the forces acting on the grains to be observed. Fluid
shear forces were found to be dominant during backwashing (Ives and Clough, 1985,
Fitzpatrick, 1993). This force cannot increase beyond fluidisation however so other
means of increasing the force are required. Fitzpatrick found that when air/water
backwashing is at the collapse - pulsing stage, the bed itself contracts, thus reducing
porosity and so increasing the fluid shear forces.
Another parameter on the effectiveness of backwashing is the characteristics of the
filter media. Fitzpatrick (1998) reported on the bed behaviour of different filter media
during backwashing. The media investigated was Granular Activated Carbon (GAC),
anthracite, garnet and sand, alone and in multi layers. One observation was that
collapse - pulsing caused destratification which is only rectified upon full fluidisation.
Also, collapse - pulsing causes attrition among the grains, which reduces grain size
and careful filter design is required to prevent finer filter material being lost over the
backwash overflow. GAC was observed to suffer the highest percent loss due to
attrition. Obviously, careful consideration is needed both in the media type used, and
also the filter design itself to ensure optimum, backwashing conditions with minimal
media losses.
Dual media experiments have also been conducted at plant in Atlanta, Georgia, to
aQa^ + %(Vmf) = b where Qa is the air flow rate %(Vmf) is the water flow rate a and b are constants.
The experiments confirmed that this general model is successful in predicting collapse
- pulsing conditions and concludes that it is the most effective filter cleaning
mechanism.
Hall and Fitzpatrick (1998) have also developed a mathematical backwash model,
focusing on the operational requirements (i.e. the volume of deposit to be removed)
based on a fluidising water wash. Two phases of the backwash process were noted,
the transient phase whereby the bed expands as it becomes fluidised. Deposits are
moved into suspension as the grains are moved apart. The steady state occurs after
full fluidisation and where deposits are detached by water shear, which is then flushed
from the layer. Volumes of deposit within the media layers were algebraically
calculated, and a backwash model was formulated from which it is possible to
determine the volume of deposit remaining within the filter at any one time. The
obvious downfall to this model is that it is for water wash only and does not make any
allowance for air scour. It could however be applied during the final fluidisation
period of an air/water backwash. Alternatively, it could be modified in some way to
allow for air/water conditions.
Several studies, for example Koudjonou et al (1999), have focused on the
backwashing process with regard to filtrate quality. Several experiments were
conducted, analysing a combination of air scour and water wash durations, as well as
slow start up procedures following the backwash. They concluded that prolonged air
scour during backwashing causes increased turbidity at the filter start up, unless extra
Slow start up produced higher quality filtrate although there was no significant
improvement with a 20 minute slow start compared to a 10 minute start up. Overall
they recommended that for high quality effluent, the best combination was a delay
after backwashing followed by a slow start. However, there is no mention of the
economics of such a procedure, especially when considering a plant with a high water
demand. A previous study by Colton et al (1996) conducted similar experiments and
found that the media size could influence the effectiveness of the backwashing. Four
minutes of collapse pulsing was found to be optimal for 16/30 sand, after which the
subsequent filtrate quality actually decreased. However, when 5/8 sand was used, the
longer periods of collapse pulsing improved the filtrate quality. They also confirmed
that slow start up procedures improved the performance of the filter, but that as with
the collapse pulsing, the optimum duration of the slow start depended on the media
size.
Another common option is to adopt a “filter to waste” practice for the first 10-20
minutes of filtration. This ensures that the water has a much lower turbidity when put
back into service and eliminates the chance of residual particles in the backwash
remnants passing into supply. Burris et a l (1998) recommended that if the filter to
waste period required is longer than 20 minutes, the backwashing process in general
needs to be reviewed, as too much water is being wasted.
To reduce the amount of water wasted in treatment works, many recycle the backwash
water back into the plant. This has as many complications as it does benefits, and is
very site specific. Cornwall and Lee (1993) found that Giardia and Cryptosporidium
several options for the treatment of the washwater. These include returning it to the
head of the works, sending it to the sewage treatment processes, and in some cases it
can be disposed of in surface waters (although this is strictly controlled and licensed)
(Logsdon et al, 2000).
The UKWIR report (1998) made several recommendations on the treatment and usage
of the recycled wash water, which included settling, to remove at least 90% of the
solids, continuous turbidity monitoring and only allowing recycle water to constitute
10% of the total raw water.
2.4; Coagulation
A coagulation process is used in most water treatment plants. It involves adding
chemicals to the water prior to filtration to destabilise suspended particles which
would otherwise not settle, float or filter. Flocculation follows coagulation and is the
agglomeration of the destabilised particles into larger floes. The characteristics of
these floes depend on the nature of the particles and the coagulant used.
Coagulants are mainly added to increase the particle size. This is done in two ways,
charge neutralisation arid sweep flocculation. The first mechanism involves
neutralising the surface charge of the particle, characterised by the zeta potential, to
reduce repulsion with other particles and also with the media grains themselves. The
zeta potential is usually negative and ranges fi’om -10 to —40mV. Around the
particles themselves is a region of oppositely charged ions, so as to balance the
charge. The thickness of this cloud varies, in Thames water, it is approximately 4nm,
is this that must be reduced in order to allow particles to attract (Gregory, 1975).
Metal salts (such as iron and aluminium, discussed below) give highly charged
cationic hydrolysis products which are readily absorbed on the negative particles and
thus cause destabilisation and the coalescence of the particles.
The second mechanism, “sweep flocculation” is widely thought to be a more effective
means of achieving particle removal (Duan and Gregory, 2002). This method
involves adding considerably higher amounts of metal coagulants than are required
for just charge neutralisation. The increased solids concentration causes a more rapid
growth of the hydroxide precipitate, into which particles in the water become
incorporated and so are effectively removed from the water. As the hydroxide
precipitates have a large, open structure, it increases the chance of more particles
becoming captured. Overall, it has been found that floes develop more rapidly and to
a larger size when sweep flocculation is employed, and so a greater reduction in
turbidity can be achieved.
There are two main types of coagulants commonly used, metal coagulants and
polyelectrolytes, and these shall be discussed here.
Metal coagulants are either based on aluminium or iron and are popular due to their
effectiveness, availability and low cost.
Aluminium sulphate (alum) is the most commonly used and is manufactured from the
digestion of bauxite in sulphuric acid. Polyaluminium chloride (PACl) however, is a
newer coagulant and is made by controlled neutralisation and hydrolysis of alum
benefits of only requiring half the amount of alum to produce similar turbidity
removal levels (Bratby, 1980). This has been confirmed in a study carried out in
Mexico, whereby wastewater is chemically treated to provide agricultural irrigation
water. Jar tests were carried out and particle size distributions were obtained for
several concentrations of alum and PACl. Results showed optimum solids removal
was achieved with 30mg/l PACl whereas 50mg/l alum was required to produce
similar removal results (Mejia & Cisneros, 2000). PACl also is reported to have
superior performance at lower temperatures and results in a lower production of
sludge (Gregory & Rossi, 2001). Another use of PACl, which has been investigated
by Ebie et al (2002), is to pre-coat the filter media. Their experiments have reported
particulate removal rates of 99.7% on average over 20h pilot scale runs. This was
observed when a 20mg/L PACl coating solution was used in conjunction with 3mg/L
dosing in the influent, thus increasing the zeta potential of the media (similar to
studies carried out by Shaw et a l (2000). No mention was made to state whether the
coating could withstand backwashing, which would increase operational costs. A
balance would need to be made between these costs and the benefits of higher quality
water. However, this is a technique which shows encouraging results for enhancing
overall filter performance.
Ferric coagulants are used over a wide range of pH values from 4 to 11. fron
coagulants are preferable to alum in high pH areas. Ferric sulphate is also good at
Polyelectrolytes are a variety of water soluble, macro-molecules which can enhance
flocculation. They can be natural or synthetic. They are special polymers that have
the ability to be ionised and are especially useful in highly turbid waters.
Activated Sihca was the first polyelectrolyte to be used but it has the disadvantage
that if it is not prepared properly, silica gel forms which can block pumps and pipes
and leads to reduced filter run time (Robinson, 1974). Synthetic polyelectrolytes are
usually supplied as granular or fine dust powder or as liquid, since solid forms do not
totally dissolve. Another problem with synthetic polyelectrolytes is that they can be
highly toxic in large doses. For this reason there are regularly published lists of
approved products and concentration limits.
Shelton and Drewry (1973) and others found that using metal coagulants in
conjunction with polyelectrolytes resulted in better floe characteristics and subsequent
removal. In this context, the polyelectrolytes are flocculant aids and suitably alter the
floes, in terms of size, density and shear strength.
However, experiments by Graham et al. (1992) used alum with a polymer to analyse
colour removal during filtration. They found that all combinations of coagulants were
less effective in removing colour than using alum alone. It has to ultimately be a
decision taken at individual plant level, dependent on the influent water quality.
Once the coagulant has been added, flocculation takes place. There are two stages,
perikinetic flocculation, and orthokinetic flocculation. Perikinetic flocculation arises
fi*om Brownian motion and continues only for a few seconds until the floes are too
large to be affected by Brownian motion. Orthokinetic flocculation is due to induced
velocity gradients in the liquid which set up relative velocities between the particles
the water is a result of either flow or paddle action. Tambo and Hozumi (1979),
suggested that turbulent flow produces a floe collision rate far greater than that for
laminar flow, and experiments conducted by Dyer & Manning (1999) suggest that
although low shear aids flocculation, higher shear rates cause floe disintegration and
reduced settling velocities. This suggests there is an optimum shear rate for
flocculation, which depends on the many parameters for each individual situation.
Once it has been decided which coagulant is to be added, tests must be performed to
establish the correct dose to achieve optimum flocculation. There are many variables
which can affect this, for example the pH of the water and the suspension
concentration to be filtered.
Jar tests are most commonly used and this involves adding varying quantities of the
coagulant to separate beakers of approximately 1 litre capacity. The beakers are
connected to multi-speed stirrers and the results are judged on a variety of criteria,
depending on the specific use of the coagulant, i.e. floe volume, density, speed of floe
formation, settlement or flotation rate, or filtrate quality after granular filtration. This
latter criteria is of most importance in this study. The jar tests usually predict very
closely the plant or pilot scale performance.
Recent experiments have analysed the effects of coagulation on Cryptosporidium
removal during filtration and all have indicated that coagulation aids in the removal
process. Ives (1995) suggested that, prior to coagulation, Cryptosporidium oocysts lie
very close to the minimum size for effective filtration but that after flocculation, the
Hall et al. (1995) conducted experiments using both ferric sulphate and alum to
investigate Cryptosporidium removal and concluded that the coagulants are very
important and that alum was especially efficient in removing Cryptosporidium.
Ongerth and Pecoraro (1995) also found that by using sub-optimum coagulation
doses, Cryptosporidium removal dropped fi*om 3 logs to 1.5 logs, which represents
strong evidence in favour of carefully monitored coagulation and flocculation.
The most recent research has been conducted by Coffey et al. (1999) and Huck et al.
(2000). They analysed coagulation conditions with regard to Cryptosporidium
parvum and Bacillus subtilis removal. They concluded that even when the influent
turbidity is less than 0.3 NTU, filtration performance will deteriorate if coagulation is
not optimised. They also found that Cryptosporidium removal is more sensitive to
coagulant conditions than Bacillus and that particle counting was more effective than
using turbidity measurements.
An alternative to chemical dosing, which is beginning to be used in treatment plants,
is electrocoagulation. This involves the electrolysis of aluminium rather than adding
alum salts. This has several advantages, such as a reduction in sludge production and
no need for specialist chemical handling (Han et al. 2002).
Experiments have been carried out at laboratory scale, comparing both types of
coagulation, to investigate the efficiency of electrocoagulation in turbidity removal at
a range of pH values. The results suggest that a lower aluminium dose was required
to achieve the same amount of turbidity removal with electrocoagulation, and that it
was less sensitive to changes in pH, which makes it a more robust coagulation process
type of coagulation, more research is required to establish its performance under a
wider range of process conditions.
These recent research papers confirm the importance of the coagulation process and at
plant scale, successful Cryptosporidium removal is unlikely to occur with direct
filtration alone, and so optimised coagulation is vital, be it through electrolysis or
chemically induced.
2.5; Shear Stress
Fluids, by their very nature, continually react to forces acting upon them by deforming
and flowing. Forces acting tangentially to the fluid surface are called shearing forces.
Shear stresses arise due to the fact that fluid will adhere to any surface it flows past.
This causes a velocity gradient to be set up with each successive layer of fluid moving
faster than the layer immediately beneath it.
Shear stress is an important mechanism of particle detachment in filtration, and
several papers have analysed this detachment, especially with regard to backwashing.
Detachment of particles fi*om media grains requires the hydrodynamic forces, drag
and lift, to overcome the adhesive forces. Drag is the force on the particle acting in the
direction of flow whereas lift forces act normally to the flow and so move the particle
away from the media grain or filter wall (Raveendran and Amirtharajah, 1995).
It is known that shear stress increases with flow velocity and so when backwashing a
filter, it is advisable to use high flow rates as this causes unstable particles to detach
However, this would immediately suggest a potential problem with normal flow
filtration, as an increase in flow rates may cause particles to detach in the downward
direction and ultimately lead to breakthrough.
This is highlighted by the basic shear stress equation;
T = p dw/dy Where x is shear stress p is fluid viscosity
du/dy is the velocity gradient. (Ives and Fitzpatrick 1989)
Although this only strictly applies to laminar flow, it shows that velocity is directly
responsible for shear stress. Other equations can also be used to show velocity
gradients are an important factor in the resultant shear stress, for both laminar and
turbulent flow.
These have also been reported by Ives and Fitzpatrick (1989), and firstly the
power/fluid volume must be calculated from the following equation;
PA^ = pgQH/eAL (W m'^) p = Water density kgm'^ G = Mean velocity gradient s'^ Q = Volumetric flow rate m^s'^
€ = Porosity of sand A = Plan area of filter m^ L = Length of filter bed m
This can then be used in the next equation to calculate the mean shear stress,
providing the current porosity of the media is known.
Shear stress T =(PpAO*^^ T = Shear Stress Nm'^
p = Dynamic viscosity of water Nsm'^ P = Power dissipated in fluid shear W V = Volume of water in pores m^
Ives and Fitzpatrick (1989) also found that the type of deposit affects the amount of
detachment by fluid shear, for example kaolin flocculated with aluminium hydroxide
was more easily sheared than kaolin alone. Raveendran and Amirtharajah (1995)