Construction and Initial Characterization of
the Densin Knockout Mouse
Thesis by
Andrew G.A. Medina-Marino
In Partial Fulfillment of the Requirements
for the Degree of
Doctor of Philosophy
California Institute of Technology
Pasadena, CA 91125
© 2009
To my parents, Olga and Gabriel Marino, for their lifetime of sacrifices so that I could have the strength and resources to accomplish all that I have. Without their love and support, I never would have made it this far.
To my husband, Jim Rhyne, for all of his love and support for the entirety of my Ph.D. program. His presence comforts me and his strength grants me stability.
Acknowledgements
First and foremost, I would like to thank my advisor, Mary Kennedy. Whether she was conscious of it or not, she provided a near perfect balance of praise and tough love to keep me motivated and energized- I assure you, this was not an easy balance to achieve both because of my personality and hers. Furthermore, she provided me an environment that was conducive both to scientific and personal development. Ultimately, I am forever grateful for the training I received with Mary, and her support of my future career endeavors.
While all members of the Kennedy lab were wonderful, caring, and supportive colleagues, Leslie Schenker and Tinh Luong were of particular importance to my success. Both Tinh and Leslie provided a great deal of technical and experimental support for my thesis. Specifically, Leslie was an equal partner for the screening of the 496 ES cell clones for homologous recombination. Furthermore, she took over the genotyping of the Densin knockout and floxed lines from me, thus freeing me up to focus on other aspect of my thesis research. Leslie managed all of the timed matings for the NR2A tailless
of my project. Tinh’s technical expertise and intellectual capacity far exceed that of any other biology graduate student I have known at Caltech. Consequently, she was of great importance as I thought through the relevance and context of my results.
I would like to thank Holly Carlisle for all of her support and work on the spine analysis. Holly and I performed the animal perfusions together, I took all of the images, and Holly processed and analyzed my images. Ultimately, this project is as much hers as it is mine.
Abstract
Chapter 5: Global Analysis of the Effect of Densin Knockout
on Gene Transcription in the Brain
Introduction. . . . . . 77
Materials and Methods 5.1 Construction of Forebrain and Hippocampal RNA Seq Libraries . . . 78
5.2 Analysis of RNA Seq Data Sets . . . 78
Results 5.3 The Densin Knockout Animal Does Not Exhibit Gross Changes in Transcriptional Activity . . . 79
5.4 Transcription Levels Do Not Change For PSD Proteins with Decrease Levels of Protein in the Knockout . . . 79
5.5 Immediate Early Gene Transcripts Show Large Changes in the Densin Knockout Mice . . . 80
5.6 Comparison of Transcript Levels of PSD Protein Genes in the Forebrain and Hippocampus . . . 80
5.7 Candidate Genes for the Seizure Phenotype . . . 81
References. . . 83
Figures 5.1 – 5.5. . . 84
Table 5.1 . . . 89
Chapter 6: Discussions and Conclusions . . .
91Introduction
1.1 History and Context
Within an evolutionary context, one can easily imagine that an ability to positively adjust decision-making processes relative to past experiences and environmental conditions would greatly increase the survival of an organism.
Consequently, phylogenetically acquired mechanisms that allow an organism to adjust its behavior on the basis of information acquired ontogenetically have proven to be powerful adaptations. Information acquisition and utilization implies a close relationship between learning, memory, and behavior. Thus, it comes as no surprise that the biological
mechanisms that underlie neural learning and memory have been intensely pondered and studied by philosophers, psychologists, and biologists since ancient times.
Evidence indicates that the number of neurons in an adult brain does not
significantly increase with age, suggesting that the production of new neurons is not the cellular mechanism underlying learning and memory [1] . The theories put forth by Ramon y Cajal [2] and expanded upon by Donald Hebb [3] suggesting that changes in neuronal connectivity are the cellular and molecular basis of learning and memory have become the dominant paradigm for much of modern neuroscience. In particular, Hebb’s neurophysiological postulate of learning states:
excite a cell B and repeatedly or persistently takes part in firing it, some growth process or metabolic change takes place in one or both cells such that A's efficiency, as one of the cells firing B, is increased. [3]
Hebb’s postulate laid the initial theoretical framework that led subsequent researchers to identify long term potentiation- the cellular mechanism by which a neuron’s excitatory response can be enhanced, or “potentiated,” by previous high frequency stimulation, allowing neurons to respond more sensitively to subsequent low frequency stimulations.
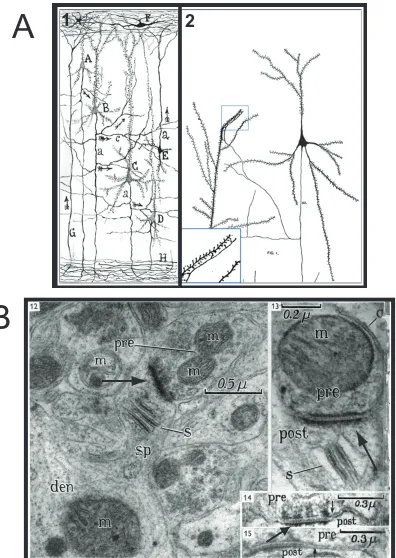
Neural connectivity as a concept originated with Ramon y Cajal’s identification of small protrusions extending away from the main dendritic axis (dendritic spines) and their contact points with the adjacent nerve fibers (axons; Fig 1.1a, panel a). However, the concept that the bulbous head of dendritic spines were likely to act as “receptors of current” was contributed by H.J Berkley (Fig 1.1a, panel b):
“The function of the gemmule is in all likelihood to receive nerve impulses from the ending of the numerous terminal nerve fibers that seem almost to touch them, and carry these impressions to the dendrite and by its medium on the cell body.”
“…these spherical apparatus (terminal buttons) are closely adjusted against the bulbous tip of the gemmules, at times the application being so close as to give the impression of actual contact.” [2]
In 1897, Sherrington united Ramon y Cajal’s neuroanatomical and Berkley’s physiological arguments into the single concept of the synapse. However, it was not until 1956 that the definitive identification of the synapse was made by Palay, and not until 1959 that dendritic spines were definitively identified as the postsynaptic units (Gray 1959 a, b); both utilized electron microscopes to illuminate these structures.
In 1959, Gray identified specific, conserved structural differences between the axo-somatic and axo-dendritic synapses [4]. In particular, he described the electron dense thickening of the postsynaptic membrane (Fig 1.1b):
“One very obvious feature of the cortical synapse is that in certain contacts with dendritic trunks of their spines a high proportion of the length over which the membranes are apposed shows a
thickening and increased density. Also the thickening and density is much more pronounced in the post- than the pre-synaptic membrane.” (p. 422, [4])
ushering in an era during which the protein constituents of the PSD began to be identified.
Finally, in the late 1960s and early 1970s another set of seminal experiments were providing the first experimental description of long term potentiation. Specifically, in 1966, Lomo and colleagues reported that a series of conditioning trains of impulses could potentiate the size of synaptic potentials for periods ranging from 30 min to many hours. In their seminal work, Lomo and Colleagues wrote the following:
“Extracellular responses of dentate granule cells, evoked by repetitive stimulation of the entorhinal area or perforant path fibres, were recorded simultaneously with two microelectrodes. One electrode recording from the layer of perforant path synapses on the granule cell dendrites, the other from the layer of granule cell bodies.
“After an initial depression, lasting for a few seconds, repetitive stimulation led to a large potentiated response, compared to the response evoked by a single volley. This effect, frequency
“This represents an example of a plastic change in a neuronal chain, expressing itself as a long-lasting increase of the synaptic efficiency. The effect, which may last for hours, is dependent upon repeated use of the system.” [7]
Further experimentation by Bliss and Lomo showed that “one or more brief episodes of tetanic stimulation (15 sec -1 for 10--15 sec) produces a potentiation of the monosynaptic response evoked by single shocks which may last for several hours.” The full report of Lomo’s work, published in 1973 [7] was the first quantitative description of LTP.
1.2 The Postsynaptic Density: Contents, Supramolecular Complexes,
and Higher Order Structure
It has long been thought that synapses are the most suitable location of memory storage in the brain [3, 8]. Furthermore, many believed that a clear relationship existed between the morphology of dendritic spines and their functions during normal and diseased states [9]. However, the observation that spine head volume can increase and neck length vary during LTP [10, 11] helped establish the idea that there exist dynamic and plastic mechanisms within the spine that actively respond to synaptic activity. This work, together with that of Bliss and Lomo [7] helped lay the groundwork for the
1.2.1 Contents of the PSD
Understanding the activity dependent changes that occur in the PSD upon synaptic stimulation requires an integrated approach to identify its constituent proteins and then study their function and dynamic organization. Early efforts to identify
components of the PSD utilized differential centrifugation and sucrose density gradients, followed by detergent extraction with non-ionic detergents such as Triton-X [6]. Protein separation and microsequencing techniques used by Mary Kennedy and co-workers resulted in the identification of numerous core PSD proteins, including CaMKII [12], PSD-95 [13], the NR2B subunit of the NMDA receptor [14], Densin [15], SynGAP [16], and Citron [17]. Yeast two-hybrid screens using known PSD proteins as bait were used to identify other PSD proteins, among them GKAP [18-20], Shank [21, 22], GRIP/ ABP [23, 24], Homer [25], GRASP-1 [26], and SALMs (synaptic adhesion-like molecules) [27]. More recently, mass spectrometry methods have been used to detect a large number of putative PSD proteins [28-31]. Though proteomic based PSD identification studies have identified many proteins likely to play a role in postsynaptic reception, care needs to be taken when interpreting these findings. The spatial constraints, stoichiometry and organization of the PSD suggests that the number of different proteins in a single PSD is likely to be in the tens, not hundreds of different proteins [32, 33].
where identified. However, other previously unidentified proteins were also isolated. This work suggests that a core group of PSD proteins are likely to exist at most PSDs. Moreover, the bulk proteomic identification of numerous proteins from whole brain PSDs speaks more to the diversity of synapses, their spatial and functional specificity, and their complex signaling pathways than the general contents of a PSD.
Identifying the protein-protein interactions and atomic structure of individual PSD proteins is necessary for modeling the spatial geometry of this integrated macromolecular complex. Together with data generated from systematic EM immunogold analysis [34], electron microscopy [35], EM tomography [36], and solid phase chemical cross-linking methods [37], a comprehensive 3-dimensional model of the PSD is beginning to emerge. Two major characteristics of all current models are 1) the clustering and scaffolding of supramolecular complexes immediately adjacent to the membrane, and 2) a matrix of proteins forming a platform upon which these supramolecular complexes sit.
1.2.2 Supramolecular Complexes of the PSD
Cho et al. [38], identified the first PSD scaffolding protein, PSD-95. With its three PDZ domains, a SH3 domain, and a guanylate kinase domain, PSD-95 is the prototypical PSD scaffolding molecule, allowing for multiple and simultaneous protein-protein interactions. PSD-95 has been shown to nucleate a NMDA receptor signaling complex [39, 40] and synaptic adhesion complexes [41] within the PSD. Though PSD-95 has not been shown to nucleate AMPA receptor signaling complexes, it has been shown to localize and target AMPA receptors via Stargazin [42-44]. Furthermore, Gerrow et al. [45] showed that mobile, preformed complexes of PSD-95, GKAP, and Shank are transported to dendritic positions primed for synapse development. Such evidence suggests that PSD-95 acts as a major scaffolding protein for modular clusters of supramolecular complexes i.e., the PSD-95/ NMDA receptor complex and the PSD-95/ adhesion molecule complex.
A second major PSD scaffolding molecule, Homer, is known to interact with and cluster the group 1 metabotropic receptors (mGluR1 and mGluR5) and inositol
trisphosphate receptors (IP3R) [22, 25, 46]. The Homer protein has two major splice variants, long and short [47]. The long form contains two major domains, 1) the N-terminal EVH1 PDZ-like target-binding domain that mediates interactions with mGluR and IP3R [22, 25, 48] and 2) the C-terminal self-assembly coiled-coil/ leucine zipper domain that mediates self-dimerization [49]. The short form of Homer contains only the N-terminal EVH1 PDZ-like target-binding domain and exhibits activity regulated
The third scaffolding protein that mediates clustering of particular PSD proteins into supramolecular complexes is GRIP/ ABP (AMPA binding protein). GRIP1 and ABP/ GRIP2 were independently identified using the C-terminal tail of GluR2/3 as bait in yeast two-hybrid screens [23, 24]. In addition to binding and clustering GluR2/3 receptors, GRIP1 also binds to GRASP-1, a neuron specific guanine nucleotide exchange factor (GEF). Recent work by Ye et al. [54] shows that GRASP-1 is able to bind both JNK and the upstream kinase MEKK1 in neurons, and that these interactions facilitate JNK signaling. Though a complex specifically containing AMPA, GRIP1, and GRASP-1 has yet to be shown, or the direct activation of AMPA receptors leading to the activation of the JNK pathway scaffolded by GRASP-1, the suggestion that GRIP1 scaffolds an AMPA receptor complex is intriguing. Finally, like PSD-95, GRIP family proteins can cluster synaptic adhesion molecules into larger supramolecular complexes [55-57].
1.2.3 Higher Order Structure of the PSD
Current models of the PSD suggest that the supramolecular complexes adjacent to the membrane sit on a platform matrix formed by the protein Shank. Shank was
that helical fibers formed by Shank can be crossed linked by Zn2+ [35]. More recently, Hayashi et al. [59] demonstrated that interactions between multimerized Shank and tetramerized Homer form higher-order-polymerized complexes with a mesh-like network structure. This higher-order structure was proposed to form the core structural
framework and binding platform for PSD supramolecular complexes.
The multiple protein domains of Shank have been shown to bind the different PSD supramolecular complexes immediately adjacent to the membrane either by direct binding or via adaptor proteins [32]. In particular, the 95/ NMDAR and the PSD-95/ synaptic adhesion molecule complexes can be directly linked to the Shank scaffolding via GKAP [21]. Homer is known to directly bind Shank, thus linking the mGluR/ Homer complex to the underlying Shank scaffold matrix [22]. Consequently, Shank is able to cross-link Homer and PSD-95 complexes in the PSD. Finally, though no interaction has been demonstrated between the GRIP/ AMPA complex and Shank, AMPA receptor complexes can interact with PSD-95 through the C-terminal PDZ binding motif of Stargazin, a transmembrane AMPA receptor regulatory protein [42, 60]. Ultimately, the ability of Shank to tether and nucleate numerous PSD supramolecular complexes
supports the current models of a laminar organization of the postsynaptic density.
1.3 Densin is a Core Component of the Postsynaptic Density
specific, Densin has been subsequently shown to be expressed at low levels in kidney [61-63], Testis [64], and the pancreas [61].
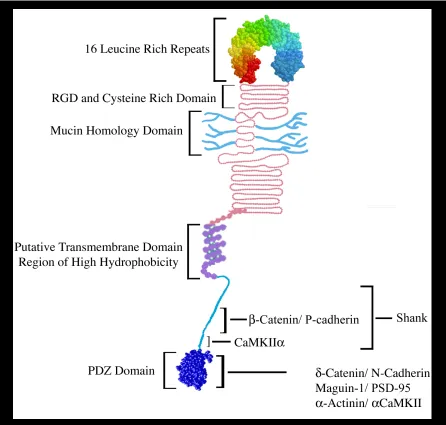
Densin contains two indisputable protein domains, 1) a N-terminal leucine-rich repeat (LRR) domain consisting of 16 canonical LRRs, and 2) a C-terminal PSD-95/ Dlg/ ZO-1 (PDZ) domain (Fig 1.3). Other proteins with this arrangement of domains were subsequently identified and designated a new protein family call LAP proteins (LRR and PDZ domains), of which Densin is the founding member [65]. Initial sequence analysis of Densin also identified a RGD motif, a Mucin homology domain and a putative transmembrane domain (Fig 1.3).
1.3.1 Cellular Localization and Tissue Expression
Immunofluorescent double labeling of Densin and Synapsin I, a presynaptic marker, reveals that Densin is localized to the synapse (Fig. 1.4a, top panel).
Furthermore, co-staining neuronal cultures with antibodies to Densin and PSD-95 reveals a tight colocalization of these two proteins, supporting the hypothesis that Densin is a postsynaptic density protein (Fig. 1.4a, bottom panel). Interestingly, Densin was also identified in the axon initial segment (Fig. 1.4a, bottom panel) suggesting that it may play a role in the macromolecular complex of the axon hillock where action potentials are generation. Comparison of in situ hybridization images of Densin with those of
patterns, these studies suggest that the Densin protein is likely to be widely expressed in the forebrain.
1.3.2 CaMKII Phosphorylation of and Association with Densin
Apperson et al. [15] showed that Densin is specifically phosphorylated by endogenous CaMKII within the PSD. Subsequent work by Strack et al. [66] identified Ser1397 and Walikonis et al. [67] identified Ser1293 and Ser1397 as sites phosphorylated by CaMKII. Both studies independently identified the region between the putative
transmembrane domain and the PDZ domain as the region of CaMKII binding, with Walikonis specifically demonstrating that Densin directly interacts with the association domain of CaMKII. Walikonis et al. [67] also demonstrated that autophosphorylation of CaMKII on Thr286 significantly increases its binding affinity for Densin;
splice variant, suggesting that alternative splicing may act as a mechanism to regulate the docking of CaMKII to Densin.
1.3.3 Protein-Protein Interactions Between Densin and Other PSD Proteins
In addition to identifying CaMKII as a binding partner for Densin in a yeast two-hybrid screen, Walikonis et al. also identified -actinin as a binding partner for the PDZ domain of Densin. Biochemical studies of the interactions between Densin, CaMKII, and -actinin not only confirms that -actinin and Densin bind to distinct regions within CaMKII, but that CaMKII and -actinin interact with each other; thus, these proteins can form a ternary complex.
The PDZ domain of Densin was also shown to interact directly with the
C-terminal SWV PDZ binding motif of -catenin/ NPRAP [73]. Izawa and co-workers [73] showed the following: 1) Densin, -catenin/ NPRAP, and N-Cadherin
co-immunoprecipitate with each other, 2) all three proteins co-localize at the tips of spines in dissociated hippocampal cultures, and 3) -catenin/ NPRAP specifically mediates the association of Densin and N-Cadherin. These results provide strong evidence that Densin is linked to cadherin-catenin complexes and that it may be involved in organizing
synaptic cell-cell junctions.
Another PSD protein found to interact with Densin is Shank. Quitsch et al. used the SH3 domain of Shank as bait in a yeast two-hybrid screen. Of the approximately one million clones screened, only the C-terminus of Densin, residues 1125-1542, was
consistently identified. Further analysis determined that the membrane proximal region of Densin was require for binding to Shank. However, the putative transmembrane region and the PDZ domain enhance the interaction between Densin and Shank such that, in their absence, Densin and Shank no longer interact.
cytoarchitecture and connections to the cytoskeleton. Though these protein-protein interactions have yet to be identified in the brain, the fact that Densin directly interacts with nephrin and complexes with -catenin and P-cadherin suggests a conserved role for Densin as part of cell adhesion complexes.
1.3.4 Functional Analysis of Densin.
1.3.5 Membrane Topology of Densin
A recent review by Thalhammer and collegues [75] proposed a new, membrane associated, entirely cytosolic topology for Densin. Recent analysis of the in vivo phosphorylation state of PSD preps found that Densin contained a cluster of
phosphorylation sites positioned N-terminal to the proposed transmembrane domain. These findings prompted Thalhammer and colleagues to suggest that the original transmembrane topology of Densin was incorrect, and that Densin was in fact entirely cytosolic. They further purport that current bioinformatic analysis does not support the existence of a signal peptide or other sequence motifs that suggests a transmembrane domain. Moreover, they argue that the inability to surface biotinylate the proposed extracellular portion supports its intracellular position. Finally, they suggest with much hand-waving, that the experimental evidence for glycosylation was “quite weak.” On this point, we take serious issue.
Two enzymatic digestions were done to support the glycosylation state of Densin. The first enzymatic digestion used neuraminidase from Arthrobacter ureafasciens.
Neuraminidases are glycohydrolases that catalyze the hydrolysis of sialic
Thalhammer and colleagues are quite mistaken in their biochemical protocol assumptions.
Second, these authors argue that “digestion with O-sialoglycoprotein endoprotease suggested possible positioning of O-sialoglycosylation within the Mucin domain. ” The suggestion here is that digestion with the O-sialoglycoprotein endoprotease from
Pasteurella haemolytica lacks in specificity of its action. The P. haemolytica
O-sialoglycoprotein endopeptidase cleaves only proteins that are heavily sialyated, in particular those with sialylated serine and threonine residues [80, 81]. It does not cleave
unglycosylated proteins, desialylated glycoproteins or glycoproteins that are only N-glycosylated [82-84]. Ultimately, this is a highly specific endopeptidase. The observed cleavage products were identified by immunoblot to be Densin.
Colbran and colleagues recently published an extensive profile of alternatively spliced species of Densin [68]. Though it has yet to be shown, the numerous slice variants of Densin suggest that both a transmembrane and a entirely cytosolic topology is possible. Thalhammer and colleagues never once suggested this possibility-- a serious scientific oversight.
74. Quitsch, A., et al., Postsynaptic shank antagonizes dendrite branching induced by the leucine-rich repeat protein Densin-180. J Neurosci, 2005. 25(2): p. 479-87. 75. Thalhammer, A., et al., Densin-180: revised membrane topology, domain
structure and phosphorylation status. J Neurochem, 2009. 109(2): p. 297-302. 76. Roggentin, P., et al., The sialidase superfamily and its spread by horizontal gene
transfer. Mol Microbiol, 1993. 9(5): p. 915-21.
77. Drzeniek, R., Substrate specificity of neuraminidases. Histochem J, 1973. 5(3): p. 271-90.
78. Iwamori, M., et al., Arthrobacter ureafaciens sialidase isoenzymes, L, M1 and M2, cleave fucosyl GM1. Glycoconj J, 1997. 14(1): p. 67-73.
79. Rogerieux, F., et al., Determination of the sialic acid linkage specificity of sialidases using lectins in a solid phase assay. Anal Biochem, 1993. 211(2): p. 200-4.
80. Manning, G., et al., Evolution of protein kinase signaling from yeast to man. Trends Biochem Sci, 2002. 27(10): p. 514-20.
81. Hanks, S.K., A.M. Quinn, and T. Hunter, The protein kinase family: conserved features and deduced phylogeny of the catalytic domains. Science, 1988. 241(4861): p. 42-52.
82. Abdullah, K.M., et al., A neutral glycoprotease of Pasteurella haemolytica A1 specifically cleaves o-sialglycoproteins. Infect. Immun., 1992. 60: p. 56-62. 83. Sutherland, D.R., et al., Cleavage of the cell-surface 0-sialglycoproteins CD34,
CD43, CD44, and CD45 by a novel glycoprotease from Pasteurella haemolytica. J. Immunol., 1992. 148: p. 1458-1464.
Figure 1.1 Hand drawing and electronmicrograph of synaptic connections between excitatory dendritic spines and axonal nerve fibers. (A) Comparative drawings from Ramon y Cajal (panel 1) and Berkley (panel 2) showing connections of axons with dendritic spines. Adapted from Garcia-Lopez et al. [2007]. (B) Electronmicrograph of presynaptic terminals forming glutamatergic synapses with dendritic spines. All panels show Gray's Type 1 asymmetric synapses with electron dense thickenings at the postsynaptic terminal (arrows). Thickenings represent postsynaptic densities as defined ultrastructurally. Adapted from Gray [1959] Abbreviations: pre, presynaptic process; post, postsynaptic process; m, mitochondria; s, spine apparatus; sp, dendritic spine; den, dendrite
B
Figure 1.2 Organization of receptor-scaffold and macromolecular complexes in the postsyanptic density (PSD). (A) Excitatory postsynaptic clusters of glutamate receptors with their asociated scaffolding molecules, as mediated by PDZ or PDZ-like protein-interaction domains. Metabotropic glutamate receptors (mGluR), NMDA receptors (NMDAR), and AMPA receptors (AMPAR) bind to the PDZ domains of Homer, PSD-95, and GRIP, respectively. The unbound protein domains of Homer, PSD-95, and GRIP are available to bind other synaptic proteins, thus forming
A
Figure 1.3 Densin protein domains and binding partners. The hypothetical structure of the Densin leucine rich repeat motif and the PDZ domain is based on homologous protein structures. The LRR structure is composed of 16 contiguous LRRs, and is immediately flanked on both sides by clusters of cysteine residues. The mucin-like repeats are thought to serve as sites for O-linked sugars (Apperson et al., 1996). The putative transmembrane domain was hypothesized due to the prediction of an amphipathic helix-like structure between amino acids 1223 to 1246. The region downstream from the putative
Figure 1.4 Immunocytochemical localization of Densin in 14-21 DIV hippocampal cultures (Apperson et al., 1996) and in situ hybridization of Densin in adult C57B/6J mouse (Allen Brain Map, Lein et al., 2007). (A- top panel) Double staining of Densin (red)/ Synapsin I (green; top panel) and Densin (red)/ PSD-95 (green; bottom panel). Overlay of dual channel confocal images (left) show that Densin (top panel, large arrowheads) and Synapsin I (top panel, small arrowheads) overlap. Small inset boxes on right show single channel images of Densin and Synapsin I. Overlay of dual channel images of Densin and PSD-95 show precise co-localization at punctal positions at spine tip structures along dendrites (arrowheads in inset box, bottom panel) as well as localization of Densin at the axon initial segment/ axon hillock (arrowhead in dual and single Densin channel images, bottom panel). Single channel images of Densin and PSD-95 are shown in bottom right panels. (B) In situ hybridization heat maps of Densin, NR2C and αCaMKII at saggital level 12-13 are shown. Densin gene expression is shown in
comparison to NR2C (low gene expression in forebrain) and αCaMKII (high gene expression in forebrain). Densin is highly expressed in all regions except the cerebellum. In contrast, NR2C is highly expressed in the cerebellum, but not in the forebrain, while αCaMKII is highly
A
Chapter 2: Design of Targeting Construct for Densin
Deletion, Confirmation of Densin Knockout, and Initial
Characterization of the Knockout Phenotype
Introduction
Derangements in synaptic transmission and plasticity are part of the pathology of numerous neurological and mental health diseases including epilepsy, schizophrenia, depression, and Alzheimer’s disease. In excitatory synapses of the CNS, the postsynaptic reception, integration, and transduction of signals is mediated by the supermolecular complex of the postsynaptic density. Understanding the role that particular PSD proteins play in normal and pathological states will greatly enhance our knowledge of the
underlying molecular mechanisms which contribute to overall mental health and well being.
NR2C subunits of the NMDA receptor [14]. These mutant and transgenic animals have
provided an immensely detailed understanding of their roles in synaptic transmission and
plasticity. However, a more holistic understanding of how these core PSD proteins are
functionally and structurally integrated into the supramolecular complex of the PSD still
remains elusive.
As previously discussed, Densin is a core protein of the PSD and has been shown
to complex with Maguin-1/ PSD-95, -Actinin/ CaMKII, -catenin/ N-cadherin, Shank,
-catenin, and Nephrin. Given the facts that 1) PSD-95 and Shank are major scaffolding
molecules for signaling complexes within the PSD, 2) CaMKII activity is of critical
importance for integrating Ca2+
signaling in the PSD, 3) -catenin, -catenin, N-cadherin,
and nephrin are key players in mediating cell adhesion, spine morphology and dendritic
arborization, and 4) -Actinin plays a key role in actin cytoskeletal dynamics, Densin
seems to sit at a major hub for cross-linking and integrating major signaling complexes
within the PSD.
Here I describe the generation and initial characterization of a Densin knockout
mutation in the mouse.
Material and Methods
2.1 Intron-Exon boundary structure and gene-targeting construct
Intron-Exon boundaries of Densin were determined by identifying all known
cDNA and splice variants of Densin in the NCBI and Celera databases and mapping them
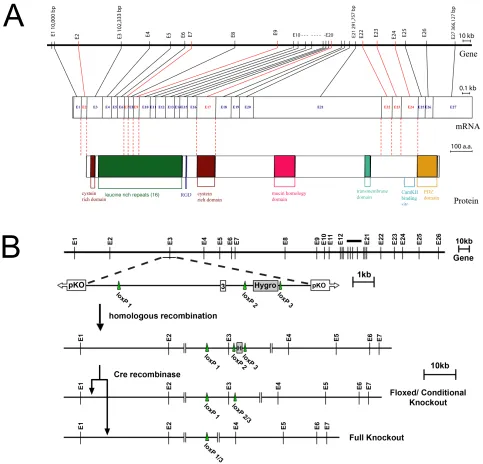
A CITB mouse BAC library (Research Genetics) encoding genomic sequence of strain 129S1Sv (recently renamed 129S3Sv/ImJ) was screened with a cDNA probe encoding Densin Exon 3. CITB Mouse BAC Clone 456C10 hybridized with the probe for Exon 3. The BAC DNA insertion junctions were sequenced and aligned against the known genomic sequence of Densin. The presence of Exon 3 in the BAC clone was determined by PCR. A restriction map of the BAC clone was developed and a 9.9kb region, which included Exon 3 and its surrounding introns, was cloned into the pKO Scrambler 907 vector (Stratagene). The long arm of the Densin targeting construct contained a 7.8kb fragment including intron 2, Exon 3, and part of intron 3; the short arm contained a 2.1kb fragment of intron 3 (Fig 2.1). The first loxP site was inserted 4.8kb upstream of Exon 3. A hygromycin selection cassette, flanked on both sides by loxP sites (no. 2 and 3), was cloned into the short arm of the targeting sequence 1.1kb downstream from Exon 3 (Fig 2.1).
2.2 Generation of mouse embryonic stem cells for injection into
blastocysts
The linearized targeting construct (25g ) was electroporated into 1x10⁷
cells/cuvette of mouse ES (CJ7) cells. Transfected ES cells were grown in the presence of hygromycin (200g/ml) for 7-8 days to select for homologous recombinants. Two recombinant clones with both 51
and 31
construct integration were identified and
Samples were fractionated by SDS-PAGE on 7.5 or 9% acrylamide gels and transferred to nitrocellulose membranes (Schleicher & Schuell) in transfer buffer (25mM Tris, 200mM glycine, 20% methanol). Membranes were blocked with 5% milk in TBS buffer (20mMTris, 150mM NaCl) for 1 hour at room temperature followed by overnight incubation with primary antibody in TBS + 0.1% Tween 20 blocking buffer at 4o
C. Primary antibodies were used at the following dilutions: Densin CT245 (1:2500), M2 (1:2500), and LRR (1:1000). All Densin antibodies are described by Apperson, et al., 1996. Membranes were washed three times with TBS + 0.1% Tween 20 blocking buffer at room temperature. Bound antibodies were detected with IRdye700- or IRdye800- (1:10,000) secondary antibodies (Rockland, Gilbertsville, PA). Membranes were then washed three times with TBS + 0.1% Tween 20, followed by two washes with TBS. Blots were visualized with the Odyssey Infrared Imaging System (Fig 2.3B; Li-Cor Bioscience, Lincoln, NE).
2.6 RNA seq confirmation of exon 3 deletion and expression
Ten adult males (five wt:ko sibling pairs), 11 weeks of age were killed by cervical dislocation. Forebrains were dissected from two wt:ko sibling pairs (four animals total) and hippocampal tissues was dissected from three wt:ko sibling pairs (six animals total). The forebrain and hippocampal tissue were not harvested on the same day, but all
subsequent processing was the same.
passage through 20g and 25g needles. The samples were allowed to sit at room
temperature for 5 minutes at which time, each was supplemented with 75μl MicroRNA homogenate additive (mirVana kit). Samples were shaken by hand for 15 seconds and subsequently incubated on ice for 10 minutes. Total RNA was extracted using phenol/ chloroform, isolated using mirVana Filter Cartridges as per the manufacturers
recommendations, eluted with mirVana elution buffer, and supplemented with
ScriptGuard (Epicentre Biotechnologies, Madison, WI). Sample concentrations were measured using the Nanodrop quantification system (Thermo Scientific, Waltham, MA).
Residual genomic DNA was enzymatically removed using Baseline Zero DNase (Epicentre Biotechnologies). RNA was re-extracted using phenol/ chloroform and precipitated O/N with ethanol. The RNA was dried, re-suspended in 50μl dH2O
supplemented with ScriptGuard, and its concentration measured using Nanodrop. RNA was subsequently stored at -80oC.
Oligo(dT) selection from total RNA, cDNA preparation, sequencing and read mapping was performed as previously described [15]. Analysis of the expression level of the gene loci was performed with ERANGE software as previously described [15]. Unique RPKM (reads per kilobase of exon model per million mapped reads) counts were used for subsequent statistical analysis.
Results
2.7 Genomic organization of the Densin gene
codons were identified within exon 3. The first start codon is formed by the last base pair
of exon 2 and the first two base pairs of exon 3. The second start codon is +16 base pairs
from the first. No other methionine start codons were identified. Exons 2, 7, 9, 17, 22,
23, and 24 are predicted to be alternatively spliced. A predicted homology site for a
matrix attachment region/ scaffold attachment region (MAR/SAR) was identified at
-2000bp from the start of the Densin gene. Such regions are known to flank
transcriptionally active chromosome regions and may contain a concentration of
transcription factor binding sites [16]. Contained within exon 22 is a cDNA sequence
reported from a macaque brain cDNA library (gi:9967402).
2.8 Targeting construct and breeding
Following electroporation with the exon 3 targeting construct, two ES clones were
identified to have undergone homologous recombination with one showing a healthy
karyotype. The mutant ES clone was injected into 98 host blastocysts and subsequently
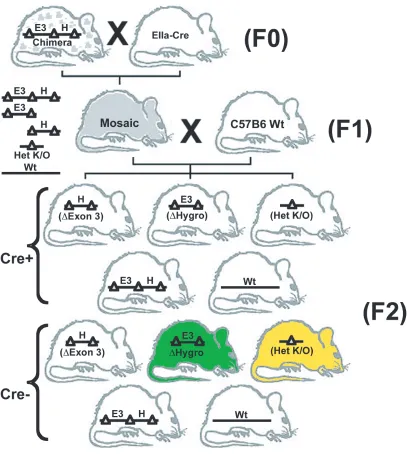
implanted into seven pseudo-pregnant females. 40 pups (F0) were born of which 14
exhibited chimeric coat coloration. Three chimeras with greater than 90% agouti coat
color were mated to C57B6 females expressing cre-recombinase under the EIIa promoter. 8 out of 19 pups that were littered (F1) exhibited germline transmission and genomic
mosaicism as determined by PCR (data not shown). Three male mosaic pups were
subsequently bred to C57B6 wild type females. Litters exhibited an assortment of
monogenic genotypes. Pups that were heterozygous for the complete deletion of exon 3
hygromycin selection cassette were denoted conditional/ floxed founder animals (F2; Fig
2.2). Both sets of F2 heterozygous founder animals were liberally bred to wt C57B6
animals to generate a large F3 population that was subsequently interbred to produce full
knockout animals for experimentation.
2.9 Verification of the homozygous ko mouse
The chromosomal deletion of exon 3 in knockout mice was verified by
performing PCR on genomic DNA isolated from ear punches and tail clippings (Fig
2.3a). RNA Seq analysis demonstrated that the Densin transcript is stably expressed, but
lacks exon 3 and the start codon necessary for protein translation (Fig 2.4a).
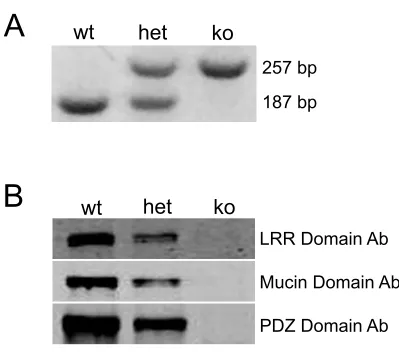
Immunoblots with antibodies targeting the n-terminal LRR domain, the Mucin homology
domain, and the c-terminal PDZ domain confirmed that no Densin protein was expressed
(Fig 2.3b)
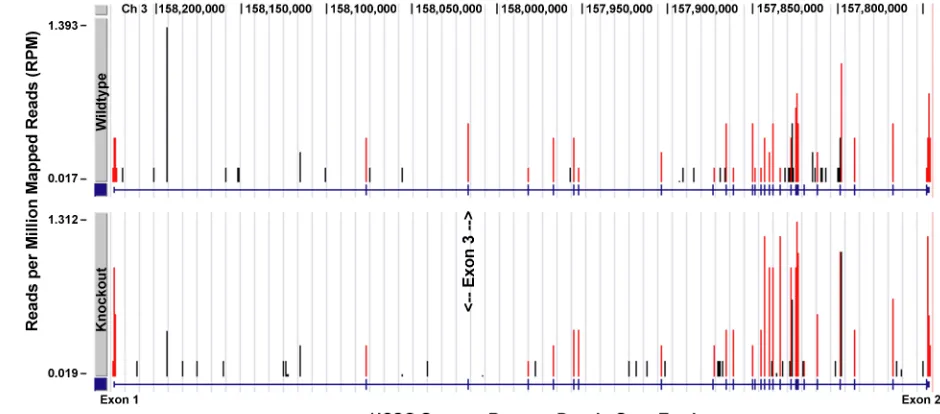
To examine if the homologous recombination of the targeting construct and
deletion of exon 3 resulted in aberrant expression of genes flanking the Densin locus, we
performed an RNA seq analysis on two wt:ko sibling pairs at 11 weeks of age. No
significant changes in the transcript expression levels of the seven genes flanking the
Densin locus were observed (Fig 2.4b). These data indicate that the homologous
recombination of the targeting construct and deletion of exon 3 do not disrupt or alter the
expression levels of those genes most proximal to the Densin locus. Consequently, the
observed phenotypes in this animal will not be confounded by alterations in promoter/
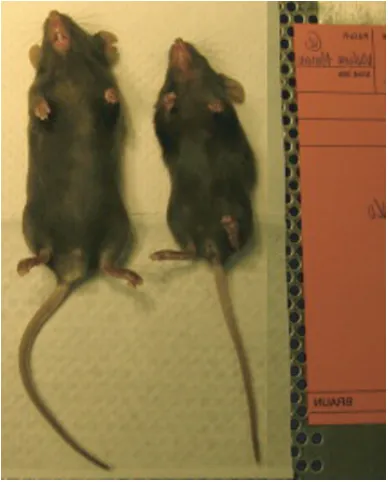
2.10 Homozygous Densin knockout mice show a runted phenotype
Crossing of Densin heterozygous mice results in progeny with a Mendelian
distribution of 1.2 wt : 2.4 het : 1 ko (n=328). Thus, the Densin mutation does not result
in embryonic lethality. Once born, knockout animals are viable and are able to compete
for nutritional resources as demonstrated by the presence of an abdominal milk spot
(image not shown). On P0, knockout animals are indistinguishable from their wildtype
or heterozygous litter mates. However, by P4 knockout animals are significantly smaller.
Of 74 knockout animals born, 51 showed runted phenotypes and 23 were of normal
weight and size when compared to wt and heterozygous litter mates (data not shown).
This data suggests that the runt phenotype is not fully penetrant.
At three weeks of age, knockout animals are still significantly smaller compared
to their litter mates (weight= -44.95%, p<0.01; length= -15.48%, p<0.01). By the time of
weaning (3-4 weeks of age) 20% of the knockouts had died (11 out of 51). By 11 weeks
of age the size disparity between knockout and wild type animals significantly decreases,
but was still statistically significant (weight= -11.86%, p<0.05; length= -4.92%, p<0.05)
(Fig 2.5).
2.11 Densin knockout mice have seizures when injected with Nembutal
Twelve wt:ko sibling pairs were injected perinatally with 100μg/gram body
Animals were injected without prior knowledge of their genotype. The onset of seizures
typically occurred within 1 min 15 seconds to 1 min 45 seconds. This delay is probably
associated with the length of time it takes for the Nembutal to reach the brain. All
animals injected exhibited a stiffening of their tail within 30-40 seconds after injection.
Nine out of twenty four animals injected progressed into full-blown seizures
characterized by violent, uncontrollable spastic convulsions of their entire body. When
the genotype of the animals was revealed, we determined that all nine of the animals that
had seizures were knockout animals. None of the wild type animals had seizures.
Just prior to the onset of the seizure, the animals exhibited staccato like movement
and began to rear. While the seizures were occurring, all of the animals exhibited a
flagellar-like motion in their tail. Furthermore, their front limbs seemed to become
immobile. The tonic-colonic-like seizures lasted for 30 to 45 seconds, at which time the
animals ceased to move. All animals were euthanized within 3 minutes of becoming
A
B
Figure 2.1 Structure of the Densin gene and design of the targeting construct. (a) The Densin gene contains 27 exons, spanning 358,959 nucleotides. Exons flanked by alternative splicing consensus sequences are marked red. cDNAs demonstrating alternative splicing of these exons have been characterized (Jiao et al., 2008). The translation start codon is contained in Exon 3, along with the first cysteine-rich domain, and the beginning of the LRR. The region encoded by exons 22, 23, and 24, and known to bind β-catenin (Heikkila et al., 2007), Shank (Quitsch et al., 2005), and CaMKII (Walikonis et al., 2001 and Strack, et al., 2000), can be alternatively spiced (Jiao et al., 2008 and Strack et al., 2000). The last two exons encode the PDZ domain. (b) The exon 3 targeting construct included a LoxP site inserted into intron 2 and a hygromycin selection cassette flanked by LoxP sites, inserted into intron 3. Expression of Cre-recombinase in utero results in either the deletion of the hygromycin selection
Figure 2.2: Cre- mediated germline mosaicism and breeding strategy for the generation of floxed conditional ko and full knockout animals. Chimeric males produced from
B
LRR Domain Ab
Mucin Domain Ab
PDZ Domain Ab
wt
het
ko
A
257 bp
187 bp
wt
het
ko
Figure 2.3 Genomic PCR and immunoblot confirmation of knockout. (a)
A
Densin (LRRC7) +36%
Gpr177 -20% LRRC40 +12%
ANKRD13C +1% PTGER -1% LOC624684 -11% CTH 0%
SFRS11 +2%
-+
Strand
B
250 Kb
Figure 2.4 Validation of exon 3 deletion and confirmation of unaltered gene expression of genes flanking the Densin locus. (a) Comparison of wt and ko animal Densin transcripts. Exon positions (blue dashes along the horizontal axis) are predicted by the University of California, Santa Cruz, genome browser based on Refseq, Uniprot, GenBank, and
Chapter 3: Analysis of Dendritic Arborization and
Spine Morphology
Introduction
Neurons are specialized computational compartments that integrate and regulate
the propagation of information. The principle language used by neurons to communicate
with each other is the action potential. Numerous biophysical and structural properties of
neurons have evolved to modulate action potential integration and propagation. Cellular
morphology is crucial to our understanding of information processing and
communication styles, because neuronal shape is directly related to the computations
performed by the cell [1]. Two key morphological characteristics of neurons are
dendritic arbor structure and dendritic spine geometry. While spines [2] and dendritic
branches [3] can both operate as computational compartments, how their shape, size, and
structure affect their function and intrinsic properties is still poorly understood.
An astonishing diversity of dendritic arbor structures exists among neurons of
different and similar classes (Fig 3.1). The shape, size, and complexity of dendritic trees
can modulate action potential propagation [4] and influence the intrinsic firing pattern of
a neuron [5]. Specifically, Mainen and Sejnowski demonstrated that firing patterns
correlate strongly with the extent of arborization, and Vetter et al. [4] showed that action
potential propagation is strongly influenced by 1) the number of branching points, 2) the
that the level of dendritic complexity is a key metric for understanding a neuron’s
intrinsic properties.
Like dendritic arbor structure, a spine’s morphology can impact its function. As
previously discussed in chapter one, the shape and biochemical components of dendritic
spines play an important role in synaptic plasticity. Spine structures can be quite diverse,
but are typically categorized into four basic groups: mushroom, thin, stubby, and
branched (Fig 3.1b); these categories may also reflect their functional history [6]. These
categories are based on the ratio of two measurements, 1) spine neck length, and 2) head
volume. Synaptic activity can alter spine shape, composition of the resident PSD, and
signaling dynamics. The spine neck acts as a diffusion barrier, isolating spine heads from
the parent dendritic shaft. This isolation results in a specialized biochemical
compartment capable of influencing plasticity at the synapse [2]. Furthermore, though
spine necks are not able to sufficiently restrict synaptic currents, neck resistance can
establish a membrane potential microdomain within the spine head and specifically
restrict Ca2+
concentrations [7-9].
The structure of dendritic arbors and spine necks may serve somewhat distinct
functions, however their development and activity dynamically impact each other. In
fact, the growth and development of dendritic arbors are concurrent in time and space
with synaptic formation, with proteins of the postsynaptic density playing an integral role
in both processes [10]. Given the likely role of Densin in synaptic plasticity,
synaptogenesis, and signaling and adhesion complexes, I undertook a comparative study
to measure changes in dendritic arborization and spine shape between wild type and
Material and Methods
3.1 Infection of Primary Hippocampal Neurons and Analysis of
Dendritic Arbors
Primary hippocampal cultures were prepared and maintained as described
(Chapter 4.2). At 18-19 DIV cells were infected with a sindbis virus containing green
fluorescent protein (GFP) as previously described [11]. 12-14 hours post-infection, cells
were fixed on coverslips and mounted as described (Chapter 4.2).
Images were taken on a LSM 5 PASCAL/ Exciter confocal microscope
maintained by the Caltech Biological Imaging Center. Images were acquired using a
40x/ 1.3 Plan-Apochromat oil objective. The pinhole aperture was set at 0.5 μm with a
zoom of 1x and image size of 1024 x 1024.
Sholl analysis was performed using the NIH ImageJ Sholl Analysis Plugin (v1.0)
downloaded from the Ghosh lab website (
http://www-biology.ucsd.edu/labs/ghosh/software/). Background dendrites extending into the image
view from neighboring neurons were manually deleted. The origin of the concentric radii
was set at the midpoint of the longest axis of the soma. Analysis parameters were as
follows: starting radius, 1 μm; ending radius, 75 μm; radius step size, 2 μm; radius span,
1 μm; span type, median. Statistics were performed using the Prism statistical package
neck length to head volume [14]. The investigator was blind to genotype during image
acquisition and analysis of spine morphology.
3.3 Statistics
Raw data are presented as averages +/- standard error of the mean (SEM), with n
indicating the number of experiments. Data sets that report percentage changes from
control values are expressed as geometric means (GM) to avoid a statistical phenomenon
in which the averages of ratios tend to overestimate differences. The GM was calculated
as the nth root of the product of the percentage changes from the control values. The
standard error of the geometric mean (SEGM) was calculated by multiplying the GM by
the SE of the arithmetic mean of the logarithms of the percentage changes from the
control values.
Statistical analyses of two groups were measured using Student’s t tests
(two-tailed). One-sample t tests (two-tailed) were used to determine whether data sets that
were normalized to matched control values were significantly different from 100%.
Statistical analyses of data containing more than two groups were performed using the
one-way ANOVA test, followed by Tukey–Kramer analysis, to account for multiple
comparisons. The Kolmogorov–Smirnov method was used to assess whether data sets
had Gaussian distributions, as required for t tests and ANOVA analyses. In cases where
Results
3.4 Dendritic Arborization
Analysis of dendritic arbor structure in Densin ko mice revealed an effect of
deletion of Densin on branching of proximal dendrites and on overall dendritic branch
complexity. Qualitative observations suggested that the primary dendritic trunks
emanating from the soma are thicker in Densin
hippocampal neurons. Furthermore,
somal apexes from which the dendritic trunk and branches sprout are broad and flattened
relative to wt neurons.
Quantitative analysis of the structure of dendritic arbors using the Sholl method
revealed a statistically significant increase in the number of proximal dendrites within 10
μm of the soma (wt= 53.57 +/-1.74, ko= 103 +/-1.49; p<0.0001). However, the Densin
ko neurons show an overall decrease in the number of dendritic branches and complexity
as determined by the average number of total dendritic intersections (wt= 360.86 +/-2.15,
ko= 252.82 +/-1.36; p<0.0001). The findings indicate that the ability to initiate branch
points and extend dendrites is altered in Densin ko neurons.
3.5 CA1 Dendritic Spine Structure
The results of Quitsch et al. [15] in cultured neurons demonstrated that
overexpression of Densin in primary hippocampal cultures resulted in the elaboration of
the dendritic arbor structure. Furthermore, they showed that presynaptic clusters for
synaptophysin formed along the elaborated dendritic branches, suggesting that Densin
plays a role in synaptogenesis. This would suggest that neurons of Densin knockout
Densin
animals with GFP+ line-M transgenic mice. These mice express GFP sparsely
in a golgi-like pattern in CA1 pyramidal neurons [12]. We acquired confocal images of
fluorescent basal dendrites of CA1 pyramidal neurons in littermates, with the investigator
being blind to the genotype of the animal. Three-dimensional images of the dendrites
were deconvolved from z-stacks, and spine morphology was analyzed as described in
Section 3.2 and 3.3.
We found that adult hippocampal neurons from Densin
mice had a 13% increase
in spine density compared to wild type neurons (Fig 3.3). Furthermore, the volume of
spines heads decreased 11% in Densin
mice (Fig 3.3). Though a trend towards an
increase in spine length was observed, the difference was not statistically significant.
Figure 3.1 The morphologies of dendrites and spines affect their function. (A) Diversity of arbor structures between and within neuron classes dynamically affect their integration and propagation of action potentials, and ultimately their firing patterns. Top, dendritic morphologies of nonpyramidal cells. Left to right, fast spiking basket cell, late-spiking neurogliaform, non-fast spiking somatostatin Martinotti cell, non-fast spiking cholecystokinin (CCK) large basket cell, non-fast spiking small basket cell, and non-fast spiking double bouquet cell (adapted from Kawaguchi et al., 2006).
A
Figure 3.2 Cultured Densin ko neurons have thicker dendritic trunks and an increase in the number of proximal dendritic branches. (A) 18 DIV primary hippocampal cultures infected with sindbis-GFP. Primary apical and basal dendritic trunks (arrows) are thicker in ko neurons. Images represent the phenotypic range observed. Images are compressed z-stacks of three .5 µm consecutive optical sections. (B) Sholl analysis of cultured wild type (black) and ko (red) hippocampal neurons demonstrates an increased number of proximal dendritic branches within 10 µm of the soma as determined by the average of number of intersecting dendrites (wt= 53.57 +/-1.74, ko= 103 +/-1.49; p<0.0001). However, Densin ko neurons exhibit a
A
B
2015
10
5
0
10 20 30 40 50 60 70
Radial Distance from Soma (µm)
# of Intersecting Dendrites
0
Wild Type Densin KO
-/-Chapter 4: The Role of Densin in the Postsynaptic
Density and Docking of CaMKII
Introduction
Because proteins of the PSD apparatus work as an integrated whole, their differential spatial and temporal interactions are integral to the nature and strength of a postsynaptic response to impinging signals. Furthermore, the subcellular targeting and dynamic alterations in the localization of signaling and regulatory proteins may produce diversity in signaling complexes and increased specificity for target substrates [1]. The behavior of CaMKII enriched in the PSD reflects this dynamic spatial and temporal activity.
CaMKII is a Ser/ Thr kinase that is central to the coordination and execution of signal transduction of Ca2+ signals [2]. CaMKII is a dodecameric holoenzyme that is assembled in stochastic combinations from two homologous catalytic subunits, alpha and beta [3, 4]. These isoforms appear to differentially affect synaptic and dendritic
morphology. In particular, CaMKII is important for regulating synaptic strength and stabilization of dendritic arbors [5]. CaMKII seems to have a greater effect on the degree of dendritic arborization, as well as the formation and number of synapses [6]. These differences may reflect the different developmental time courses of their
expression. In addition to the markedly different roles in neuronal plasticity, the and
CaMKII is highly concentrated in the PSD [10, 11] suggesting that one or more docking sites within the PSD likely mediate its postsynaptic accumulation. Recent work indicates that the cytocolic tails of the NR2A and NR2B subunits of the NMDA receptor bind to CaMKII, thus serving as docking sites within the PSD [12-14]. Hell and co-workers found that both phosphorylated and unphosphorylated CaMKII can bind to these NMDA receptor subunits (Leonard, et al., 1999). However, activation of CaMKII, via NMDA receptor stimulation, greatly increases its affinity for the NMDA receptor.
In addition to their role in binding CaMKII, the c-terminal tails of the NR2A and NR2B subunits are also required for proper localization of functional NMDA receptor to the synapse [15]. The carboxyl terminal tails of the NR2 subunits contain protein binding sequences required for their interaction with MAGUK family proteins (PSD-95, SAP102, PSD-93 and SAP97) [15-17]. This interaction facilitates their localization to the synapse. Deletion of the NR2A or NR2B c-terminal tails results in the near total loss of synaptic NMDA localization [15, 18-21]. Furthermore, the loss of the NR2B c-terminus results in neonatal death, phenocopying the full length knockout of the NR2B subunit [18, 21, 22] and deletion of the NR1 subunit [23, 24].
Given the potential importance of the NMDA receptor’s NR2 subunits for
nucleating CaMKII at the PSD, our lab acquired two knockin mutant mouse lines created in the Seeburg lab; NR2Ac/c and NR2Bc/c. Both of these mouse lines contain deletions of their carboxyl terminal cytoplamsic tails [18]. These two mouse strains were crossed to produce animals heterozygous for both NR2Ac/c and NR2Bc/c. Progeny
used to study the effects of the loss of cytoplasmic tails on CaMKII localization to the PSD.
In addition to the NMDA receptor, we hypothesized that Densin may act as a second docking site for CaMKII in the PSD. Biochemical studies performed in the Kennedy lab found that Densin can bind CaMKII in its intracellular domain [25]. Similar to the interaction of CaMKII with the NR2 tails, binding of the kinase to Densin does not require autophosphorylation. However, activation by autophosphorylation increases the affinity of CaMKII for Densin ~100 fold [25].
In the following series of experiments, we set out to test the hypothesis that Densin and the NMDA receptor are the primary docking sites for CaMKII in the PSD. we proposed to do this by analyzing changes in co-localization of CaMKII with PSD-95 in dissociated hippocampal cultures via immunofluorescent image analysis. We
hypothesize that the loss of the NR2 tails will result in a decrease of CaMKII localization at the PSD. Consequently, we first analyze colocalization of CaMKII with PSD-95 in NR2Ac/c
x NR2Bc/c
primary hippocampal cultures. Loss of the NR1 subunit causes the NR2 subunits to be retained in the endoplasmic reticulum, resulting in the loss of NMDA receptor at the synapse [26]. Consequently, we hypothesize that primary
Lysine (Sigma, St. Louis, MO). Cultures were maintained in neurobasal media
(Invitrogen, Carlsbad, CA) and supplemented with B27, glutamate, and Glutamax-I
(Invitrogen). Genotypes of cell cultures were determined with genomic DNA isolated
from embryonic tissue.
After 18-21 days in vitro, cover slips coated with cells were rinsed in ice-cold PBS and placed briefly in ice-cold methanol. The methanol was replaced with -20oC
methanol and incubated at -20o
C for 10-15 min. Cells were rinsed and incubated in
h-PBS (450mM NaCl and 20mM phosphate buffer, pH 7.4) for 15 min and blocked with
5% normal goat serum and 0.05% Triton X-100 in h-PBS for 1 hour at 4o
C. Fixed
cultures were then placed in preblock buffer for one hour. Fixed cultures were then
incubated overnight with primary antibodies; rabbit anti-PSD-95 (D27E11, 1:200; Cell
Signaling, Beverly, MA) and mouse anti-CaMKII (6G9, 1:1000; ABR, Golden, CO).
Coverslips were washed three times (15 min per wash) in blocking buffer followed by
incubation with goat anti-mouse conjugated to Alexa 568 and goat anti-rabbit conjugated
to Alexa 488 secondary antibodies (Molecular Probes) at room temperature for 1 hour.
Coverslips were then washed once in blocking buffer for 15min and twice in PBS for 15
min. Coverslips were then post-fixed in 2% paraformaldehyde in PBS for 10 min
followed by two washes in PBS for 10 min each. Finally, coverslips were mounted on
microscope slides with a drop of Prolong antifade reagent (Invitrogen) and allowed to dry
4.3
Fluorescent microscopy and image analysis
All immunofluorescent images were acquired on a Zeiss Axiovert 200M
(Thornwood, NY) fluorescent microscope equipped with a 63x/1.4 oil objective and a
high-resolution CCD camera (Axiocam MRm) controlled by Zeiss AxioVision 3.1
imaging software. Image exposure time was independently determined for each
experiment by setting the exposure length to sub-maximal pixel brightness based on
wildtype images. All images from the same experiment were acquired under identical
settings.
Image analysis was conducted with the NIH ImageJ software program. PSD-95
was used as the marker for the PSD region. Threshold for PSD-95 immunostaining was
set to allow all recognizable PSD-95 puncta to be included in the creation of the mask.
The PSD-95 mask was then overlayed onto the CaMKII image. All CaMKII puncta that
colocalized with the PSD-95 mask were measured for intensity. 15-20 neurons were
analyzed per embryo. Each genotype was analyzed at least three different times from
litters dissected from three different pregnant females. Mutant animals were always
compared to wild type litter mates.
Values for brightness of CaMKII puncta normalized to wild type littermates were
analyzed with the Prism statistical package (Graphpad, San Diego, CA) and normalized
to wt. The one-sample t test (two-tailed) was used to determine whether the brightness of
CaMKII puncta in mutant neurons was significantly different from that of wild type
neurons. Data are presented as averages +/- standard error of the mean (SEM) with
correlating p-value. All images are presented without alterations to brightness or
4.4 Quantitative
immunoblot
Preparations of forebrain homogenates for immunobloting were performed as
previously described (Section 2.5). Blots of five wt/ko sibling pairs were probed, in
triplicate, for the following proteins: aCaMKII (6G9, 1:2500), synGAP (PA1-046,
1:1000), PSD-93 (PA1-043, 1:300), and PSD-95 (7E3, 1:2000; ABR, Golden, CO);
GluR1 (1:500) and GluR2/3 (06-307, 1:200) from Upstate Biotechnology, Lake Placid,
NY; -Actinin (EA-53, 1:3000) and Actin (1:5000) from Sigma, St. Louis, MO; NR1
(1516, 1:700; Chemicon, Temecula, CA); -Catenin (1:4000), NR2A (Uma, 1:2500),
(NR2B Xandria, 1:2500), -Catenin/ NPRAP (1:300,) and Citron (CT261, 1:1000)
developed in house; and Erbin, 1:1000 (a generous gift from Lin Mei, Medical College of
Georgia, Augusta, GA). Blots were visualized with the Odyssey Infrared Imaging
System (Li-Cor Bioscience, Lincoln, NE). Quantification of integrated IR fluorescence
intensity was performed with the Li-Cor Odyssey analysis software. Statistical analysis
was performed using the Prism software package. A one-sample t test (two-tailed) was
used to determine whether fluorescence intensity of protein bands from knockout animals
was significantly different from that of wild type litter mates. Data are presented as
average +/- (SEM) with correlating p-value.
Results
4.5
Docking of CaMKII in the PSD
global decrease in CaMKII expression. This can result from a loss of activity dependent
CaMKII protein expression.
4.6
Decrease in the concentration of core PSD proteins in the Densin
knockout
To determine if the loss of Densin affected the composition of the PSD we
measured the level of several other core PSD proteins by quantitative immunoblot.
We found that the amounts of NR1 and NR2A subunits of the NMDA receptor
significantly decreased (-22.0% +/- 4.3, p<0.05; -36.4% +/- 4.3 P<0.01, respectively)
compared to wild type (Fig 4.5). Given that we found no significant decrease in the
NR2B subunit, these data suggest that the composition of the NMDA receptor in the
forebrain is shifted towards NR1-NR2B receptors in the Densin knockout mouse.
Furthermore, we found a change in the ratio of expression of AMPA subunits.
Specifically, the GluR2 subunit decreased by 24.24% +/- 1.9 (p<0.01) and GluR1 show
no statistically significant change.
Erbin, a member of the LAP protein family of which Densin is also a member, is
a PSD protein that has high sequence homology with Densin. We wondered whether its
expression might increase as a compensatory response to the loss of Densin. In contrast,
the level of Erbin decreased substantially by 45.1% +/- 3.7 (p<0.0001; Fig 4.5). Its level
was the most significantly affected of any of the proteins investigated.
PSD-95, a major scaffolding molecule of the PSD, decreased by 33.31% +/-1.6
95 is known to bind directly to or mediate interactions with all of the PSD proteins whose
expression levels are significantly decreased. Thus, our results suggest that the loss of
Densin may destabilize a PSD complex that is organized by PSD-95.
Finally, we found that CaMKII was significantly decreases by 18.12% +/-2.7
(p<0.01). This global decrease may result from a loss of activity dependent translation or
degradation.
Core PSD proteins that did not exhibit significant changes in their level of
expression were -Actinin, NR2B, SynGAP, PSD-93, -catenin, -catenin, Citron, and
WT
NR2A
∆c/∆cx
NR2B
∆c/∆cNR1 ko
PSD95
Overlay
α
CaMKII
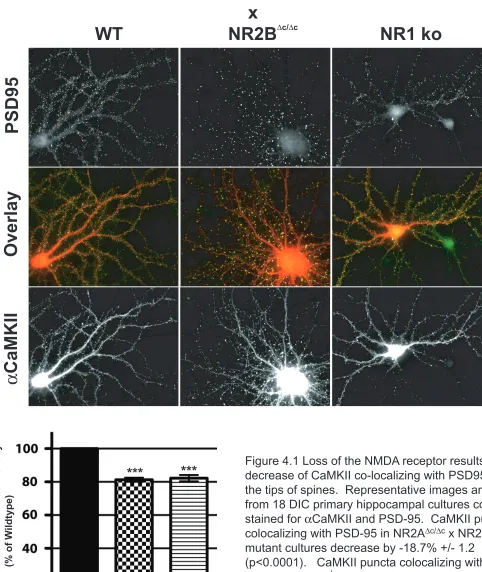
Figure 4.1 Loss of the NMDA receptor results in a decrease of CaMKII co-localizing with PSD95 at the tips of spines. Representative images are from 18 DIC primary hippocampal cultures co-stained for αCaMKII and PSD-95. CaMKII puncta colocalizing with PSD-95 in NR2A∆c/∆c x NR2B∆c/∆c
mutant cultures decrease by -18.7% +/- 1.2 (p<0.0001). CaMKII puncta colocalizing with PSD-95 in NR1-/- knockout cultures decrease by
-17.7% +/- 1.9 (p<0.0001).
Colocalized CaMKII Puncta Intensity
(% of W
ildtype)
***
***
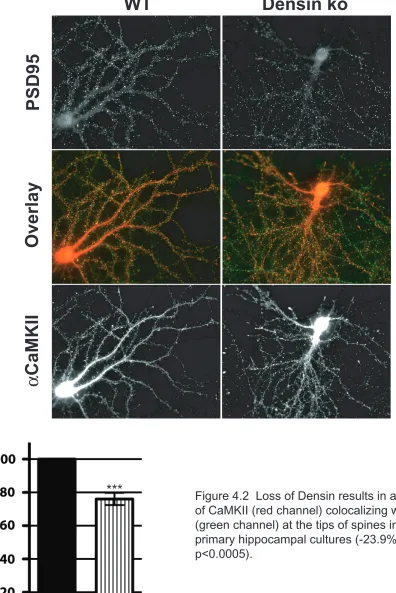
WT
Densin ko
PSD95
Overlay
α
CaMKII
Figure 4.2 Loss of Densin results in a decrease of CaMKII (red channel) colocalizing with PSD95 (green channel) at the tips of spines in 18 DIC primary hippocampal cultures (-23.9% +/- 3.7; p<0.0005).
Colocalized CaMKII Puncta Intensity
(% of W
ildtype)
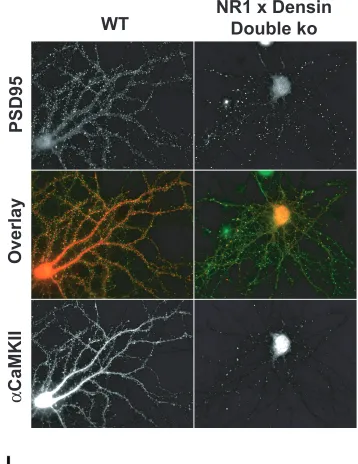
WT
NR1 x Densin
Double ko
PSD95
Overlay
α
CaMKII
Figure 4.3 Loss of both Densin and NR1 results in a synergisitc decrease in CaMKII puncta intensity. The intensity of CaMKII punta
colocalizing with PSD-95 shows a -57.1% +/- 1.16 (p<0.0001) decrease relative to wild type cultures.
Colocalized CaMKII Puncta Intensity
(% of W
ildtype)
Figure 4.4 Representative images of dendritic
branches from Figures 4.1, 4.2, and 4.3. The images shown here represent primary hippocampal cultures made from sibling embryos from a single pregnant female. NR2A∆c/∆c x NR2B∆c/∆c cultures were compared
to their own wild type litter mates.
PSD95
Overlay
α
CaMKII
WT
NR2A
∆c/∆cx NR2B
∆c/∆cNR1 KO
Densin KO
NR1/ Densin
Double KO
Colocalized CaMKII Puncta Intensity
(% of W
Figure 4.5 Loss of Densin results in an altered composition of the postsynaptic density complex. Quantitative immunoblotting of forebrain homogenates was performed to determine the change in the expression of core PSD proteins. Representative blots are shown for core PSD proteins with statistically significant changes. Not shown are immunoblots for proteins that showed no difference (α -Actinin, NR2B, SynGAP, PSD-93, δ-Catenin, Citron, β-Catenin, and GluR1). No
WT
KO
NR1
NR2A
GluR2/3
Erbin
PSD95
α
CaMKII
% Change in Expression
Compared to W
Chapter 5: Global Analysis of the Effect of Densin
Knockout on Gene Transcription in the Brain
Introduction
High throughput methods for analyzing transcriptional changes in response to deletion or mutation of a gene has provided modern biologists with a powerful tool for identifying candidate genes involved in observed phenotypes. Methods such