Comparison of Queuing Algorithms against DDoS
Attack
Santosh Kumar 1, Abhinav Bhandari 2, A. L. Sangal 3 1-3
Computer Science and Engineering, Dr. B. R. Ambedkar, NIT Jalandhar, India
Abstract— In this paper, we are going to present the simulation results of comparison of five queuing algorithms (Drop Tail, Fair Queuing, Stochastic Fair Queuing, Deficit Round Robin and Random Early Detection) using ns-2 as simulation environment. Comparison of the queuing algorithms is based on attack-intensity. We are checking the performance of each queuing algorithm on a particular queue limit against different attack intensities. Here an attempt has been made to cover an overview of Denial of Service (DoS) attack, Distributed Denial of Service (DDoS) attack, methods of attack, DDoS attack tool kits and queuing algorithms. The results in this paper also indicate that UDP type attack traffic is more powerful as compared to TCP type attack in terms of bandwidth consumption.
Keywords— DoS, DDoS, Queuing Algorithms, Attacking methods, DDoS Attack Tool Kits.
I. INTRODUCTION
Denial of service attack is an attempt to prevent the legitimate users from accessing the network resource such as website, computer system or web service [1]. The aim of Denial of Service attack is to send a lot of messages to the server so that it can be crashed, reboot or to do useless works [2]. Distributed Denial of Service attack is an attack which uses so many computers to launch a coordinated Denial of Service attack against one or more targets [3]. To launch a coordinated attack DDoS uses many compromised systems to degrade the performance of target. The target of the Distributed Denial of Service attack is called “primary victim” while the compromised systems that are used to launch DDoS attack are often called “secondary victims”.
From various studies, it has been observed that thousands of attacks occur on regular basis and lots of the attackers escaped easily due to their attacking techniques and few of them get caught or traced. There are many types of attackers who participate in DoS attack. Script kiddies are those attackers who often but not always use scripts or programs developed by sophisticated hackers [4]. Such attackers download attacking tools from the internet and use it unaltered. Sometimes these attackers can cripple the victims and left sufficient traces for the investigators to easily trace them [2]. Sophisticated attackers are those who use several means to hide their identities during attack. They use their own accord for attacking purpose or may be hired by any criminal organization [2]. Potential attackers are smart enough to create their own tools using sophisticated command and control techniques to generate the DDoS attack [2].
Two approaches are used to implement the DoS and DDoS attacks, exploiting the vulnerabilities available on the target or sending a vast number of messages to overwhelm the target. First type of attack is called vulnerability attack and another one is known as flooding attack.
II. METHODS OF ATTACK IN DOS AND DDOS
Further we are going to explain few widely known attacking techniques to implement the DoS and DDoS attacks.
Smurf attack involves an attacker broadcast Internet Control Message Protocol (ICMP) echo requests, while having source address spoofed to show the ultimate victim’s address, to a large group of hosts on a network. After getting the request hosts send their responses to the ultimate victim, whose system is overwhelmed and become unable to provide the services to legitimate users [5].
Ping flood is based on sending the overwhelming number of ping packets to the victim usually using the ping command [6]. It is very simple to launch having aim to access to greater bandwidth than the victim.
Ping of death involved sending IP packet greater than 65,535 bytes. Historically many computers could not handle a ping packet larger than the maximum IPv4 packet size [7]. Sending a ping message of this size could crash the target computer. Also sending a ping message greater than 65,535 is illegal but it can be sent if it is fragmented; and when a target computer reassembles the packet, a buffer overflow can occur that causes the system crash.
SYN flood attack uses TCP three-way handshake. In this attack attacker sends TCP/SYN packets, having spoofed source address. Each of these packets is considered as connection request, causing the server to spawn a half-open connection, by sending back a TCP/SYN-ACK packet and wait for sender response. But response never comes because source address is spoofed. These half open connections saturate the available connections the server is able to make. Hence the server becomes unable to satisfy the legitimate users’ requests [8].
Teardrop attack allows sending mangled IP fragments with overlapping, oversized payloads to target system. This attack can crash various systems due to the bug in their TCP/IP fragmentation reassembly code [9].
In Permanent Denial of Service attack an attacker damages the system so badly that affected system can’t work properly until its hardware replaced or reinstalled [10].
A Nuke is an old denial of service attack that repeatedly sends the invalid ICMP packets to the target until it comes to a complete stop [11].
In Degradation of Service attack, zombies are used by attacker to launch a DDoS attack. Zombies are compromised computers acting as intermediary attackers between the main attacker and victim [12]. Aim of this attack is to degrade the performance of server by flooding the bandwidth.
III.DDOS ATTACK TOOL KITS
by others. Such code is typically built into a general, easily used package called an attack toolkit. It is very common today for attackers to bundle a large number of programs into a single archive file, often with scripts that automate its installation.
Trinoo uses handler agent architecture in which attacker and handler communicate using TCP packets; handler and daemons communicate using UDP packets. Daemons implement the UDP flood attack to degrade the performance of target systems [13].
In Tribe Flood Network (TFN), attacker and control master program uses a command line interface to communicate using ICMP echo reply packets. Smurf, SYN Flood, UDP Flood and ICMP Flood attacks are implemented by TFN’s attack daemons [13].
Stacheldraht combines the features of the Trinoo and TFN tools and also adds the encrypted communication. Stacheldraht uses TCP for encrypted communication between attacker and handlers and it also uses TCP or ICMP for communication between handlers and agents. Agents use TCP SYN Flood, UDP Flood, Smurf attack or ICMP echo flood [14].
In Shaft, the communication between attacker and handlers occur using TCP telnet connection. While the communication between handler and attack daemons is achieved using UDP packets [15].
In Tribe Flood Network 2000 (TFN2K), an encrypted communication happens between the attacker and handlers using a key-based CAST-256 algorithm [16]. While the communication between handler and attack daemons is implemented using all three communication techniques TCP, UDP and ICMP Flood attacks.
IV.QUEUE SCHEDULING ALGORITHMS
A queue scheduling discipline allows us to manage access to the fixed amount of out port bandwidth by selecting which packet should be transferred and which one should be dropped when queue limit is fully occupied. There are many different queue scheduling algorithms to provide the balance between complexity, control and fairness. Congestion occurs when packets arrive at out port faster than they can be transmitted. In this case router interface become congested if just a single packet has to wait for another packet to complete its transmission. The task of queue scheduling algorithms is to minimize the congestion and to provide fair bandwidth to each of different services competing for bandwidth on the output port. It also furnishes protection between different services on output port, so that poorly behaved service in one queue can not impact the bandwidth delivered to the other services. In our simulation we are using the following queue scheduling disciplines available in ns-2.
A. DropTail
Drop Tail is simplest of all queuing algorithms, most widely used in internet routers. It works with fist in first out (FIFO) queue. It stores all the coming packets into a single queue and services them in the same order that they were placed. Function of Drop Tail is shown in the Fig 1.
Fig. 1 DropTail [17]
B. Fair Queuing
FIFO based algorithm DropTail does not discriminate between different traffic sources or in other words it does not separate the packets according to their flows [17]. To resolve this problem Fair Queuing algorithm was proposed. The purpose of this algorithm is to maintain a separate queue for each flow. Discrimination of the traffic sources may be based on packet size or sending rate of sources. And the router services these queues in sort of round robin. To understand this algorithm consider a single flow and imagine a clock that ticks once each time when one bit of a packet is transmitted. Let Pi denotes the length of a packet i, Si denotes the
transmission time when the router starts sending the packet i,
and Fi denotes the time when router stops sending the packet i.
If Pi is expressed in terms of how many clock ticks it takes to
transmit packet i, then it shows that Fi = Si + Pi. Let Ai denote
arriving time of the packet when it reaches on router, then Si
= max (Fi-1, Ai). Now we can compute Fi = max (Fi-1, Ai) + Pi.
Now using this formula we calculate Fi for each packet in
each flow. And we treat Fi as timestamp for each packet. We
compare the timestamp of each packet residing at the head of the each queue and the packet with lowest timestamp is transmitted first.
Consider an example of Fair Queuing algorithm shown in the Fig. 2. Router discriminates the incoming traffic into different flows, Flow 1 and Flow 2. And the arriving packets are stored into the flow in which they belong. In fig 2 (a), flow 1 stores two packets one having the finishing time F=8 and another one having 5 and flow 2 stores one packet having finishing time F=10.The finishing time of packet residing at the head of each queue is compared. The packet with finishing time F=8 of flow 1 is compared with the packet with finishing time F=10 of flow 2 and packet with finishing time F=8 is transmitted first because it is shortest finishing time. After fully transmission of packet having finishing time F=8, again it compares packet of flow 1 with packet of flow 2 and finds that packet having finishing time F=5 is shortest so it is transmitted first and then the packet having finishing time F=10 of flow 2 is transmitted. In Fig 2 (b), the packet of flow 2 having finishing time F=10 is being transmitted and a packet in flow 1 arrives having finishing time F=2 but transmission of the packet of flow 2 is not halted and after completion of this transmission it will send the packet with finishing time F=2.
C. Stochastic Fair Queuing
Stochastic Fair Queuing is an implementation of Fair Queuing. In Fair Queuing a queue was assigned for each flow but Stochastic Fair Queuing uses a hash algorithm to divide the traffic over a limited number of queues [18]. Due to the hashing in SFQ multiple sessions might end up into the same bucket. SFQ changes its hashing algorithm so that any two colliding sessions will only work for a small number of seconds.
D. Deficit Round Robin
Deficit Round Robin uses three parameters, weight, DeficitCounter and quantum [19].
Weight decides how much percentage of output port should be allocated to the queue.
DeficitCounter specifies the number of bytes that should be transmitted by the queue each time when the scheduler visits the queue. It also decides that whether a queue is permitted to transmit the packet or not.
Quantum is proportional to the weight of a queue and also represented in terms of bytes [20].
Fig. 3 Deficit Round Robin [20]
Each queue is visited by the scheduler and determines the number of the packet at head of queue. If the packet size at the head of queue is greater than the value of DeficitCounter then the value of DeficitCounter is incremented by the value of quantum and scheduler moves to the next queue. If the size of the packet at the head of queue is less than or equal to the DeficitCounter then the value of DeficitCounter is reduced by the size of packet and queue is allowed to transmits that packet. Scheduler continues doing this work until the queue is empty or size of the packet at the head of queue become greater than the DeficitCounter.
E. Random Early Detection
Random Early Detection (RED) is one of the queue management schemes. The purpose of RED is to monitor and control the buffer occupancy. The objectives of RED are given below.
Fairly distribute the effect of congestion among all traffic sources competing for the bandwidth by random dropping the packet from the queue.
To avoid the congestion, packet is early dropped when the congestion is imminent.
To achieve these objectives it monitors the status of queue. Let the variable avg be the average size of queue. It checks the average queue size avg to find out whether it lies between some minimum threshold value minth and maximum threshold
value maxth. If it is true then the arriving packet is
marked/dropped with probability p= p (avg) that is increasing function of average queue size. All the arriving packets are dropped when the variable avg does not lie between minth and
maxth. The probability varies between 0 and some value maxp.
The probability can be given as follow.
Pb(avg)=maxp{(avg-minth) / ( maxth-minth)}
If avg>= minth then pb(avg) is used otherwise pb is set to
the value p(avg)/(1+p(avg)) [21]. The avg parameter is initially set to 0. With each arriving packet, the new value is updated as follow.
avg=(1-wq)avg+wqq; where q=actual queue size and
wq=small constant [21].
V. SIMULATION FOR FINDING THE MOST POWERFUL ATTACK
AMONG TCP AND UDP BASED ATTACKS
node 3 and node 4. So data capable of 1Mbps can be transferred by node 3 therefore 30% data will be dropped and also called 30% attack intensity. These data may belong to any of users, may be of TCP user, UDP user or attacker. So finally attacker gets success in consuming the bandwidth.
Fig. 4 Attacking simulation structure
To meet our objective we are going to perform three simulations. Simulation ‘A’ is to find out the bandwidth obtained by legitimate TCP and UDP users in case of attack free traffic. In simulation ‘B’ TCP type attack traffic is applied to affect the legitimate users. In simulation ‘C’ UDP flood attack is applied to affect the legitimate users.
A. Bandwidth obtained by legitimate TCP and UDP users in case of Attack free traffic
Using the simulation model shown in the Fig. 3, legitimate TCP user sends the 40% data, legitimate UDP user sends the 30% data and attacker sends none, it shows that TCP and UDP users want 0.4Mbps and 0.3Mbps bandwidth respectively. Simulation time is 50 seconds. Fig. 5 shows that both legitimate TCP and UDP users get the desired bandwidth 0.4Mbps and 0.3Mbps respectively in case of no attack traffic.
Fig. 5 Bandwidth obtained by TCP and UDP users in case of attack free traffic
B. Effect on legitimate TCP and UDP users during TCP type attack traffic
In this simulation we are going to find out what is effect of TCP type attack traffic on legitimate TCP and UDP users
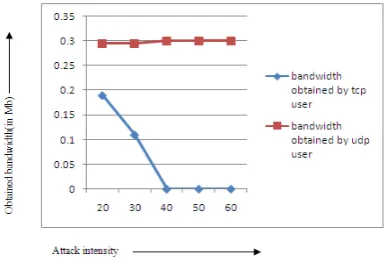
against different attack intensities such as 20%, 30%, 40%, 50% and 60%. Legitimate TCP and UDP users are sending 40% and 30% data respectively and attacker is sending data on varying rate. Fig. 6 shows the result of different attack intensities’ effect on legitimate TCP and UDP users. Result shows that TCP attack traffic does not have any effect on legitimate UDP user. It affects only legitimate TCP user. In case of no attack traffic legitimate TCP user was getting 0.4Mbps bandwidth but in case of TCP attack traffic it is getting 0.35Mbps bandwidth. It shows that it is only getting 87.5% out of allocated bandwidth (0.4Mbps) so there is loss of 12.5% data. And there is a constant effect of TCP attack traffic against varying attack intensities on legitimate TCP user means it is getting the constant bandwidth against varying attack intensities.
Fig. 6 TCP attack’s effect on legitimate TCP and UDP users
C. Effect on legitimate TCP and UDP users during UDP type attack traffic
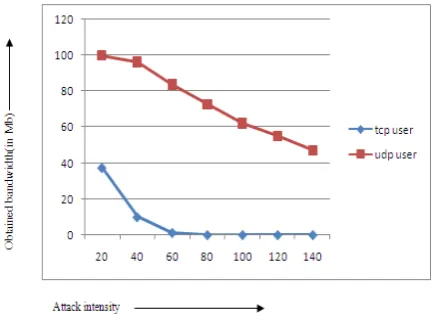
Fig. 7 shows the effect of UDP attack traffic on legitimate TCP and UDP users. Legitimate TCP and UDP users are sending 40% and 30% data respectively and attacker is working with varying attack intensities as shown in the Fig. 7. The following graph shows that UDP attack traffic has greater effect on both users as compared to TCP type attack traffic. TCP user is being affected much as compared to UDP user. As the attack intensities is increased by attacker TCP user get less bandwidth and finally gets 0Mbps bandwidth. During attack intensities, from 20% to 40%, legitimate UDP user obtains the bandwidth for 10 to 50 seconds. From graph it is clear that during the attack intensities from 40% to 60%, legitimate UDP user obtains 100% bandwidth and legitimate TCP user goes down. But at attack intensities 40% to 50% legitimate UDP user obtains the 100% bandwidth only for 15 to 50 seconds and at attack intensity 60% it gets the 100% bandwidth only for 20 to 50 seconds.
Fig. 7 UDP attack’s effect on legitimate TCP and UDP users Bandwidth obtained by TCP
user=0.4Mb
D. Results of simulations
Result of simulation ‘A’ in case of attack free traffic shows that both legitimate TCP and UDP users are getting 100% bandwidth. Simulation having TCP attack traffic shows the effect of attack traffic on legitimate TCP and UDP users. Simulation having UDP type attack traffic shows the effect of attack traffic on legitimate TCP and UDP users. On comparing the results of second and third simulations, it is clear that UDP attack traffic is more powerful as compared to TCP type one. TCP type attack is limited means on increasing the attack intensities still there is a constant effect on both users. While in case of UDP type attack it does not have constant effect first it has greater effect on legitimate TCP user as compare to UDP user and finally it also effect on time for which UDP user obtains the bandwidth.
VI.SIMULATIONS FOR COMPARING THE QUEUING ALGORITHMS
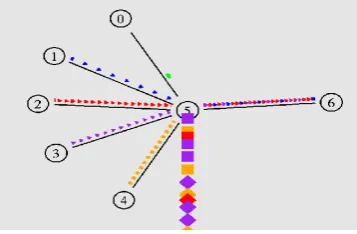
Fig. 8 shows the simulation structure for checking the performance of different queuing algorithms. Node 0, node 1, node 2, node 3, node 4, node 5 and node 6 represent the legitimate TCP user, legitimate UDP user, attacker1, attacker2, attacker3, router and receiver respectively. All the links between nodes have 1Mbps bandwidth and propagation delay of 100ms. These nodes send data packets to receiver and packets first stored on router (node 5) and then forwarded. Each router in internet maintains queues to store data packets and the size of queue may vary. Here we are going to check the performance of each algorithm on queue limit 80 against different attack intensities.
Fig. 8 Simulation structure
A. DropTail performance
In this section we are going to check the performance of DropTail algorithm on queue limit 80 against different attack intensities. Fig. 9 shows the performance of DropTail algorithm. It is clear from the graph that on increasing the attack intensity, bandwidth obtained by legitimate TCP and UDP users are gradually decreasing.
Fig. 9 DropTail performance
B. Fair Queuing performance
Fig. 10 shows the performance of Fair Queuing algorithm. From the graph it is clear that bandwidths obtained by legitimate users decrease when attack intensity increases from 20% to 40%. And there is a constant effect of attack intensities varying from 40% to 140%.
Fig. 10 Fair Queuing performance
C. Stochastic Fair Queuing performance
Fig. 10 shows the performance of Stochastic Fair Queuing algorithm. Graph shows a constant effect of attack intensities on legitimate TCP and UDP users.
Fig. 11 Stochastic Fair Queuing performance
D. Deficit Round Robin performance
Fig. 12 shows the performance of Deficit Round Robin algorithm. It shows that on increasing the attack intensity bandwidth obtained by legitimate TCP user is gradually decreasing while there is a constant effect on bandwidth obtained by UDP user during attack intensity varying from 40% to 140%.
E. Random Early Detection Performance
Fig. 13 shows the performance of Random Early Detection algorithm. This algorithm is not useful for TCP user because it gets nothing when attack intensity goes above 60%. While bandwidth obtained by legitimate UDP user is gradually decreasing on increasing the attack intensity.
Fig. 13 Random Early Detection performance
F. Performance comparison of Queuing Algorithms
Fig. 14(a) and Fig. 14 (b) show the comparison of bandwidth obtained by legitimate TCP and UDP users on different queuing algorithms against different attack intensities. According to Fig. 14(a) legitimate TCP user is getting maximum throughputs in case of Stochastic Fair Queuing algorithm. Fig. 14(b) shows that legitimate UDP user is getting maximum bandwidth 75% in case of Deficit Round Robin. But in case of Deficit Round Robin legitimate TCP user is getting bandwidth 33%. So if we consider throughputs of TCP user then it is not good enough but if we consider only for UDP user then Deficit Round Robin is best algorithm. Fair Queuing algorithm is the second best algorithm to provide the maximum bandwidth to the legitimate UDP users. It is providing 70% bandwidth to legitimate UDP user and 50% to legitimate TCP user. While Stochastic Fair Queuing algorithm is providing 85% throughputs to legitimate TCP user and 55% to legitimate UDP user. So finally, Stochastic Fair Queuing algorithm is best algorithm among all algorithms in case of providing satisfactory bandwidth to the legitimate users in case of having both legitimate TCP and UDP users in network. And second best algorithm is Fair Queuing algorithm.
Fig. 14 (a) comparison of throughputs of TCP user on different queuing algorithms
Fig. 14 (b) comparison of throughputs of UDP user on different queuing algorithms
VII. CONCLUSION
In this paper we discussed basic overview of DoS, DDoS, attacking methods and DDoS attack tool kits. We have also explained about Queuing algorithms including DropTail, Fair Queuing, Stochastic Fair Queuing, Deficit Round Robin and Random Early Detection. The result of experiments suggests that UDP type attack is more powerful attack as compare to TCP type one. On comparing the performance of different queuing algorithms we found that Stochastic Fair Queuing is best algorithm among all algorithms while having both legitimate TCP and UDP users in network.
REFERENCES
[1] Stephen M. Specht, Ruby B. Lee, “Distributed Denial of Service: Taxonomies of Attacks, Tools, and Countermeasures”. In Proceedings of the 17th International Conference on Parallel and Distributed Computing Systems, 2004.
[2] Jelena Mirkovic, Sven Dietrich, David Dittrich, Peter Reither, “Internet Denial of Service: Attack and Defense Mechanisms”, Publisher: Prentice Hall PTR, 2004.
[3] Nathalie Weiler, “Honeypots for Distributed Denial of Service Attacks”. In Proceedings of the Eleventh IEEE International Workshops on Enabling Technologies 2002.
[4] http://www.pctools.com/security-news/script-kiddie.
[5] http://www.cert.org/advisories/CA-1998-01.html
[6] http://www.iss.net/security_center/advice/Underground/Exploitz/Flood s/Ping_Flood/default.htm.
[7] http://compnetworking.about.com/od/networksecurityprivacy/l/bldef_pi ngdeath.htm.
[8] Cisco Systems, Inc., “Defining strategies to protect against TCP SYN denial of service attacks,” July 1999, http://www.cisco.com/warp/public/707/4.html.
[9] Leyden, John (2008-05-21), "Phlashing attack thrashes embedded systems", http://www.theregister.co.uk/2008/05/21/phlashing/.
[10] http://www.pcsympathy.com/2008/05/20/permanent-denial-of-service-attack-sabotages-hardware/.
[11]http://www.irchelp.org/irchelp/nuke/.
[12]“Encyclopedia of Information Technology”, Atlantic Publishers & Distributors.2007.pp.397. ISBN8126907525.
[13]D. Dittrich, “The DoS project's ‘Trinoo’ distributed denial of service attack tool,” Oct. 1999; “The ‘Stacheldraht’ distributed denial of service attack tool,” Dec. 1999; “The ‘Tribe Flood Network’ distributed denial of service attack tool,” Oct. 1999, http://www.washington.edu/People/dad.
[14]D. Dittrich, "The Stacheldraht Distributed Denial of Service Attack
Tool," December 1999, http://staff.washington.edu/dittrich/misc/stacheldraht.analysis.txt.
[15] D. Dittrich, S. Dietrich, and N. Long, “An analysis of the ‘Shaft’ distributed denial of device tool”, 2000, http://netsec.gsfc.nasa.gov/~spock/shaft_analysis.txt
[16]C. Adams and J. Gilchrist, “RFC 2612: The CAST-256 encryption algorithm,” June 1999, http://www. cis.ohiostate. edu/htbin/rfc/rfc 2612.html.
[18]http://opalsoft.net/qos/DS-25.htm
[19] M. Shreedhar, George Varghese, “Eficient Fair Queuing using Deficit Round Robin”, Microsoft Corporation.
[20] Chuck Semiria, “Supporting Differentiated Service Classes: Queue Scheduling Disciplines”, Juniper Networks, Inc.
![Fig. 2 Fair Queuing example (a) packet with shortest finishing times transmitted first; (b) already sending packet completed first [17]](https://thumb-us.123doks.com/thumbv2/123dok_us/7813710.1294674/2.595.303.534.57.265/queuing-example-packet-shortest-finishing-transmitted-sending-completed.webp)
![Fig. 3 Deficit Round Robin [20]](https://thumb-us.123doks.com/thumbv2/123dok_us/7813710.1294674/3.595.65.286.584.732/fig-deficit-round-robin.webp)