Scholarship@Western
Scholarship@Western
Electronic Thesis and Dissertation Repository
12-12-2013 12:00 AM
Studies on Microscopic Flow Structure Inside a Rectangular
Studies on Microscopic Flow Structure Inside a Rectangular
Circulating Fluidized Bed Through Image Analysis
Circulating Fluidized Bed Through Image Analysis
Jingsi Yang
The University of Western Ontario
Supervisor Jesse Zhu
The University of Western Ontario
Graduate Program in Chemical and Biochemical Engineering
A thesis submitted in partial fulfillment of the requirements for the degree in Doctor of Philosophy
© Jingsi Yang 2013
Follow this and additional works at: https://ir.lib.uwo.ca/etd
Part of the Complex Fluids Commons, Process Control and Systems Commons, and the Transport Phenomena Commons
Recommended Citation Recommended Citation
Yang, Jingsi, "Studies on Microscopic Flow Structure Inside a Rectangular Circulating Fluidized Bed Through Image Analysis" (2013). Electronic Thesis and Dissertation Repository. 1781.
https://ir.lib.uwo.ca/etd/1781
This Dissertation/Thesis is brought to you for free and open access by Scholarship@Western. It has been accepted for inclusion in Electronic Thesis and Dissertation Repository by an authorized administrator of
(Thesis format: Integrated Article)
by
Jingsi Yang
Graduate Program in Engineering Science Department of Chemical and Biochemical Engineering
A thesis submitted in partial fulfillment of the requirements for the degree of
Doctor of Philosophy
The School of Graduate and Postdoctoral Studies The University of Western Ontario
London, Ontario, Canada
ii
Abstract
The microscopic flow structure is studied systematically and comprehensively through a visualization system in a narrow rectangular circulating fluidized bed (CFB) transparent Plexiglas riser with a height of 7.6 m and a cross section of 19 mm × 114 mm. A visualization system consisting of a high-speed video camera, a light source, and image processing and analyzing programs is designed and developed to enable the flow structure to be visualized directly and studied quantitatively. FCC particles of 67 μm are used as the bed materials under different operating conditions with superficial gas velocity (Ug) and solids
circulation rate (Gs) in the range of 3.0-12.0 m/s and 50-150 kg/m2s respectively.
To study the microscopic flow structure quantitatively, for the first time, a new calibration method is developed to correlate the solids holdup of the FCC particles and the grayscales of the images obtained by the high-speed video camera, based on the light illumination consistency verified by a reference plate. To achieve stable and homogeneous fluidization with uniform solids holdup, the calibration experiment is conducted in a well-designed liquid-solid bed. The obtained calibration curve and equation are used as the basis for the entire study. With the calibration method, cluster can be “peeled-off” by given solids holdup thresholds through transforming the original gray images into binary images. The change in cluster population with operating conditions consistent with previous researchers further proves that the image calibration method developed in this study is effective and very useful.
To further verify the newly developed image calibration method, an optical fiber probe is applied as a reference for the measurements of the solids holdup of the FCC particles. The solids holdup distribution profiles obtained from the two methods under identical operating conditions have good agreement, reflecting the reliability of the image calibration method. Further comparison of the results of image calibration method from the current study with the measurement results of optical fiber probe from other researchers also show good agreement under the same operating condition. These comparisons clearly confirm the feasibility and accuracy of the image calibration method.
iii
the mean solids holdup increases with the increasing Gs and decreases with Ug. The
transformation from grayscale images into Hue, Saturation and Value (HSV) images using various solids holdup thresholds allows the dense and dilute phases with obviously different solids holdup to be clearly visualized under different operating conditions in the fully developed region. A term “relative dense phase area” is introduced to quantify the solids phase separation. A critical solids holdup value of εsc = 0.04 is chosen by carefully examining
the variation profiles of the relative dense phase area with solids holdup thresholds, to demarcate the dilute and dense cluster phases. The cluster fraction is then obtained through the εsc value and ranges from 1 % to 59 % under the different operating conditions of present
research. With images divided into three regions along the lateral direction, it is found that cluster fraction at the wall region is higher than that of the core and the middle regions.
With further examining the solids holdup distribution of the microscopic structures, the dense (or cluster) phase is considered as a “compound” of core clusters and intermediate dispersed particles, which is in the processing of coalescence or breakup, with higher solids holdup than the dilute phase. To identify stable existing core clusters, a systematic cluster identification process is presented by adopting a threshold selection method to obtain the cluster threshold solids holdup (εsct) so that clusters can be identified under different
operating conditions. The cluster fraction is calculated by dividing the total number of pixels belonging to the core cluster with the total pixels number of the entire image. Based on the εsct, a cluster equivalent diameter (dc) is determined by the area of the cluster in the binary
image. At the same time, the cluster solids holdup can be determined by converting the grayscale of the cluster from the original image to the solids holdup. Moreover, cluster vertical velocity can be determined by the shift of clusters between sequential binary images. Typical dense (Ug = 3.0 m/s; Gs =100 kg/m2s) and dilute (Ug = 9.0 m/s; Gs =50 kg/m2s)
operating conditions are selected to compare the variation of the cluster size and velocity.
Keywords
iv
Co-Authorship Statement
Title: A novel method based on image processing to visualize clusters in a rectangular circulating fluidized bed riser
Authors: Jingsi Yang and Jesse Zhu
The experimental setup for the image calibration method was designed and modified by Jingsi Yang together with Jianzhang Wen under the guidance of supervisor Dr. Jesse Zhu. The experimental setup for the visualization system was designed and modified by Jingsi Yang together with Michael Zhu under the guidance of supervisor Dr. Jesse Zhu. Jingsi Yang carried out the experiments, image processing and data analysis under the guidance of supervisor Dr. Jesse Zhu. All experimental work was conducted by Jingsi Yang and the draft of this manuscript was written by Jingsi Yang. Revisions were carried out under the close supervision of Dr. Jesse Zhu. The final version of this paper has been accepted for publication in Powder Technology, POWTEC-D-13-01489.
Title: An alternative method for mapping solids holdup in a rectangular CFB riser through image calibration
Authors: Jingsi Yang and Jesse Zhu
Jingsi Yang carried out the experiments, image processing and data analysis under the guidance of supervisor Dr. Jesse Zhu. All experimental work was conducted by Jingsi Yang and the draft of this manuscript was written by Jingsi Yang. Revisions were carried out under the close supervision of Dr. Jesse Zhu. The final version of this paper has been accepted for publication in The Canadian Journal of Chemical Engineering, CJCE-13-0705.
Title: Visualization of solids phase separation in a rectangular CFB riser using a novel image calibration method
Authors: Jingsi Yang and Jesse Zhu
v
and the draft of this manuscript was written by Jingsi Yang. Revisions were carried out under the close supervision of Dr. Jesse Zhu. The final version of this paper was submitted to the Chemical Engineering Science, CES-D-13-01757.
Title: Cluster identification in a rectangular circulating fluidized bed using image processing
Authors: Jingsi Yang and Jesse Zhu
Jingsi Yang carried out the experiments, image processing and data analysis under the guidance of supervisor Dr. Jesse Zhu. All experimental work was conducted by Jingsi Yang and the draft of this manuscript was written by Jingsi Yang. Revisions were carried out under the close supervision of Dr. Jesse Zhu. The final version of this paper is ready for submission.
Title: Determination of cluster size and velocity by means of image processing in a rectangular circulating fluidized bed
Authors: Jingsi Yang and Jesse Zhu
vi
Acknowledgments
Four years is time long enough to develop big changes in a person, not only physically, but most important, intellectually. As I look back, many things have changed during this four-year time span; however, one fact that cannot be changed is that this journey would not have been as meaningful and fruitful as it is now, without the help and support from so many people whom I am privileged and honored to know.
I would like to express my deepest and sincerest appreciation to my supervisor Dr. Jesse Zhu, a famous scientist, a modest scholar, a respected teacher and a kind friend, for his encouragement, guidance, inspiration and continuous support during these years. His meticulous supervision and personality charm not only opened my eyes in the field of research but also in pondering the meaning of life.
Much appreciation is extended to Dr. M. Ray and Dr. C. Briens for their constructive suggestions as examiners for my comprehensive exam and to Dr. Tao Zhou in Central South University of China for his invaluable guidance and encouragement in the past.
My special thanks is directed to Mr. Jianzhang Wen and Mr. Michael Zhu for their help in constructing the CFB equipment and the visualization system. Many thanks go to George Zhang for his kind material and reference service work.
Special appreciation goes to Dongbin Li and Jing Xu who offered their experience in the operation of the experiments, which was very helpful in starting my project. Many thanks go to Chengxiu Wang for those “endless” discussions and good suggestions. My appreciation goes to Drs. Zhijie Wang and Bin Gu in the Department of Medical Biophysics and Medical Imaging for their kind help and good suggestions in image processing and MATLAB programming. Appreciation is also extended to Huan Gao in the Department of Statistical and Actuarial Sciences and Xiulan Lai in the Department of Applied Mathematics for their valuable and professional advice and support. My deepest thanks is extended to Dr. Yu Chen for her support in the optical fiber probe calibration experiment.
vii
Ma, and group members Long Sang, Jing Fu, Shan Gao and Qingliang Yang for their help and advice.
Thanks also go to Joanna Blom, Kara Malott, Stephanie Demakos, Kristen Hunt, Ashley Jokhu and Sarah Williams in our department for their kind help and support. The financial supports of the China Scholarship Council (CSC) and the National Science and Engineering Research Council of Canada (NSERC) are gratefully acknowledged.
My sincere thanks goes to the Herberts’ family, David, Irene, Trent, Laurie and the children for their moral support, sincere friendship and all the kindness, which makes my life far from home easier. My sincere gratitude is also extended to my friends, Jiazi Liu, Longyan Cheng, Shanghuan Feng, Yu Guo and Daoping Guo who helped me a lot during my tough times.
This research work is dedicated to my father and late mother. My extreme appreciation goes to them for their selfless loving, continuous inculcating and patient listening. I could not have fulfilled this without their consistent and unreserved support.
viii
Table of Contents
Abstract ... ii
Co-Authorship Statement... iv
Acknowledgments... vi
Table of Contents ... viii
List of Tables ... xiv
List of Figures ... xv
Chapter 1 ... 1
1 General Introduction ... 1
1.1 Research background ... 1
1.2 Research Objectives ... 4
1.3 Thesis structure ... 5
References ... 7
Chapter 2 ... 11
2 Literature Review ... 11
2.1 Introduction ... 11
2.2 Measurement techniques ... 13
2.2.1 Intrusive measurement technique ... 13
2.2.2 Non-intrusive measurement techniques ... 15
2.3 Microscopic studies in the CFB ... 17
2.3.1 Micro-flow structure inside CFB ... 18
2.3.2 Cluster identification ... 24
2.3.3 Cluster characteristics ... 25
2.3.4 Cluster studies using visualization measurement techniques ... 31
ix
References ... 37
Chapter 3 ... 47
3 Experimental systems and Measurements ... 47
3.1 Experimental systems ... 47
3.1.1 Fluidization system ... 47
3.1.2 Visualization system ... 49
3.2 Measurements ... 52
3.2.1 Measurements of superficial gas velocity ... 52
3.2.2 Measurement of solids circulation rate ... 52
3.2.3 Measurement of local solids holdup ... 53
3.3 Operating and measurement conditions ... 60
3.4 Summary ... 60
References ... 61
Chapter 4 ... 62
4 A novel method based on image processing to visualize clusters in a Rectangular Circulating Fluidized Bed Riser ... 62
4.1 Introduction ... 62
4.2 Experimental ... 66
4.2.1 Circulating fluidized bed and operating conditions ... 66
4.2.2 Visualization system ... 68
4.2.3 Description of the apparatus ... 69
4.3 Results and Discussion ... 70
4.3.1 Light illumination consistency analysis ... 70
4.3.2 Relationship between grayscale and solids holdup ... 73
4.3.3 Visualization of clusters under different operating conditions ... 76
x
Acknowledgements ... 81
References ... 81
Chapter 5 ... 85
5 An alternative method for mapping solids holdup in CFB riser through image calibration ... 85
5.1 Introduction ... 85
5.2 Experiment apparatus ... 87
5.2.1 Rectangular CFB apparatus ... 87
5.2.2 Optical fiber probe measurement system ... 87
5.2.3 The visualization system and the image calibration method ... 89
5.3 Results and discussion ... 90
5.3.1 Radial distribution of solids holdup based on the image calibration method ... 90
5.3.2 Verification using the optical fiber probe ... 93
5.4 Conclusions ... 98
Acknowledgements ... 98
References ... 98
Chapter 6 ... 102
6 Visualization of solids phase separation in a rectangular CFB riser using a novel image calibration method ... 102
6.1 Introduction ... 102
6.2 Experimental ... 104
6.2.1 Rectangular CFB apparatus and operating conditions ... 104
6.2.2 Visualization system ... 106
6.3 Results and discussion ... 107
6.3.1 Calibration between image grayscale and solids holdup ... 107
xi
6.3.3 Visualization of solids phase distribution ... 111
6.3.4 Solids phase separation ... 116
6.3.5 Cluster distribution... 117
6.4 Conclusions ... 120
Acknowledgements ... 121
References ... 121
Chapter 7 ... 126
7 Cluster identification in a rectangular circulating fluidized bed using image processing ... 126
7.1 Introduction ... 126
7.2 Experimental ... 128
7.2.1 CFB apparatus ... 128
7.2.2 Visualization system ... 130
7.3 Results and discussion ... 131
7.3.1 Solids holdup examination inside the CFB ... 131
7.3.2 Cluster threshold solids holdup ... 132
7.3.3 Visualization of core clusters using the cluster threshold solids holdup... 135
7.4 Conclusions ... 137
Acknowledgements ... 138
Nomenclature ... 138
References ... 139
Chapter 8 ... 142
8 Determination of cluster size and velocity by means of image processing in a rectangular circulating fluidized bed ... 142
8.1 Introduction ... 142
xii
8.2.1 CFB apparatus ... 144
8.2.2 Visualization system ... 146
8.2.3 Visualization operating conditions ... 148
8.3 Results and Discussion ... 148
8.3.1 Cluster fraction under different operating conditions ... 148
8.3.2 Determination of cluster size ... 150
8.3.3 Determination of cluster vertical velocity ... 152
8.4 Conclusions ... 155
Acknowledgements ... 156
Nomenclature ... 156
References ... 157
Chapter 9 ... 161
9 Conclusions and Recommendations ... 161
9.1 Conclusions ... 161
9.2 Recommendations ... 163
Appendices ... 165
Appendix A1 Results analysis for the calibration experiment between the solids holdup and the grayscale ... 165
Appendix A2 An example of error bars for the grayscales of the reference plate in the testification of light illuminance consistency ... 168
Appendix B1 Raw data of radial distribution of solids holdup based on the image calibration method under different operating conditions ... 170
Appendix B2 Raw data of mean solids holdup obtained by the image calibration method under different operating conditions ... 173
Appendix B3 Raw data of relative dense phase area with different solid holdup thresholds under different operating conditions ... 173
Appendix B4 Raw data of cluster thresh solid holdup under different operating conditions ... 174
xiii
xiv
List of Tables
Table 2.1 Clusters studies using different measurement techniques ... 18
Table 2.2 Summary of solids aggregation forms in CFBs (Bi et al., 1993) ... 20
Table 2.3 Clusters studies with visualization techniques in gas-solid flow ... 33
xv
List of Figures
Figure 2.1 Illustration of proposed particle aggregation processes (Bi et al., 1993) ... 19
Figure 2.2 Photographs of clusters of FCC particles in the riser (Li et al., 1991) ... 21
Figure 2.3 Photographs in the dilute transportation regime (Horio and Kuroki 1994) ... 22
Figure 2.4 Clusters at the annulus region (Xu and Zhu, 2010) ... 23
Figure 2.5 Clusters with U-shape at the core region (Xu and Zhu, 2010) ... 23
Figure 2.6 Images of clusters in the downer (Lu et al., 2005) ... 24
Figure 2.7 Radial variations of solids holdup inside clusters (Sharma et al., 2000) ... 26
Figure 2.8 Radial profiles of the mean solids holdup inside cluster at different operating conditions (Manyele et al., 2002) ... 27
Figure 2.9 Example of the signal from the optic fiber probe (Li et al., 1995) ... 28
Figure 3.1 Schematic diagram of the rectangular circulating fluidized bed ... 48
Figure 3.2 Visualization system ... 49
Figure 3.3 Quartz halogen bulb ... 50
Figure 3.4 Digital illuminance meter ... 50
Figure 3.5 High-speed video camera ... 50
Figure 3.6 1.3-megapixel CMOS active-pixel digital image sensor ... 51
Figure 3.7 Schematic diagram of optical fiber probe and its working principle ... 54
xvi
Figure 3.9 Solids holdup calibration curve of the optical fiber probe
for the spent FCC particles ... 56
Figure 3.10 Schematic diagram of the calibration system for grayscale and solids holdup ... 57
Figure 3.11 Image similarity of the two different mediums ... 58
Figure 3.12 Calibration curve between solids holdup and grayscale ... 59
Figure 4.1 Schematic diagram of the rectangular circulating fluidized bed ... 67
Figure 4.2 Visualization system ... 68
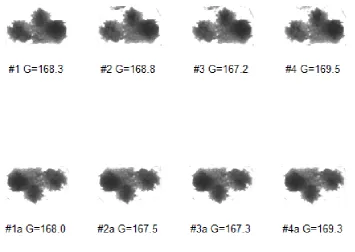
Figure 4.3 Formation of the reference plate ... 71
Figure 4.4 Stability of the four bulbs in original and upside-down positions ... 71
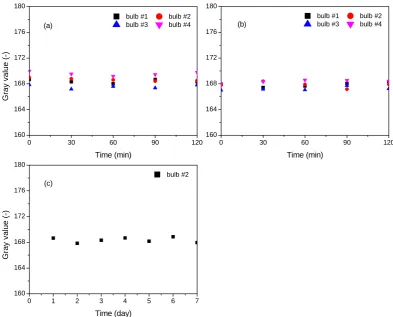
Figure 4.5 Stability of the four bulbs with different time periods: (a) first day; (b) second day; (c) one week ... 73
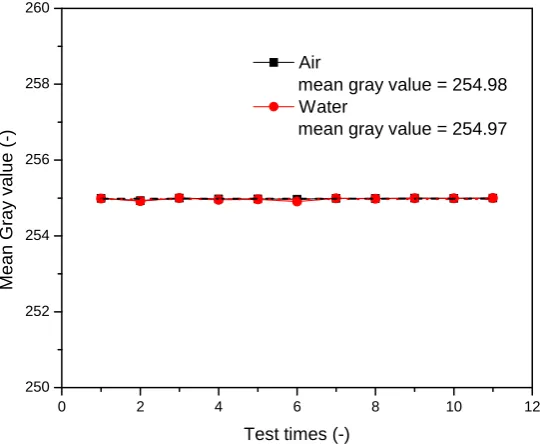
Figure 4.6 Image similarity of the two different mediums ... 74
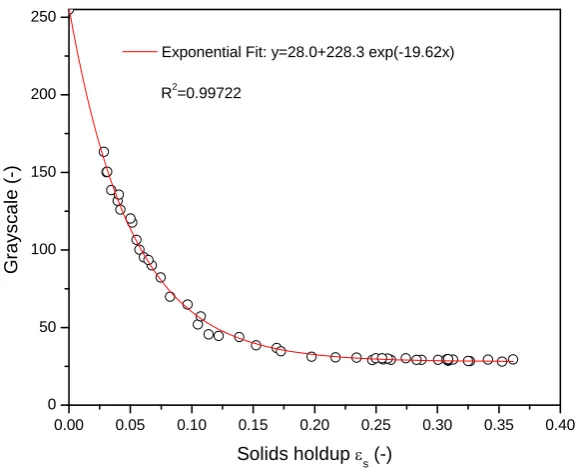
Figure 4.7 Calibration curve between solids holdup and grayscale ... 76
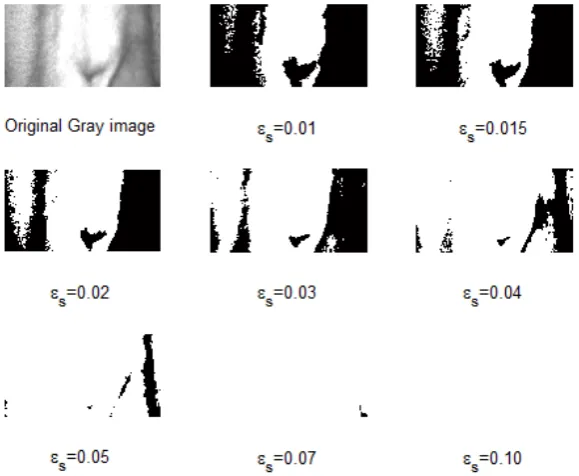
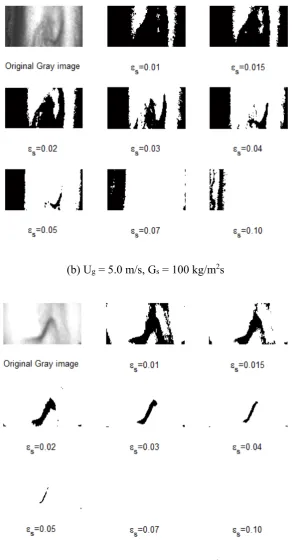
Figure 4.8 Binary images under different operating conditions with different solids holdup thresholds. ... 78
Figure 4.9 Black area percentages versus solids holdup thresholds under different operating conditions ... 80
Figure 5.1 Schematic diagram of the rectangular circulating fluidized bed ... 88
Figure 5.2 Visualization system ... 89
Figure 5.3 Calibration curve between solids holdup and grayscale ... 90
xvii
Figure 5.5 Radial distributions of solids holdup based on
image calibration method under different superficial gas velocities ... 93
Figure 5.6 Comparing the radial distribution of solids holdup between image calibration method and optical fiber probe under different solids circulation rates ... 94
Figure 5.7 Comparing the radial distribution of solids holdup between image calibration method and optical fiber probe under different superficial gas velocities ... 95
Figure 5.8 Comparing solids holdup measurement between image calibration method and optical fiber probe ... 96
Figure 5.9 Comparing the radial solids holdup profiles between this study and previous researches ... 97
Figure 5.10 Comparing the measurements of the image calibration method between this study and those of the optical fiber probe in the previous research (corresponding to Figure 5.9 (d)) ... 97
Figure 6.1 Schematic diagram of the rectangular circulating fluidized bed ... 105
Figure 6.2 Visualization system ... 106
Figure 6.3 Calibration curve between solids holdup and grayscale ... 108
Figure 6.4 Mean solids holdup obtained by the image calibration method at the fully developed region in the riser ... 110
Figure 6.5 Grayscale distributions under typical dense and dilute operating conditions .... 111
Figure 6.6 Binary image variations with different solids holdup thresholds ... 112
Figure 6.7 Relative dense phase area vs. solids holdup thresholds ... 114
xviii
Figure 6.9 Variation of the relative dense phase area and its first derivative
with the solids holdup threshold ... 117
Figure 6.10 Variation of dense phase fraction with operating conditions ... 118
Figure 6.11 Variation of dense phase fraction with radial positions ... 119
Figure 6.12 Variation of cluster fraction using different εsc with mean solids holdup ... 120
Figure 7.1 Schematic diagram of the rectangular circulating fluidized bed ... 129
Figure 7.2 Visualization system ... 130
Figure 7.3 Flow structure exhibition (Ug = 3.0 m/s, Gs = 100 kg/m2s) ... 131
Figure 7.4 Histogram of grayscale ... 134
Figure 7.5 The critical solids holdup (εsc) and the cluster threshold solids holdup (εsct) ... 134
Figure 7.6 Image exhibition of flow structure under εsc and εsct ... 135
Figure 7.7 Variation of cluster fraction with superficial gas velocity ... 136
Figure 7.8 Cluster threshold solids holdup under different operating conditions ... 136
Figure 7.9 Examples of clusters under different operating conditions ... 137
Figure 8.1 Schematic diagram of the rectangular circulating fluidized bed ... 145
Figure 8.2 Visualization system ... 146
Figure 8.3 Variation of cluster fraction with superficial gas velocity ... 149
Figure 8.4 Variation of cluster fraction with solids circulation rate ... 149
Figure 8.5 Demonstration of cluster size determination based on image processing ... 150
Figure 8.6 Cluster equivalent sizes under the two different operating conditions ... 151
xix
Figure 8.8 Cluster vertical velocity under the two different operating conditions ... 154
Figure 8.9 Relationship between the cluster vertical velocity
and the clusters equivalent diameter ... 154
Figure 8.10 Variation of relative velocity of clusters with cluster equivalent diameter ... 155
Figure A1.1 Calibration apparatus and local enlarged demonstration for results analysis .. 167
Figure A1.2 Results comparison between the pressure measurement
and the bed height reading methods ... 168
Figure A2.1 Error bars for grayscale measurement ... 169
Chapter 1
1
General Introduction
A newly developed image calibration method in combination of the image processing is applied to study the microscopic flow structure in this work. An introduction of the research background, objectives and the thesis structure are presented in this Chapter.
1.1 Research
background
In gas-solid circulating fluidized beds (CFBs), the flow structure is complex due to the formation of particle aggregates. The existence of particle aggregates has been widely accepted by many studies since the concept of “clusters” was introduced by early researchers (Yerushalmi and Squires, 1975; Grace and Tuot, 1979). Further studies indicate that the presence of clusters is also responsible for high gas-solid slip velocity and the core-annulus flow development (Rhodes, et al., 1989; Horio and Kuroki, 1994; Kuroki and Horio, 1994; Bai et al., 1995). With the progressing of studies on the microscopic flow structure, it is found that particle clustering causes the significant alteration to the gas drag exerted on the particles and thus makes the experimental understanding and the modelling of the gas-solids two phase flow extremely difficult. These make the study of the micro-flow structure very necessary. In addition, the cluster structure and other properties as well as their mechanisms of formation and breakup are still unclear. Therefore, more investigations are needed before further insights about the characteristics and hydrodynamics of clusters can be obtained.
solids holdup and particle velocity. The latter, however, is preferable due to the little disturbance to the flow. Comparing to the intrusive techniques, visualization techniques were first utilized as a non-intrusive method only providing qualitative indications and mapping the overall flow structures. However, with the development and improvement of modern video cameras and application of imaging process and analysis methods, more and more quantitative information are provided by the non-intrusive methods (Zou et al., 1994; Lim et al., 1996; Lackermeier et al., 2001; Casleton et al., 2010; Cocco et al., 2010; Xu and Zhu, 2011; 2012; Shaffer et al., 2013; McMillan et al., 2013).
Both intrusive (Brereton and Grace, 1993; Zhou et al., 1994; Li et al., 1995; Pandey et al., 2004; Xu and Zhu, 2010) and non-intrusive methods mentioned above have revealed that clusters varies in shapes, sizes and velocities, studies about the cluster characteristics are still far from enough. Based on three guidelines to identify the clusters, cluster characteristics including solids holdup in cluster, occurrence frequency, duration time and time fraction for cluster existence are obtained using a capacitance probe technique (Soong et al., 1993; 1995; Tuzla et al., 1998; Sharma et al., 2000). Manyele et al. (2002) reported their investigation of the aggregate properties in a high-flux and high-density riser using a fiber optic probe. The aggregate frequency, time fraction, existence time, average solids concentration and cluster vertical dimension were established using sensitivity analysis. They also revealed the dependence of the aggregate properties on the operating conditions. Xu and Zhu (2011; 2012) adopted the sensitivity analysis and studied the cluster characteristics including cluster time fraction, cluster mean existence time, cluster frequency and cluster size and velocity as well. Lackermeier et al. (2001) studied the particle aggregates properties by applying high-speed video technique in combination with the laser sheet technique. By adding the image sequences, cluster image were obtained with cluster size and velocity calculated.
information at any point within the measurement zone. The specialties of the two kinds of methods lead to their own criterion to identify the clusters.
For a number of reported experimental studies which identify clusters using the intrusive probes, cluster information are obtained from the local instantaneous probe signals (Soong et al., 1993; Tuzla et al., 1998; Sharma et al., 2000; Manyele et al., 2002; Xu and Zhu, 2011, 2012). Based on a suggested criterion, a cluster would be identified if the local instantaneous solids holdup is significantly greater than the mean solids holdup. One of the major discussion on cluster identification for the following studies is concentrated on how to select the number of standard deviation of the detected solids holdup signal above local time-mean solids holdup, n. Manyele et al. (2002) proposed a sensitivity analysis to determine the value and found it was in the range of 1.0-1.4. Xu and Zhu (2011) adopted the sensitivity analysis and determined the value of n to be 2.
While it is most commonly agreed that the solids holdup of clusters is significantly greater than that of its surroundings, the criterion to separate cluster from its surroundings are still not clear and the selection of the threshold solids holdup are still more a trial and error than systematic. Therefore, a systematic method is needed to identify the clusters so as to provide more information about the cluster characteristics.
The current study aims to provide an initial attempt and also a new path to quantitatively characterize clusters from the image processing point of view so that to give some guidance in understanding the dominate effects and mechanisms which govern the cluster formation inside the CFB.
1.2 Research
Objectives
To study the microscopic flow structure inside the rectangular CFB riser via a high-speed video imaging, the major objectives of this study are listed in the following:
1) Develop a new method to correlate the grayscale (image information) with the solids holdup (flow characterization parameter). This correlation is used as the basis for the following quantitatively study.
2) Verify the feasibility and the accuracy of the newly-developed method, i.e. the image calibration method, by measuring the solids holdup. The optical fiber probe is used as a reference to compare the results with those obtained by the new method.
3) Map the radial distribution of solids holdup and the average solids holdup in the CFB riser. Use the image calibration method to visualize and quantitatively study the solids phase separation. At the same time, cluster fraction and distribution are also objectives for studying.
4) Identify the clusters from their surroundings systematically and accurately.
1.3 Thesis
structure
This thesis follows the “Integrated-Article Format” as outlined in the UWO Thesis Regulation Guide.
Chapter 1 gives a general introduction of the current research background and specific research objectives.
Chapter 2 is a detailed literature review mainly introducing basic measurements of the riser including the intrusive and non-intrusive techniques. The microscopic study in the CFB including the cluster identification, characteristics and especially the cluster studies with the visualization method are also reviewed.
Chapter 3 provides the details about the experimental apparatus including the CFB, the visualization system, the measurement techniques corresponding to different parameters and the conditions of operating and measurement in this study.
Chapter 4 introduces the newly-developed image calibration method, with which a one-to-one correspondence between the grayscale of the image and the solids holdup of the bed material, i.e. FCC particles is built for the first time. To ensure the reliability of this method, a reference plate is made to verify the light illumination consistency. The calibration experiment is conducted in a well-designed water-solid bed with the image reflections of the two medium are pre-compared. The consistency of cluster visualization and the results between this study and that of previous research proves the developed image calibration method is effective and very useful.
Chapter 6 presents the visualization of the solids phase separation and quantitative studying of the cluster distribution using the image calibration method. By transforming the original images into the HSV images, the solids holdup distributions under different operating conditions are clearly visualized. Through carefully examining the variation profiles of the relative dense phase area with different solids holdup thresholds, a critical solids holdup value of 0.04 is selected to demarcate the dilute and the cluster phases. The cluster distribution in the lateral direction of riser is also studied. It is found that the cluster fraction at the wall region is higher than that of the middle and the core regions. In addition, the cluster faction increases with the mean solids holdup of the measurement section in the riser.
Chapter 7 exhibits the further examination of the solids holdup distribution in the riser, by which the dense (or cluster) phase is regarded as the core clusters with highest solids holdup and intermediate dispersed particles, which is in the processing of coalescence or breakup. To identify the core clusters from its surroundings, a cluster threshold solids holdup is obtained by a systematic process adopting a threshold selection method. With the cluster threshold solids holdup, the cluster image can be obtained by transforming the original image into the binary image under different operating conditions. Clusters with different shapes and sizes can be visualized clearly and identified accurately.
Chapter 8 determines the cluster size by a cluster equivalent diameter calculated from the area of cluster in the binary image. At the same time, the solids holdup inside the clusters can also be determined by the grayscale of the cluster from the original image through the calibration equation. Moreover, cluster vertical velocity can be determined by the shift of clusters between sequential binary images. It is found that clusters with higher solids holdup and smaller size are prone to form at the dense operating condition (Ug = 3.0 m/s;
Gs = 100 kg/m2s), while cluster with lower solids holdup and relative larger size are
incline to form at the dilute operating condition (Ug = 9.0 m/s; Gs = 50 kg/m2s).
calibration method has great application potential. Therefore, recommendations for future work are provided as well.
References
Bai, D., Shibuya, E., Masuda, Y., Nishio, K., Nakagawa, N., Kato, K., 1995. Distinction between upward and downword flows in circulating fluidized beds. Powder Technology 84, 75-81.
Brereton, C. M. H., Grace, J. R., 1993. Microstructural aspects of the behaviour of circulating fluidized beds. Chemical Engineering Science 49, 2565-2572.
Burkhardt, H., Bredebusch, A., 1996. Application of digital image processing methods for the analysis of local structures in fluidized bed processes. In: Werther, J., Ma ̈rkl, H. (Eds.), In-Situ Measuring Techniques and Dynamic Modeling for Multiphase Flow Systems, SFB 238 Progress Report 1997–1999, Verlag des SFB 238, Hamburg. pp. 87-105.
Casleton, D. K., Shadle, L. J., Ross, A. A., 2010. Measuring the voidage of a CFB through image analysis. Powder Technology 203, 12-22.
Cocco, R., Shaffer, F., Hays, R., Karri, S. B. R., Knowlton, T., 2010. Particle clusters in and above fluidized beds. Powder Technology 203, 3-11.
Grace, J. R., Tuot, J., 1979. A theory for cluster formation in vertically conveyed suspensions of intermediate density. Transactions on Industrial and Chemical Engineering 57, 49-54.
Horio, M., Ishii, H., Nishimuro, M., 1992. On the nature of turbulent and fast fluidized beds, Powder Technology 70, 229-236.
Kuroki, H., Horio, M., 1993. The flow structure of a three-dimensional circulating fluidized bed observed by the laser sheet technique. In: Avidan, A. A. (Ed.), Circulating Fluidized Bed Technology IV, Engineering Foundation, New York. pp. 77–84.
Lackermeier, U., Rudnick, C., Werther, J., 2001. A. Bredebusch, H. Burkhart, Visualisation of flow structures inside a circulating fluidized bed by means of laser sheet and image processing. Powder Technology 114, 71– 83.
Li, H., Xia, Y., Tung, Y., Kwauk, M., 1991. Micro-visualization of clusters in a fast fluidized bed. Powder Technology 66, 231-235.
Li, H., Zhu, Q., Liu, H., Zhou. Y., 1995. The cluster size distribution and motion behavior in a fast fluidized bed. Powder Technology 84, 241-246.
Lim, K. S., Zhou, J., Finlay, C., Grace, J. R., Lim, C. J., Brereton, C. M. H., 1996. Cluster descending velocity at the wall of circulating fluidised bed risers. In: Kwauk, M., Li, J. (Eds.), Circulating Fluidized Bed Technology V, Science Press, Beijing. pp. 218–223.
Manyele, S. V., Pärssinen, J. H., Zhu, J. X., 2002. Characterizing particle aggregates in a high-densityand high-flux CFB riser, Chemical Engineering Journal 88, 151-161.
McMillan, J., Shaffer, F., Gopalan, B., Chew, J. W., Hrenya, C., Hays, R., Karri, S. B. R., Cocco, R., 2013. Particle cluster dynamics during fluidization. Chemical Engineering Science 100, 39-51.
Mondal, D. N., Kallio, S., Saxen, H., 2013. Analysis of length scales of solids volume fraction variations in a circulating fluidized bed of Geldart B particles. In: ECI Symposium Seriers (Eds), The 14th International Conference on Fluidization-From Fundamentals to Products, The Netherland. http://dc.engconfintl.org/fluidization_xiv/35
Rhodes, M. J., 1989. The upward flow of gas/solid suspension, part. 2: a practical quantitative flow regime diagram for the upward flow of gas/solid suspension, Chemical Engineering Research and Design 67, 30-37.
Rhodes, M., Mineo, H., Hirama, T., 1992. Particle motion at the wall of a circulating fluidized bed. Powder Technology 70, 207-214.
Shaffer, F., Gopalan, B., Breault, R. W., Cocco, R., Karri, S. B. R., Hays, R., Knowlton, T., 2013. High speed imaging of particle flow fields in CFB risers. Powder Technology 242, 86-99.
Sharma, A. K., Tuzla, K., Matsen, J., Chen, J. C., 2000. Parametric effects of particle size and gas velocity on cluster characteristics in fast fluidized beds. Powder Technology 111, 114-122.
Shi, H., Wang, Q., Xu, L., Luo, Z., Cen, K., 2008. Visualization of clusters in a circulating fluidized bed by means of particle-imaging velocimetry (PIV) technique. In: Werther, J., Nowak, W., Wirth, K. E., Hartge, E. U. (Eds), Proceedings of the 9th International Conference on Circulating Fluidized Beds. Hamburg, Germany. pp. 1013-1019.
Soong, C. H., Tuzla, K. Chen, J. C., 1993. Identification of particle clusters in circulating fluidized bed. In: Avidan, A. A. (Ed.), Circulating fluidized bed technology IV, Engineering Foundation, New York. pp. 615-620.
Soong, C. H., Tuzla, K. Chen, J. C., 1995. Experimental determination of clusters size and velocity in circulating fluidized beds. In: Large, J. F., Laguerie, C. (Eds.), Fluidization VIII, Engineering Foundation, New York. pp. 219-227.
Takeuchi, H., Pyatenko, A. T., Tatano, H., 1996. Flowing behavior of particles in the riser of a circulating fluidized bed. In: Kwauk, M., Li, J. (Eds.), Circulating Fluidized Bed Technology, Science Press, Beijing. pp. 164-169.
Takeuchi, H., Pyatenko, A. T., Hatano, H., 1998. Gross behaviour of parabolic strands in a riser. In: Fan, L. S. Knowlton, T. M. (Eds.), Proceedings of the 9th Engineering Foundation Conference on Fluidization, Durango, CO, Engineering Foundation, New York. pp. 173–180.
Tuzla, K., Sharma, A. K., Chen, J. C., Schiewe, T., Wirth, K. E., Molerus, O., 1998. Transient dynamics of solid concentration in downer fluidized bed. Powder Technology 100, 166-172.
Xu, J., Zhu, J. X., 2010. Experimental study on solids concentration distribution in a two-dimensional circulating fluidized bed. Chemical Engineering Science 65, 5447-5454.
Xu, J., Zhu, J. X., 2011. Visualization of particle aggregation and effects of particle properties on cluster characteristics in a CFB riser. Chemical Engineering Journal 168, 376-389.
Xu, J., Zhu, J. X., 2012. A New Method for the Determination of Cluster Velocity and Size in a Circulating Fluidized Bed. Industrial and Engineering Chemistry Research 51, 2143-2151.
Yerushalmi, J., Squires, A. M., 1975. Phenomenon of fast fluidization. AIChE Symposium Series 73, 44-50.
Zhou, J., Grace, J. R., Qin, S., Brereton, C. M. H., Lim, C. J. and Zhu, J. X., 1994b. Voidage profiles in a circulating fluidized bed of square cross-section. Chemical Engineering Science 49, 3217-3226.
Chapter 2
2
Literature Review
Based on the hydrodynamic studies inside the circulating fluidized bed, previous research about non-intrusive visualization measurements, flow structure and solids distribution inside the bed, the existence of cluster and cluster characteristics are reviewed in this chapter.
2.1 Introduction
Circulating fluidized bed (often abbreviated as CFB) technologies have achieved many successful commercial industrial applications such as coal combustion and gasification, fluid catalysis crackers and gasification of biomass over the past decades, due to typical advantages such as improved gas-solid contacting, easier to have continuous process and reduced axial gas dispersion, etc. The characteristics of the gas-solid flow in circulating fluidized beds, nevertheless, are not yet well understood due to the complexity of the axial and radial variations in particle velocity and solids holdup caused by the formation of clusters, which increases the difficulties for the study and quantitative characterization of the multiphase system.
In CFBs, it has been observed that the gas-solid flow exhibits a core-annulus structure which is characterized by a rapidly rising dilute core and a denser falling annulus. Many research works reported that particles grouped together at the annulus region near the wall, and also identified the particle clustering at the core region. The particle groups have been described by many terms such as “dense packets”, “streamers” and “strands” (sometimes interchangeable). As there has been few common understandings on the definition and classification of clusters so far, to avoid confusion, the ‘clusters’ is adopted in this study as a generalized conception, which refers to all forms of particle agglomeration.
has identified that particles tend to aggregate together and form clusters, which flow quite differently from the single particles (Li Y. and Kwauk M. 1980; Bi H. T. et al. 1993). A number of researchers have corroborated the clustering phenomenon with experimental evidences. Grace and Tuot (1979) proposed that particles form clusters as a result of flow instability. Geldart and Rhodes (1986), on the other hand, believed that the high slip velocity in a fast fluidized bed could be explained simply on the basis of radial non-uniformity in all flowing gas-solid systems. The formation of clusters has been suggested as one of the key contributing factors for the high average slip velocities.
Clusters play a major role in predicting radial and axial gas-solid flow patterns and mixing phenomena due to its effects on the key operation characteristics such as solids hold-up, pressure drop, heat and mass transfer, reaction kinetics, and axial gas and solids mixing. Researchers who incorporated the concept of clusters into hydrodynamic models of fast fluidized bed led to improved predictions of experimental behavior (Fligner et al, 1994; Xu and Li, 1998). Clusters have also been successfully incorporated into riser solids residence time distribution models (Wei et al., 1996). Knowledge of cluster behavior at both core and annulus regions are critical for designing and operating the circulating fluidized bed combustion equipment and also important for predicting and eliminating erosion in industrial units. Lints and Glicksman (1993) have illustrated that even small protrusions into the annular flow region of a riser can have a dramatic effect on wall erosion.
distributions, the continuous formation and dissipation of clusters, and the solid down-flows (Almuttahar and Taghipour, 2008).
Based on what has been mentioned above, it is now widely accepted that cluster is a special existing form of aggregated particles, whose solids holdups is significantly higher and whose hydrodynamic behaviors is quite different from single particles. The methods and techniques that are used to study the flow structure and clusters inside the CFB will be introduced next.
2.2 Measurement
techniques
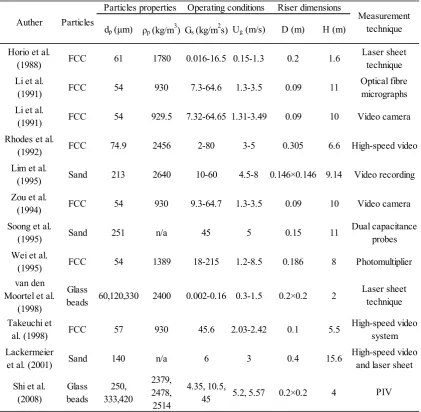
Generally speaking, published experimental measurement techniques used to study the characteristics and structure of clusters in gas-solid systems can be divided into two categories: intrusive probes (Horio et al., 1992; Manyele et al., 2002) and non-intrusive visualization methods (Rhodes et al., 1992; Shi et al., 2008) (as well as “inside bed imaging” systems such as a high-speed video camera attached to a bore-scope (Takeuchi et al., 1991; 1996; 1998) and a video camera connected to a optic fiber micrograph probe (Li et al., 1991; Zou et al., 1994)). The former is advantageous for using in dense regions and determining local flow properties such as solids holdup and particle velocity. The latter, however, is preferable due to their little disturbance to the flow.
2.2.1 Intrusive
measurement
technique
Intrusive measurement techniques including capacitance probe, sampling probe and optical fiber probe are effectively used for obtaining solids holdup and particle velocity. As the optical fiber probe is commonly applied, more emphasis will be put on describing the optical fiber probe, while the other two methods will be introduced briefly.
Capacitance probe
the fluid and the solids respectively, and the solids volume concentration (Weisendorf and Werther, 2000). The capacitive probe is effective to measure the instantaneous solids holdup and particle velocity. It is simple and effective to measure the local flow properties. However, its measuring volume is hard to define. Moreover, it is sensitive to the humidity, temperature, electrostatics and the interference of the electromagnetic field, which limits its measurement.
Sampling probe
The sampling probes includes isokinetic and non-isokinetic probes. The isokinetic sampling probe is restricted to apply in the flow system in absence of significant velocity gradients (Rhodes and Laussmann, 1992). The unsteady flow systems are adverse conditions for its application due to the intense turbulence flow in the denser region and discontinuous solids distribution. Non-isokinetic sampling probe has been successfully used for determination of solid flux to understand and explain the complex flow behaviour in CFBs (Rhodes, 1990, Rhodes and Laussmann, 1992). It collects an unbiased amount of sample particles in a specified time from which solid flux can easily be calculated and can be used to very dilute, homogeneous suspensions of fine particles.
Optical fiber probe
The multi-fibers reflective-type optical probe is used very often. Its principle to measure the solids holdup is that the intensity of the light reflected by a small volume of particles in front of the probe tip is proportional to the solids holdup within that volume. The light reflected by the moving particles are magnified by a photo-multiplier and then converted into voltage signals. Since it is proved that the relationship between the voltage signals and the solids concentration in the measurement volume is nonlinear, a reliable calibration becomes a key factor which ensures the accuracy of the measurement (Qi et al., 2008).
Particle velocity can also be measured by the optical fiber probe through the equation of
/ , where Le is the effective distance between the two bundles of fibers, and
TAB is the particle transit time between fiber bundle A and B. TAB is obtained from the
time lag at which the cross-correlation function,Φ lim
→
reaches a maximum (Horio et al., 1988, Hartge, 1988). With precise calibration and cross-correlation applied between the bundles of optical fibers, solids concentration and particle velocity are obtained. Details of the calibration process and calculation of velocity are specifically introduced in previous literatures (Zhang et al., 1998, Liu et al., 2003a; 2003b).
However, with a complicated calibration procedure, deficiencies such as the measuring volume at the probe tip decreases as the solids holdup increases (Reh and Li, 1990; Liu et al., 2003a) and the unquantified amount of disturbance from the probe to the flow (Zhang et al, 1998), can cause measurement inaccuracies in the use of the probe techniques (Chen and Fan, 1992), even though the interference is small in comparison to the other intrusive methods available for local properties measurements (Cocco et al., 1995).
2.2.2 Non-intrusive
measurement techniques
Laser Doppler Anemometer (LDA)
Laser Doppler Anemometer (LDA), also known as laser Doppler velocimetry (LDV), is a typical non-intrusive solids velocity measurement technique. The basis of this technique is that the frequency of light scattered by a moving solid is subject to a Doppler shift and the solid velocity can be determined by measuring the shift. This method is able to accurately measure gas/solids velocities in gas-solid suspensions (Yianeskis, 1987). However, particles in the laser beam directly in front of the measurement volume may influence the accuracy of the determined particle velocity. Moreover, in higher concentrated fluid-solid flows, the more difficult for the laser light to pass the opaque particles layers on its way from the probe to the particles and back (Werther et al., 1996).
Particle Imaging Velocimetry (PIV)
PIV techniques are used to measure gas-solid flow characteristics and obtain instantaneous information of a multiphase system in CFB. Typical PIV apparatus consists of a camera (normally a digital CCD camera), a high power laser, an optical arrangement to limit the physical region illuminated (normally a cylindrical lens), a synchronizer to act as an external trigger for control of the camera and laser, the particles and the fluid under investigation. A fiber optic cable or liquid light guide often connects the laser to the lens setup. The common data analysis technique for a photographically recorded particle image is the beam readout technique. By taking the pictures of illuminated particles, the flow track of the particles is reconstructed. Based on this, the velocities of the activated particles are calculated. Cluster sizes and velocity distributions in dilute fluidized bed are also determined from the video image analysis. However, when the high density wall layer is formed, the diffusion of the laser light results in difficult measurements inside the CFB columns. In other words, the PIV technique is effectively used under conditions of low solids concentration, but is less effective in denser regions.
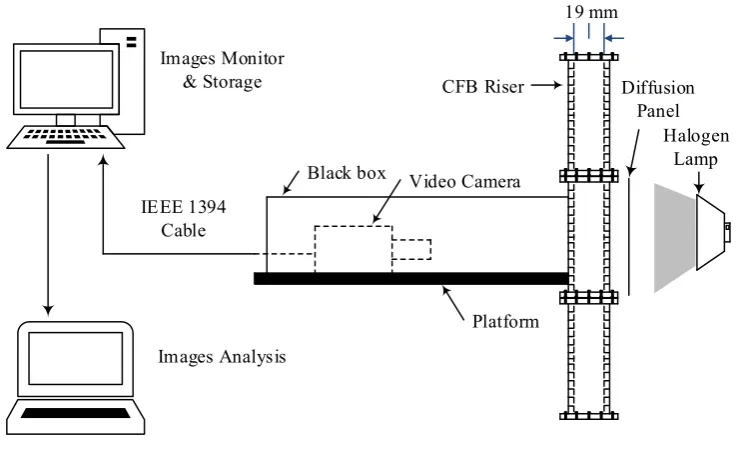
Visualization system
However, with the development and improvement of modern video cameras and application of imaging process and analysis methods, those limitations are in the process of being overcome with more and more quantitative details stressed, such as solids holdup measurement, cluster size and velocity determination and the cluster formation mechanism (Lackermeier, et al., 2001; Cocco et al., 2010; Casleton et al., 2010; Xu and Zhu, 2012; Shaffer et al., 2013; McMillan et al., 2013).
Basically, the visualization system consists of the light source, video camera recording and image processing. Although different video cameras and settings and equipment designs may vary with different researchers, what is common for the study of visualization systems is that information are obtained from processing and analyzing the image, which makes the knowledge of image processing a requirement.
It is worthwhile to note that the choice of the ordinary light source makes the application of rectangular CFB necessary. Caicedo et al. (2003) conducted a study on the behaviour of bubbles in a 2D gas-solid fluidized bed using digital image analysis with a strobe light used as the light source. Goldschmidt et al. (2003) also studied the bed expansion and segregation dynamics in a 2-D dense gas-fluidized bed by using digital image analysis. Continuous high intensity uniform illumination of the bed was obtained with six 500W halogen lamps. It seems that applying the image analysis in the 2-D fluidized bed systems is an effective and direct way to identify the hydrodynamics of the flow (Caicedo et al., 2003; Goldschmidt et al., 2003; Shen et al., 2004; Bokkers et al., 2004; Cheng et al., 2005; Wang et al., 2006; Lim et al., 2007).
In addition, studies including some “inside bed imaging” systems such as a high-speed video camera attached with a bore scope (Takeuchi et al., 1991, 1996, 1998) and a video camera connected with an optic fiber micrograph probe (Li et al., 1991; Zou et al., 1994) are also classified as non-intrusive techniques in the present study.
2.3 Microscopic studies in the CFB
fuel combustion and gasification. However, due to the formation of the clusters, the gas-solid two phase flow structure is more complicated and far from well understood. Therefore, the cluster studies are paid more and more attention.
Table 2.1 Clusters studies using different measurement techniques
n/a: data not given in the paper.
2.3.1
Micro-flow structure inside CFB
In CFBs, particles are often found to exist in aggregated forms with relatively high solids holdup compare to the mean solids holdup in the riser. This phenomenon is reported by
dp (μm) ρp (kg/m3) Gs (kg/m2s) Ug (m/s) D (m) H (m)
Horio et al.
(1988) FCC 61 1780 0.016-16.5 0.15-1.3 0.2 1.6
Li et al.
(1991) FCC 54 930 7.3-64.6 1.3-3.5 0.09 11
Li et al.
(1991) FCC 54 929.5 7.32-64.65 1.31-3.49 0.09 10
Rhodes et al.
(1992) FCC 74.9 2456 2-80 3-5 0.305 6.6
Lim et al.
(1995) Sand 213 2640 10-60 4.5-8 0.146×0.146 9.14
Zou et al.
(1994) FCC 54 930 9.3-64.7 1.3-3.5 0.09 10
Soong et al.
(1995) Sand 251 n/a 45 5 0.15 11
Wei et al.
(1995) FCC 54 1389 18-215 1.2-8.5 0.186 8
van den Moortel et al.
(1998)
Glass
beads 60,120,330 2400 0.002-0.16 0.3-1.5 0.2×0.2 2
Takeuchi et
al. (1998) FCC 57 930 45.6 2.03-2.42 0.1 5.5
Lackermeier
et al. (2001) Sand 140 n/a 6 3 0.4 15.6
Shi et al. (2008) Glass beads 250, 333,420 2379, 2478, 2514 4.35, 10.5,
45 5.2, 5.57 0.2×0.2 4
High-speed video and laser sheet
PIV Particles Video camera Dual capacitance probes Photomultiplier Laser sheet technique High-speed video system Laser sheet technique Optical fibre micrographs Video camera High-speed video Video recording Auther
Particles properties Operating conditions Riser dimensions
many earlier researchers (Yerushalmi and Squires, 1975; Li and Kwauk, 1980). Later on, the existence of aggregated forms (i.e. clusters) was confirmed in many published studies using a wide range of experimental techniques, including optical fiber probes, laser sheet techniques, capacitance probes and video camera, see Table 2.1.
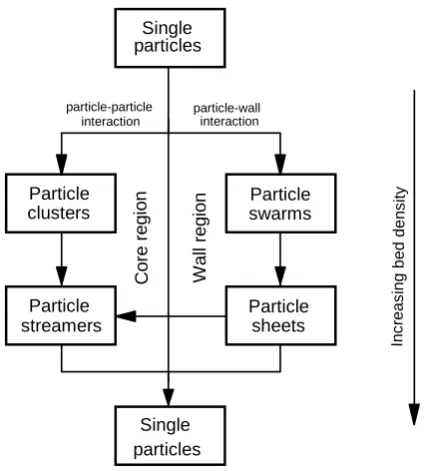
Figure 2.1 Illustration of proposed particle aggregation processes (Bi et al., 1993)
Many terms have been used to describe the particle groups or the ‘dense clouds’ of particles with far more particles per unit volume than the surrounding dilute regions in the riser such as “agglomerates”, “clusters”, “streamers”, “strands”, “ribbons”, “swarms”, “dense packets”. There were also some discussions about these terms. Yerushalmi et al. (1976) used “streamers”, “strands”, “ribbons” and “dense packets” interchangeably, while Horio and Clift (1992) suggested that there are differences between agglomerates and clusters in fluidized systems, i.e. an agglomerate consists of a group of particles held together by inherent inter-particle forces (Van der Waals forces, liquid bridge forces, electrostatic forces, etc.), while a cluster is a group of particles held together as a result of external imposed effects (most commonly hydrodynamic). Zethraeus and Ljungdahl (1993) defined clusters as a set of particles close to each other that move with a similar overall slip velocity because of their momentum interchange. Bi et al (1993) suggested that particle clusters refer to a group of several to several dozens of particles aggregated
together in the riser in order to reduce the effective drag force exerted on them. They also identified four possible forms which are summarized in Table 2.2. A possible particle aggregation process proposed by Bi et al. (1993) is shown in Figure 2.1. Helland (2007) suggested that a cluster is a group of particles held together as a result of hydrodynamic effects. Based on the assumption that two antagonistic drag effects co-exist on an individual particle depending on the inter-particle distance within a cluster, they investigate a model approach accounting for two different classes of clusters: dilute and dense. As mentioned at the beginning of this chapter (Section 2.1), since there still has been few common understandings on the definition and classification of clusters so far, to avoid confusion, the “clusters” are adopted in this study as a generalized conception, which refers to all forms of particle agglomeration.
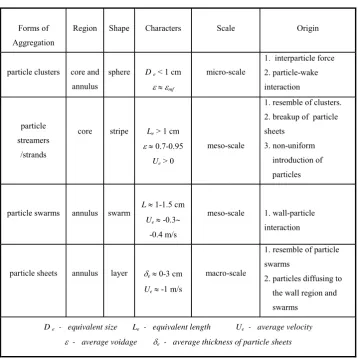
Table 2.2 Summary of solids aggregation forms in CFBs (Bi et al., 1993)
Forms of Aggregation
Region Shape Characters Scale Origin
particle clusters core and annulus
sphere D e < 1 cm
mf
micro-scale
1. interparticle force 2. particle-wake interaction
particle streamers
/strands
core stripe Le > 1 cm
0.7-0.95
Ue > 0
meso-scale
1. resemble of clusters. 2. breakup of particle sheets
3. non-uniform introduction of particles
particle swarms annulus swarm L 1-1.5 cm
Ue -0.3 -0.4 m/s
meso-scale 1. wall-particle interaction
particle sheets annulus layer e 0-3 cm
Ue -1 m/s
macro-scale
1. resemble of particle swarms
2. particles diffusing to the wall region and swarms
D e - equivalent size Le - equivalent length Ue - average velocity
Numerous descriptions of the observed clusters were presented by many published papers. Li et al. (1991) reported that clusters have rather irregular shapes and highly variable sizes by using a video camera provided with a special optic fiber micro-graph probe. Clusters were observed to transform from strands at the center of the bed into near-spheres adjacent to the wall, see Figure 2.2. Furthermore, by applying multiple laser sheets technology, Horio and Kuroki (Horio and Kuroki, 1994) observed that the typical shape of a cluster is a parabola or a horseshoe shape heading downward enclosing a gas wake in the upper side (Figure 2.3). From a cluster, particles were shed to the dilute phase continuously from the periphery and absorbed again by other clusters.
Figure 2.2 Photographs of clusters of FCC particles in the riser (Li et al., 1991)
range 0.5-2 m/s. Clusters at the wall of a riser have been observed to form, descend, break-up, travel laterally from the annulus to the core and then be re-entrained in the upward flowing core. Kuroki and Horio (1994) contributed to the internal solids mixing process within a riser. Clusters have been observed in both dilute and dense phase flow regimes. Xu and Zhu (2011) clearly observed clusters in annulus (Figure 2.4) and core region (Figure 2.5) by using the high speed video camera in a narrow rectangular circulating fluidized bed riser, which indicates that the low particle density and small particle size contribute to the cluster formation. In the downer, the existence of solid clustering phenomena is also observed by means of the micro-video action shot which confirms that the configurations of clusters are anomalous and often in the form of floc and stick structures (Lu et al., 2005), as is shown in Figure 2.6.
(a) Vertical cross section (b) Horizontal cross section
(c) Three dimensional visualization
Figure 2.4 Clusters at the annulus region (Xu and Zhu, 2010)
Figure 2.6 Images of clusters in the downer (Lu et al., 2005)
2.3.2 Cluster
identification
From the reported studies so far, both intrusive probes and visualization methods can be used to identify clusters. The intrusive probes are one-point measurement methods, which can provide information at various time scales but limited spatial variation. The visualization methods, on the other hand, can practically provide information at any point within the measurement zone. The specialties of the two kinds of methods leads to their own criterion to identify the clusters.
range of 1.0-1.4. Xu and Zhu (2011) adopted the sensitivity analysis and determined the value to be 2.
Comparing to intrusive probes, a particular advantage of the image processing method is the exact geometrical determination of the measuring area which is needed for the calculation of velocities and sizes of clusters. However, there are less studies for cluster identification with visualization methods. Burkhardt and Bredebusch (1996) and Lackermeier et al. (2001) calculated a threshold to identify clusters from the histograms of gray values for each pixel of obtained images over time. Based on the comparable relationship between grayscale and solids holdup, they set the threshold to the gray value which leads to the same value of the cluster volume (or area) fraction as was obtained from corresponding fiber optical measurements. Xu and Zhu (2012) also applied image processing to characterize the cluster size and velocity. The threshold is set to the mean gray value of the whole image. Mondal et al. (2013) used the similar criterion as that of Soong et al. (1995) to choose a threshold grayscale to convert the original image into a binary image so that the clusters are separated from their surroundings. The grayscale value of the clusters (δ ) is higher than the local average grayscale ( ̅ ), i.e. δ ̅
, where is the standard deviation of the local grayscale intensity. By visual inspection and the comparison to the original image, the k value was chosen as 1.
While it is all agreed that the solids holdup of clusters is significantly greater than that of its surroundings, the criteria to separate a cluster from its surroundings is still not clear and the selection of the threshold solids holdup are still more a trial and error than systematic. Therefore, more studies on the systematical cluster identification methods are required.
2.3.3 Cluster
characteristics
Cluster mean solids holdup
When the average solids holdup in clusters is measured by optic fiber probe or capacitance probe, researchers often take the number averaged solids holdup in clusters. Time integration of instantaneous solids holdup from starting to ending time of cluster occurrence gives the time-average solids holdup for a particular cluster. A number average of such solids holdups over the number of clusters, n, gives:
̅ ∑ (2.1)
An equation (Eq. 2.2) based on other researchers’ experimental data was derived by Harris et al. (2002) summarizing the correlation between solids concentration of cluster and the mean solid concentration of bed section ( ) in the riser. The correlation coefficient (R2) of the equation is 0.90, which showed a good validity.
̅ .. . . (2.2)
Sharma et al (2000) found that the average solids holdup in clusters decreased significantly with increase in gas velocity (Figure 2.7) and the average solid holdup in the cluster phase could reach as high as 0.12, almost three times that of the corresponding bed. Figure 2.8 shows the radial profiles of the average solids concentration inside clusters at different operating conditions in the developed flow section (Z = 6.34 m). Manyele et al (2002) found clearly that higher ̅ leads to higher ̅ , and vice versa. Therefore, higher Gs leads to higher ̅ . The low-flux condition (Ug = 8.0 m/s and Gs =
100 kg/m2s) leads to lower solids concentration inside the clusters.
Figure 2.8 Radial profiles of the mean solids holdup inside cluster at different operating conditions (Manyele et al., 2002)
Cluster size
Figure 2.9 Example of the signal from the optic fiber probe (Li et al., 1995)
Wei et al. (1995) discovered that, increasing superficial gas velocity and/or decreasing solids circulation rate can reduce the cluster size. The captured cluster signals by optical fiber probe are shown in Figure 2.9 (Li et al., 1995). The vertical ordinate represents the reflected light intensity and the horizontal one represents time. Clusters passed the two probe tips with certain time interval and there was a time lag, t, between the two signals curves associated with one cluster, which is known by comparing the time of corresponding peaks, valleys, or some characteristic points. Then cluster velocity Vc is
calculated from:
/ (2.3)
The corresponding cluster vertical length iscalculated from:
(2.4)
Their study shows that the mean cluster vertical length in lower dense section is larger than that in the upper dilute section, which may be caused by the gas entrainment and gravity segregation.
Cluster size is expressed as a function of voidage or solid holdup by Zou et al (1994) through Eq. 2.5:
/ 1.853 . . . 1 (2.5)
Subbarao (2010) developed an equation to estimate the size of clusters considering ‘volume ratio of cluster to void to be equal to the volumetric fraction ratio of cluster to void in the bed’, i.e.:
(2.6)
where Dcl is diameter of cluster, Dv is diameter of void, δc is cluster fraction.
Recognizing that cluster size is larger than the size of particles and all the particles move in clusters formation with a voidage of εc in high velocity fluidization regimes, the cluster
size is obtained from:
/
1 (2.7)
where ut, usr, ε, εc and Dp are terminal velocity of a single particle, slug rise velocity, bed
voidage, cluster voidage and diameter of particle, respectively.
Slug rise velocity usr depends on column diameter as:
0.35 / (2.8)
With the development of the image processing, the cluster size is obtained from the processed image. Lackermeier et al. (2001) measured the cluster vertical length by transforming the original image into the binary image with the size of image known.
Cluster velocity
Many researchers have reported that lies within the range 0.5-2 m/s irrespective of the experimental conditions. Based on an emulsion layer model, neglecting inertia effects and assuming viscous flow with appropriate boundary conditions, an expression for the mean flow velocity of the annular film was given as (Mahalingam and Kolar, 1991):
(2.9)
is the wall film bulk density, δfilm is the wall film thickness and μfilm is the viscosity
of the wall film emulsion.
Lim et al. (1996) predicted the falling velocities of a single cluster using a force balance:
(2.10)
1 (2.11)
0.5 1 1.34 1.3 1 ̅ . 1 ̅ . ( 0.80 ̅ 0.9985) (2.12)
(2.13)
(2.14)
; 1 (2.15)
1 (2.16)
where, Fd is the drag force; Fm is the momentum exchange force between cluster and the
surroundings; Fw is the force on the cluster due to wall friction; Fb is the buoyancy force
thickness; ρp is the particle density; εcl is the internal voidage of the cluster; ̅ is the mean
voidage across the column; CD is the effective drag coefficient; ρg is the gas density; urel
is the relative velocity between clusters and surrounding gas; Gh is the lateral solids flux
from adjacent dilute phase to cluster; Vcl is the velocity of descent of cluster; Vp is the
vertical component of velocity of solids entering clusters; τw shear stress; kw constant; εa
is mean voidage in the annulus.
Pandey et al. (2004) reported that downward velocity of cluster is in the range of 0.8-1.4 m/s and the downward cluster velocities are independent of the operating conditions in a pilot scale circulating fluidized bed.
Based on the cross-correlation technique, Lackermeier et al. (2001) achieved a vector of displacement for a sequence of frames. As it is possible to calculate a value which is connected to the probability of the existence of a cluster in the images, it is possible to connect these sequences. The velocities of clusters are calculated according to their profiles. The cluster velocity in the horizontal direction is not considered due to its small value.