Pan Sharpening using modified SparseFI
Algorithm
Nandana U. S.1, Deepa P. L.2
PG Student [Signal Processing], Dept. of ECE, Mar Baselios College of Engineering and Technology, Thiruvananthapuram, Kerala, India 1
Assistant Professor, Dept. of ECE, Mar Baselios College of Engineering and Technology, Thiruvananthapuram, Kerala, India2
ABSTRACT: Recently sparse image fusion algorithm (SparseFI) has been developed to solve the pan-sharpening problem which exploits the sparse representation and reconstruction of image patches. Even though it has promising results, the correlation of information between adjacent spectral channels was not addressed. Later, this problem has been solved in Joint Sparse image fusion algorithm (J-SparseFI) and the results were better than that of SparseFI method. But the problem in selection of patch size is not considered in any of these algorithms and they are using uniform patch size throughout. So we propose a modified SparseFI algorithm which employs non-uniform patch size selection to improve the quality of pan-sharpened image. The proposed method has promising and superior results than SparseFI algorithm.
KEYWORDS:Pan-sharpening, Non-uniform patch size, Image fusion, SparseFI, Quality criterions.
I.INTRODUCTION
The earth observation satellite like IKONOS, Quick Bird, GeoEye and WorldView 2 produce panchromatic (PAN) as well as multispectral (MS) images. These satellites are composed of multispectral channels of lower spatial resolution (LR) ranges from 2 m to 4 m and panchromatic channel of high spatial resolution (HR) ranges from 0.5 m to 1 m. So the PAN image has high spatial resolution but low spectral resolution. When we consider a MS image, it has greater spectral resolution but less spatial resolution. But there are applications such asmap updating, hazardmonitoring, land-use classification and change detection which require accurate geometrical analysis as well as clear spectral information. Since an image which has both high spectral and spatial resolution is not available, there is a need to combine HR PAN image and LR MS image to generate a HR MS image. This is called pan-sharpening. It is a multiresolution image fusion [1] [2]. The name pan-sharpening is come from the term ‘panchromatic-sharpening’, which is the sharpening of MS image using PAN image. There are so many pan-sharpening methods and the most common and conventional methods are intensity hue saturation (IHS) method [3], principal component analysis (PCA) method [4] and discrete wavelet transform (DWT) [4] method. These methods have good results, but when analysing detailed spectral and spatial quality, the performance is not so much satisfactory. This is because of the trade-off between spatial and spectral resolution. If one method produce great spectral quality, there may be some spatial distortion and vice versa. The comparative study of these conventional methods is done in different ways and can be observed in [6] [7] [8] [9]. From the literature survey we can understand that IHS and PCA method suffer from spectral distortion but have good spatial quality. The results of DWT method have satisfactory spectral resolution but the presence of stair casing effect cause artefacts in edges lead to spatial distortion. Then the progresses in pan-sharpening techniques lead to the development of techniques such as adaptive IHS (AIHS), Fast IHS (FIHS) which are the extended versions of IHS methods and are described in [10]. Similarly various pan-sharpening methods are developed such as variational wavelet pan-sharpening (VWP) method, panchromatic + multispectral image fusion (P + XS) [11] etc.
the input images are divided into image patches and finally after processing they are combined. The important fact to be noticed is that, they are using uniform patch size to tile the images. Since the size of patch and quality of image are related, we propose a new pan-sharpening method which makes use of non-uniform patch size selection in SparseFI algorithm whose performance is better than normal SparseFI method.
II.SPARSEFI ALGORITHM
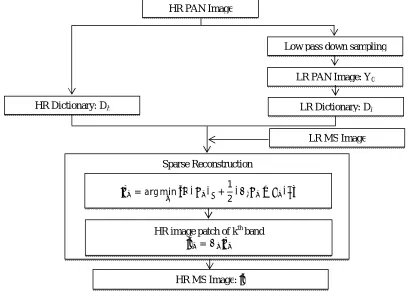
SparseFI algorithm is the simplified name of sparse image fusion algorithm. Compressive sensing theory is the basis of this pan-sharpening method. In this method, the pan-sharpening problem is solved byutilizing the sparse signal representation and reconstruction of image patches. The advantage of SparseFI algorithm over conventional methods is the ability of this method to adapt itself to the input images. The flow chart of SparseFI algorithm is shown in Fig.2.1.There are three main steps in this method. They are dictionary learning, sparse coefficients estimation, and HR MS image reconstruction.
Fig. 2.1 Flow chart of SparseFI Algorithm
Dictionary Learning
In this step, a LR and HR dictionaries are formed from the HR and the LR version of the panchromatic image.For that, initially HR PAN image X0is down sampled to get the LR PAN imageY0. The down sampling factor FDS is chosen in
such a way that the dimension of LR MS imageY and LR PAN image are same.The input image is low pass filtered before down sampling to avoid aliasing. This filtering and down sampling are the preliminary processes. Then both HR PAN and LR PAN images are tiled into image patches called ‘atoms’ such that the total number of LR PAN image y0patches and HR PAN patches x0are the same. So thesizeof HR PAN image patch must be the FDS times the size of LR
PAN image patch. Uniform patch size applied for entire image. For simplicity only non-overlapping patches are considered. If we select overlapping patches, some additional parameters which represent the percentage of overlapping are to be considered. All the LR patchesy0 with pixel values arranged in column vectors form the matrix Dl called the
LR dictionary. Similarly using HR patchesx0, HR dictionary (Dh) is created. Also the LR MS image Y is tiled into small
HR PAN Image
Low pass down sampling
LR PAN Image: Y0
LR Dictionary: Dl
HR Dictionary: Dh
LR MS Image Sparse Reconstruction
= arg min ‖ ‖ +1
2‖ − ‖
=
HR image patch of kth band
patches yk, where k denote the kthspectral channel and k =1,… N. N is the number of spectral channels in the MS
image.
Sparse coefficients estimation
In this step, each LR multispectral patch in the kth channel ykis represented as a linear combination of LR pan
patchesy0. That means, to represent the pixel values of ykas the atoms of dictionary Dlmultiplied with a coefficient
vectorα . Here the unknown α is to be estimated. Since the number of equations is less than the number of unknowns, there may be infinite number of solutions. So the solution which uses minimum number of PAN image patches is considered to be the best solution and we use L1-L2 minimization shown in equation (1) to obtain the coefficientα for each LR MS patch yk. Where, λ is the standard Lagrangian multiplier which balances the sparsity of the solution and
the fidelity of the approximation.
= arg min ‖ ‖ + ‖ − ‖
(1)
To solve the above equation, in [12], the optimization algorithm called SL1MMER algorithm [14] [15] is used. Here another optimization algorithm called NNQPActiveSet [16] is used. It is comparatively fast and produces optimum results. If we select overlapping patches, then we use equation (2).
.
= arg min ‖ ‖ + − (2)
Where = and = (3)
Matrix P is a matrix which extracts the region of overlap between the current target patch and previously reconstructed patch. The pixel values of the previously reconstructed HR MS image patch on the overlap region is represented in wk.
Parameter β is a weighting factor that gives a trade-off between goodness of fit of the LR input and the consistency of
reconstructed adjacent HR patches in the overlapping area. Here β= 1 .
HR MS image reconstruction
Finally the pan-sharpened multispectral image patches are reconstructed from the estimated coefficients and the HR dictionary.Since HR image patches xkand corresponding LR image patch ykshare the same sparse coefficients, i.e., the
coefficients of xk in Dh are identical to the coefficients of yk in Dl, the final pan-sharpened HR MS image patches is
obtained from equation (4).All the reconstructed HR MS image patches are joined together to form the kthspectral band of HR MS image . Finally the pan-sharpened HR MS image is obtained by combining all the spectral bands.
= D
(4)
III.PROPOSED METHOD
Fig. 3.1 Flow Chart of Proposed Method
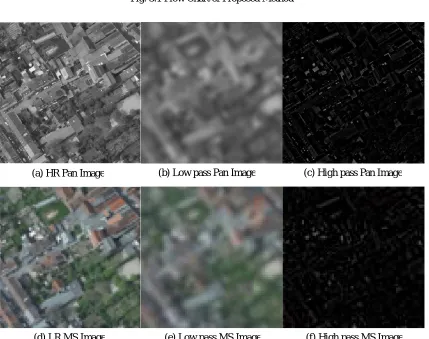
Fig. 3.2 Input and filtered Images
(a) HR Pan Image (b) Low pass Pan Image (c) High pass Pan Image
(d) LR MS Image (e) Low pass MS Image (f) High pass MS Image SparseFI Method with Small Patch
Size
Pan-Sharpened Low pass HR MS image
Low pass Filter High pass Filter
Low pass PAN Image
Low pass MS Image
High pass PAN Image
High pass MS Image Input Images
SparseFI Method with Large Patch Size
Pan-Sharpened High pass HR MS image
The distribution of spatial and spatial information in low and high frequency components can be obtained from fig. 3.1 where the input and filtered images are shown.Onanalysing the filtered images fig. 3.1(b), (c) with HR PAN image represented in fig 3.1(a) we can see that spatial information is concentrated in high frequency components. Similarly in fig. 3.1(e) most of the spectral information in fig. 3.1(d) is concentrated.So by considering the fact which is identified in the first part of this section, small patch is used for low frequency components and large patch is used for high frequency components. After SparseFI algorithm is applied, we get low and high frequency components of pan-sharpened images. In last step, both components are combined to get the final pan-pan-sharpened image.
IV.RESULT AND DISCUSSION
This section consists of two parts. The first part deals with the relation between the quality of the image and patch size is examined. In the second part, the comparison of proposed method and normal SparseFI method is done. In order to identify therelation between image quality and patch size, pan-sharpening is done using SparseFI method with different patch size. In order to compare the pan-sharpened results, an original HR MS image is needed. So for the performance evaluation only, we will select MS and PAN image with same resolution and then down sample the MS image to get the LR MS image. Then sharpening is done with the selected HR PAN image and LR MS image. Finally the pan-sharpened image is compared with the initially selected original HR MS image. In fig.4.1 the original MS image and pan-sharpened images are shown.
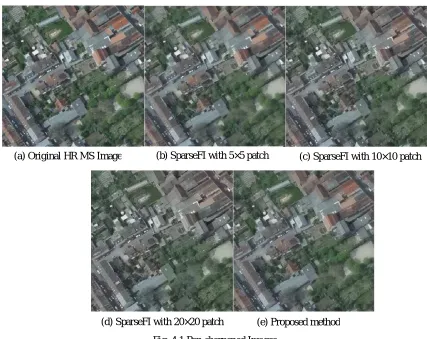
Fig. 4.1 Pan-sharpened Images
Fig. 4.1 (a) represents the original HR MS image. When we analyse the pan-sharpened image with 5×5 patch size, which is represented in fig. 4.1 (b) with original image, it is clear that there is not so much colour distortion. The spectral information is almost preserved. But this image suffers from spatial distortion. When the patch size is increased, the spatial quality is improved. But spectral distortion occurs. This is observed from fig. 4.1 (c) with 10×10 patch size and fig. 4.1 (d) with 20×20 patch size. On visual analysis, in normal SparseFI method, optimum patch size is
(a) Original HR MS Image (b) SparseFI with 5×5 patch (c) SparseFI with 10×10 patch
10×10. The result of proposed method is shown in fig. 4.1 (e) and it shows high visual quality compared to normal SparseFI results. In order to prove the superior quality of the pan-sharpened image, quality metrics [17] are analysed.
Table 4.1 Quality metric analysis
In table 4.1, five different quality analysis criterions are used which are explained in the appendix section. The second row represents the optimum values. The method which has quality metric values more close to the optimum value is the best method. In this table, the normal SparseFI method with20×20 Patch Sizemodified SparseFI with various patch sizes are compared. It can see that the values changes when the patch size is varied. When the patch size for low frequency region become smaller and the patch size for high frequency become larger, the quality is improved. So here, the proposed method with small patch size 2×2 and large patch size 20×20 has quality criterion values more close to the optimum values which are represented in bold numerical has best performance.
V. CONCLUTION
In this paper a new pan-sharpening method which employs a non-uniform patch size selection is proposed. This modified version of SparseFI method uses small patch size for low frequency components as it contains more spectral information and large patch size for high frequency components since it contains major spatial information. SparseFI algorithm with NNQPActiveSet optimization is applied to low frequency and high frequency components individually. The quality of proposed method is compared with normal SparseFI method visually as well as using quality criterions and the superior performance of the proposed method is proved. Also the overall computational speed is not affected since the low computational speed of small patch size section is compensated by the fast computational speed of large patch size section. In this paper patch size is selected manually. So in future this method can be extended by adaptively selecting the patch size according to the image.
APPENDIX
RMSE:
The Root mean square error (RMSE) is frequently used to compare the difference between the original and pan-sharpened images by directly calculating the changes in pixel values. It is given by
Methods RMSE Degree of
Distortion SAM ERGAS
Correlation Coefficient
Optimum values 0 0 0 0 1
SparseFI
(Patch Size 10×10) 13.1271 8.9146 0.1233 2.6018 0.9273
SparseFI
(Patch Size 20×20) 13.7390 9.4237 0.1290 2.7264 0.9203
Modified SparseFI
(Patch Size 4×4 & 10×10) 12.6337 8.5738 0.1186 2.5167 0.9338
Modified SparseFI
(Patch Size 2×2 & 10×10) 12.5933 8.5226 0.1181 2.5139 0.9340
Modified SparseFI
(Patch Size 4×4 & 20×20) 12.5713 8.4937 0.1180 2.5050 0.9344
Modified SparseFI
RMSE= MN1 ∑ ∑ Xi,j−Xi,j 2 N
j=1 M i=1
, Is the pixel value of the original image, and , is the pixel value of the pan-sharpened image.M and N are the HR
image sizes. The pan-sharpened image is closer to the original image when RMSE is smaller.
SAM:
Spectral angle mapper (SAM) denotes the absolute value of the angle between the true and estimated spectral vectors.
, , , =
〈 , , , 〉 ‖ , ‖ .‖ , ‖
A value of SAM equal to zero denotes absence of spectral distortion, but radiometric distortion is possible (the two pixel vectors are parallel but have different lengths). SAM is measured in either degrees or radians and is usually averaged over the whole image to yield a global measurement of spectral distortion.
Degree of Distortion (D):
The degree of distortion directly reflects the level of distortion of pan sharpened image. It is defined as
= 1 , − ,
When the value of D is small, the distortion of the pan-sharpened image is small..
ERGAS:
The error relative dimensionless global error in synthesis (ERGAS) reflects the overall quality of the pan sharpened image. It represents the differencebetween the pan-sharpened and original images and is defined as
= 100ℎ 1
Where, h/l is the ratio between pixel sizes of the panchromatic and original multispectral images, and RMSEk and are
the RMSE and mean values of the kth band, respectively. A small values for ERGAS meanssmall spectral distortion so that the algorithm has high preservation of spectral information.
REFERENCES
[1] Jan Flusser, Filip Sroubek, and Barbara Zitova, “Image Fusion: Principles, Methods, and Applications”, Tutorial EUSIPCO 2007
[2] Dr. T. Stathaki, “Study of two new spatial domain image fusion methods”, Imperial college of science, technology and medicine, University of London, Department of electrical and electronics engineering, Sept.2007
[3] M. Moeller, T. Wittman, A. Bertozzi, and M. Burger, “A variational approach for sharpening high dimensional images,” Ph.D. dissertation,Inst. Computational & Applied Math., Westfalische Wilhelms UniversitatMunster, Münster, Germany, 2009. [4] Deepak Kumar Sahu and M. P. Parsai, “Different Image Fusion Techniques –A Critical Review”, International Journal of
Modern Engineering Research (IJMER), Vol. 2, Issue 5, pp. 4298-4301, Sep.-Oct. 2012.
[5] Shutao Li, James T. Kwok and Yaonan Wang, “Using the discrete wavelet frame transform to merge Landsat TM and SPOT panchromatic images”, Information Fusion, volume 3, Issue 1,pp. 17–23, March 2002.
[6] Konstantinos G. Nikolakopoulos, “Comparison of Nine Fusion Techniques for Very High Resolution Data”, Photogrammetric Engineering & Remote Sensing Vol. 74, No. 5, pp. 647–659, May 2008.
[7] Melissa Strait, Sheida Rahmani and Daria Markurjev, “Evaluation of Pan-Sharpening Methods”, UCLA Department of Mathematics August 2008.
[8] Pat S Chavez, Stuart C. Sides and Jeffrey A. Anderson, “Comparison of three different methods to merge multiresolution and multispectral data: Landsat TM and Spot panchromatic”, Photogrammetric Engineering and Remote sensing, 1991
[10] Donamol Joseph, and T. Jemima Jebaseeli, “A Survey Of Fusion Of Remote Sensing Images To Avoid Spectral Distortion”, International Journal of Engineering Research & Technology (IJERT), Vol. 1 Issue 8, October 2012.
[11] Coloma Ballester, Vicent Caselles, Laura Igual and Joan Verdera, “A Variational Model for P+XS Image Fusion”, International Journal of Computer Vision, volume 69, Issue 2,pp. 43–58, 2006
[12] Xiao Xiang Zhu, Member, and Richard Bamler, “A Sparse Image Fusion Algorithm with Application to Pan-Sharpening” IEEE transactions on geoscience and remote sensing, vol. 51, Issue 5, pp. 2827-2836, May 2013
[13] Xiao Xiang Zhu, Sofya Spiridonova and Richard Bamler, “A Pan-sharpening Algorithm Based on Joint Sparsity”, IEEE Advances in Radar and Remote Sensing (TyWRRS), pp. 177-184, Sept. 2012
[14] X. Zhu and R. Bamler, “Tomographic SAR inversion by L1 norm regularization-The compressive sensing approach”, IEEE Trans. Geosci. Remote Sens., vol. 48, Issue. 10, pp. 3839–3846, Oct. 2010.
[15] X. Zhu and R. Bamler, “Super-resolution power and robustness of compressive sensing for spectral estimation with application to space borne tomographic SAR”, IEEE Trans. Geosci. Remote Sens., vol. 50, Issue 1, pp. 247–258, Jan. 2012. [16] Yifeng Li and Alioune Ngom, "Sparse representation approaches for the classification of high-dimensional biological data”,
IEEE International Conference on Bioinformatics and Biomedicine 2012: Systems Biology