ISSN 2286-4822
www.euacademic.org DRJI Value: 5.9 (B+)
Technical Review and Analysis on Students
Academic Website Projects Using
GTmetrix
Web
Speed and Optimization Tool
FLORETO B. QUINITO, JR. JULIETO P. CATIPAY Information Technology Department Mindanao University of Science and Technology – Jasaan Campus Jasaan, Misamis Oriental, Philippines
Abstract:
Three local government website projects in the province of Misamis Oriental deployed by the Bachelor of Science in Information Technology students of Mindanao University of Science and Technology-Jasaan Campus were subjected for review using the GTmetrix web speed optimization tool. The purpose of this study was to evaluate the general performance of the websites in terms of access speed and page efficiency by determining whether the design of the websites follow the global best practices of web page optimization. It aims to identify specific aspects of the websites that need major improvements and how it can be improved. The study uses data collection from the result of individual website review. Statistical mean was used to compute the general performance score based from the individual aspect-grades of each website. The study found out that the websites are unoptimized based on the predefined speed category and GTmetrix PageSpeed set rules.
INTRODUCTION
Internet has become the backbone of every field. Over the last years, web development is affecting the society from all aspects i.e. business environment, educational field, communicating ways between people. (Naazir, et. al, 2013). Websites have become an important channel for organizations to make transaction and provide service to customers. In recent years, the applications of information technology have provided an even more powerful platform for new website applications (Chen, 2009). Web pages must be fast and effective. To estimate serviceability, the features of web pages must be measurable (Lamichhane & Meesad, 2011). Since web pages are one of the most significant components of e-government strategy, evaluation itself is a wide concept. It depends on multiple qualitative and quantitative factors (Rogers, et.al, 2007). The quantitative factors such as download delay, errors in pages, broken links, and server response time and so on can be measured by web diagnostic tools (Jati & Dominic, 2010). There are various web diagnostic tools available in the internet today like Pingdom, WebPageTest, Sucuri Load Time Tester, Google PageSpeed Insights, PageScoring, and GTmetrix. These web diagnostic tools help the web developer analyse the performance of their web pages and also help them how to optimize their codes and web elements for better performance. In the setting of this study the GTmetrix was used. GTmetrix
evaluates page performance based on key indicators of page load speed. It uses both the Google PageSpeed and Yahoo!
YSlow. It provides track performance with monitoring, graphs and alerts. It provides visual performance graphs like Page Load Time, Page Size and Request Counts. It displays the
Three websites were deployed by the Bachelor of Science in Information Technology (BSIT) students of Mindanao University of Science and Technology – Jasaan Campus, (MUST-Jasaan) in three different local government agencies in the province of Misamis Oriental. The jasaan.gov.ph was used as the official website of the Municipality of Jasaan. The
balingasag.net for the Municipality of Balingasag and the
pnpmisorppo.org was used as the official website for the
Philippine National Police – Misamis Oriental Police Provincial Office (PNP-MOPPO). The general objective of this study is to review the general performance of the websites based on
GTmetrix’s set rules. This study is to determine whether the websites are optimized and fast enough when they are accessed. Specific objectives includes the identification of the website elements that are considered unoptimized, very unoptimized or
extremelyunoptimized based on grade category. Findings of this study will be useful in the improvement of future website projects in the academe in terms of efficiency and optimization. This will also align the academic website projects according to the global best practices and standards.
LITERATURE
becoming increasingly apparent that the performance of their websites in terms of the extent to which they can attract and retain traffic, strongly influences the volume of business transacted on them (Tarafdar & Zhang, 2008). It is important for organizations to identify factors that influence website performance for appropriately focusing website development efforts towards specific parameters and including relevant performance-influencing features within the website. Analysis of website performance in terms of design criterion and related factors is therefore an important area of enquiry (Torkzadeh & Dhillon, 2002). Technical properties of the websites include security, access speed and accessibility. Access speed determines how fast the website can deliver and display web pages (Rose, et. Al, 1999).
from better user engagement, higher conversion rates and higher Search Engine Optimization (SEO) rankings.
Web analytics refers to a combination of measuring, acquisition, analysing and reporting of data collected from the Internet with the aim of understanding and optimizing web experience. (Web Analytics Association, 2008). Web analytic tools automatically calculate statistics about the detail use of site. The method studies the web as whole by calculating statistics about the detail use of the site and providing Web- traffic data, visibility, connectivity, ranking and overall impact of a site on the Web (Mvungi & Tossy, 2015). Website analysis is an ongoing process (Kaur & Singh, 2015). Web analysis perform several inspections on the websites and software and use usability criteria to determine some faults on the systems (Mvungi & Tossy, 2015). The analysis is required during the development of a website to cognize about its potential users so that layout design and content can be placed on the web accordingly. Also, once the website is developed, the analysis process does not end there but it continues for further maintenance and optimization (Kaur & Singh, 2015).
Despa (2014) employed GTmetrix to evaluate the NUVE
applications. In formalizing the ISDF Software Development Methodology for the ALPHA project, Despa (2015) also employed the GTmetrix to collect data regarding quality. Same tool was also used by AbanteCart latest version 1.2.7 to evaluate its speed. The Progressive Digital Media Technology News (2015) reported that shoppers from UK see website speeds and functionality equally important than design and style. The Retail Speed League created by Citrix utilized
METHODS
Three academic website projects were selected to undergo
review and analysis using GTmetrix: jasaan.gov.ph,
balingasag.net and the pnpmisorppo.org websites. The Uniform Resource Locator (URL) of each project was keyed in the
GTmetrix web page whose server is located at Vancouver, Canada. The GTmetrix tool meticulously scanned the contents of the website and analysed the performance based on its test speed criteria. After each evaluation, GTmetrix then displayed the overall score based on the Google PageSpeed and Yahoo!
YSlow set rules. It also shows the specific criterion-based grade and recommendations based from both PageSpeed and YSlow
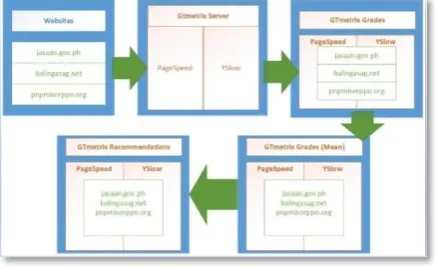
tests. The lowest possible grade is zero (0) and the highest possible is one hundred (100). Page and content speed category is grounded to the following grade range: very optimimized (85-100), optimized (71-84), unoptimized (56-70), very-unoptimized (30-55) and extremely unoptimized (0-29). Figure 1 shows the technical review and analysis process of this study.
Figure 1. Technical Review and Analysis Process
GTmetrix result displays the overall score for both the
shows the portion of the sample screenshot of the GTmetrix PageSpeed test result for the balingasag.net website.
Figure 2. Screenshot portion of PageSpeed test result for balingasag.net
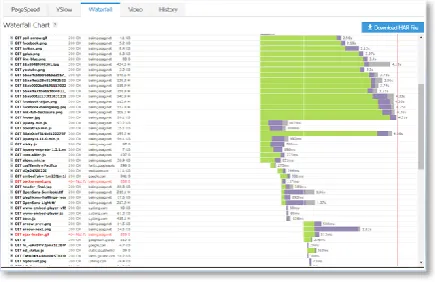
The display of exact time each of the website component can be seen in the waterfall display. Figure 3 shows the portion of the
GTmetrix result through the waterfall display.
Figure 3. Screenshot portion of GTmetrix waterfall test result for balingasag.net
The statistical mean was calculated for both PageSpeed and
determine the aspects of the projects that needs major
improvements. Recommendations provided by the GTmetrix
based on the scores are listed down.
RESULTS
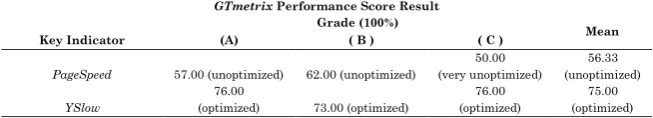
The technical review and evaluation of the websites using
GTmetrix shows that jasaan.gov.ph got a PageSpeed score of 57.00 (unoptimized), balingasag.net scored 62.00 (unoptimized)
and pnpmisorppo.org scored 50.00 (very unoptimized). Their
PageSpeed mean is 56.33 which is categorized as unoptimized . On the other hand, the three websites got higher scores in the
YSlow test. jasaan.gov.ph scored of 76.00 (optimized),
balingasag.net scored 73.00 (optimized) and pnpmisorpo.org
scored 76.00 (optimized). Their YSlow mean is 75.00 which gave the impression that the overall website performance is
optimized
Table 1. Summary of GTmetrix Performance Score Result
GTmetrix Performance Score Result
Key Indicator
Grade (100%)
Mean
(A) ( B ) ( C )
PageSpeed 57.00 (unoptimized) 62.00 (unoptimized)
50.00 (very unoptimized)
56.33 (unoptimized)
YSlow
76.00
(optimized) 73.00 (optimized)
76.00 (optimized)
75.00 (optimized) ( A )- jasaan.gov.ph ( B ) - balingasag.net ( C )- pnpmisorppo.org
Going into the details of the GTmetrix PageSpeed evaluation the result shows that various aspects of the websites were rated as extremely unoptimized. Top on the list is the specification of image dimension (mean = 4.67). The websites’ images have no width or height attributes. Leverage browsing caching (mean = 12.33). The cacheable resources have a short freshness lifetime. The resources expiration were not set. Served scale images (mean = 12.33). Many of the content images were not properly resized that could have saved 85% of image size. Among the
42.00). The resources were not compressed with gzip which could reduce their transfer size by 69% and Defer parsing of Javascript (mean = 52.33) in which a considerable amount of
Javascript is parsed during initial load.
The unoptimized aspects includes Minify CSS (mean = 60.00) and Specify a Vary: Accept-Encoding header (mean = 68.33). Many Cascading Style Sheet (CSS) files were not minified which could save many bytes of data and speed up downloading, parsing and executing time. Various resources that are publicly cacheable and compressible do not have “Vary: Accept-Encoding” header. The absence of these header unable to instruct the proxy server to store both a compressed and uncompressed version of the resource.
Aspects that were considered optimized comprises
Optimize images (mean = 72.33). Some content images were not appropriately sized which could be reduced by 12%. Minify HTML (mean = 74). Some HTML codes were not compacted or minified which can saved many bytes of data and speed up downloading, parsing and execution. Avoid CSS @import (mean = 75.33). There are CSS external stylesheet that were included which uses @import. This external stylesheet can add additional delays during the loading of the webpage. Avoid a character set in a meta tag (mean = 85). Specifying a character set in a meta tag disables the lookahead downloader in IE8. The rest of the aspects got above 85 grade so they were categorized as very fast. Table 2 shows the summary of the GTmetrix PageSpeed result with the corresponding criterion-based mean.
Table 2. Summary of GTmetrix PageSpeed Result
GTmetrixPageSpeed Evaluation Result
Aspects
Grade (100%) Mean
Remarks ( A ) ( B ) ( C )
Specify image dimension 14 0 0 4.67
Extremely Unoptimized Leverage browsing caching 3 29 5 12.33
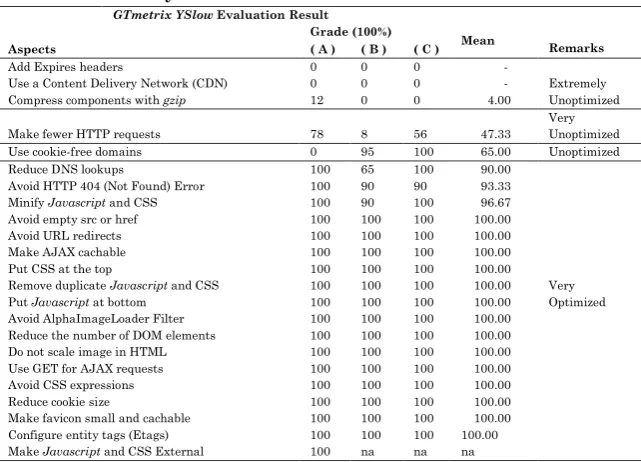
Furthermore, the evaluation of GTmetrix using YSlow shows almost similar result. The extremely unoptimized aspects includes Add Expires header (mean = 0.00). Static components of the websites have no far-future expiration date. Expires headers let the browser know whether to serve a cache version of the page. This criteria is similar to the Leverage browsing caching in the PageSpeed test. Use a Content Delivery Network (CDN) (mean = 0.00). The websites did not use a CDN which supposedly can give an equally fast web experience across the globe. Compress components with gzip (mean = 4.00). Many of the plain text components were not compressed using gzip
during data transfer. This criterion is similar with the Enable gzip compression in the PageSpeed test.
Make fewer HTTP request (mean = 47.33) which is similar to the Defer parsing of Javascript and Minify CSS in the PageSpeed test found to be very unoptimized. An impression that there were multiple external Javascript scripts and multiple external CSS stylesheets that were not combined into one. There was only one unoptimized aspect found in this test, the Use of cookie-free domains (mean = 65.00). This means
Defer parsing of Javascript 72 0 85 52.33 Very Unoptimized Minify CSS 38 95 47 60.00
Unoptimized Specify a Vary: Accept-Encoding header 70 75 60 68.33
Optimize images 78 87 52 72.33
Optimized Minify HTML 80 84 58 74.00
Avoid CSS @import 85 85 56 75.33 Avoid a character set in a meta tag 85 85 85 85.00
Very Optimized Avoid bad requests 100 88 72 86.67
that there are website components which are not cookie-free. Web cookies cause unnecessary web traffic. The rest of the website aspects got a grade above 85 and they were categorized as very optimized. Table 3 below shows the summary of the
GTmetrixYSlow result.
Table 3. Summary of GTmetrix YSlow Result
GTmetrixYSlow Evaluation Result
Aspects
Grade (100%)
Mean Remarks ( A ) ( B ) ( C )
Add Expires headers 0 0 0 -
Extremely Unoptimized Use a Content Delivery Network (CDN) 0 0 0 -
Compress components with gzip 12 0 0 4.00
Make fewer HTTP requests 78 8 56 47.33 Very Unoptimized Use cookie-free domains 0 95 100 65.00 Unoptimized Reduce DNS lookups 100 65 100 90.00
Very Optimized Avoid HTTP 404 (Not Found) Error 100 90 90 93.33
Minify Javascript and CSS 100 90 100 96.67 Avoid empty src or href 100 100 100 100.00 Avoid URL redirects 100 100 100 100.00 Make AJAX cachable 100 100 100 100.00 Put CSS at the top 100 100 100 100.00 Remove duplicate Javascript and CSS 100 100 100 100.00 Put Javascript at bottom 100 100 100 100.00 Avoid AlphaImageLoader Filter 100 100 100 100.00 Reduce the number of DOM elements 100 100 100 100.00 Do not scale image in HTML 100 100 100 100.00 Use GET for AJAX requests 100 100 100 100.00 Avoid CSS expressions 100 100 100 100.00 Reduce cookie size 100 100 100 100.00 Make favicon small and cachable 100 100 100 100.00 Configure entity tags (Etags) 100 100 100 100.00 Make Javascript and CSS External 100 na na na (A)- jasaan.gov.ph ( B) - balingasag.net ( C )- pnpmisorppo.org
CONCLUSION AND RECOMMENDATIONS
improvement. It is highly recommended that the websites need to specify the widths and heights for all images which allows faster rendering of web page images through the elimination of unnecessary reflows and repaints. Expires headers must be used in the web pages in order to let the web browsers know whether to serve a cache version of the page. The use of Content Delivery Network (CDN) matters a lot to deliver a faster web experience across the internetwork. Reduce the load times of pages by storing commonly used files from the website to the visitor’s browser. The compression of resources using gzip
which reduce the size of files sent from the server increases the speed to which the web files are transferred to the user’s browser must be a priority. Parsing of the Javascripts must be deferred. The browser must parse the contents of all <script> tags in order to minimize the amount of Javascript needed to render the page. Multiple external CSS files should be
combined and compacted into one to minimize HTTP requests.
Specifying a Vary: Accept-Encoding header which instructs the proxy to store both a compressed and uncompressed version of the resource also help improve the load speed of the page. Using a cookie-free domains prevents unnecessary data traffic in the web.
The use of web diagnostic tools for web speed test like
REFERENCES
1. Brits tell online retailers to stick to the basics
(2015). Progressive Digital Media Technology
News Retrieved from
http://search.proquest.com/docview/1695976758?accounti d=141440
2. Chen, T. F., 2009, "Building a platform of business model 2.0 to creating real business value with Web 2.0 and accelerate the growth of highly value-added web information services industry," International Journal of Electronic Business Management, Vol. 7, No. 3, pp. 168-180.
3. Despa, M.L (2014). Quality Assurance in Innovative Software Development Projects. Paper presented at the 10th International Scientific Conference eLearning and
Software for Education. Retrieved from
http://search.proquest.com/central/docview/1534145229/f ulltext/49986A6D63B74618PQ/2?accountid=141440
4. Despa, M. L. (2015). Formalizing the ISDF Software
Development Methodology. Informatica
Economica, 19(2), 66-80. Retrieved from
http://search.proquest.com/docview/1696718046?accounti d=141440
5. Ivory, M.Y. & Hearst, M.A. (2001). 'The State of the Art in Automating Usability Evaluation of User Interfaces' in: ACM Computing Surveys, Vol. 33, Issue 4, pp. 470-516.
7. Kaur, K., & Singh, H. (2015). Analysis of website using click analytics. International Journal of Science, Engineering and Computer Technology, 5(6), 185-189.
Retrieved from
http://search.proquest.com/docview/1793585876?accounti d=141440
8. Krug, S. (2006). Don't Make Me Think: A Common Sense
Approach to Web Usability, 2nd Edition, Berkeley, 30-32.
9. Lamichhane, R., & Meesad, P. A Usability Evaluation for Government Websites of Nepal Using Fuzzy AHP. 10.Mentes, S. A., & Turan, A. H. (2012). Assessing the
Usability of University Websites: An Empirical Study on Namik Kemal University. Turkish Online Journal of Educational Technology-TOJET, 11(3), 61-69.
11.Mustafa SH, Al-Zoua’bi LF. (2008). Usability of the academic websites of Jordan’s Universities: an evaluation study, in International Arab conference on information technology, Tunisia; p. 1– 9
12.Mvungi, J., & Tossy, T. (2015). Usability evaluation methods and principles for the web. International Journal of Computer Science and Information
Security,13(7), 86-92. Retrieved from
http://search.proquest.com/docview/1703538763?accounti d=141440
13.Nazir, A., Raana, A., & Javed, A. (2013). Activity based quality model for evaluating Web2.0 applications. International Journal of Modern Education and
Computer Science, 5(3), 8-17.
doi:http://dx.doi.org/10.5815/ijmecs.2013.03.02
14.New AbanteCart version promises most powerful
ecommerce platform for free. (2016). M2
http://search.proquest.com/docview/1791229202?accounti d=141440
15.PR Newswire (2015). CDNetworks recommends 5
website speed test tools for optimizing web performance.
(2015, Feb 18). PR Newswire Retrieved from
http://search.proquest.com/docview/1655754637?accounti d=33262
16.Rose, G., Khoo, H., & Straub, D (1999). Current Technological Impediments to business-to-consumer electronic commerce. Communications of the AIS 1 (16) pp. 1-74
17.Tarafdar, M., & Zhang, J. (2008). Determinants of Reach and Loyalty - A Study of Website Performance and Implications for Website Design. The Journal of Computer Information Systems, 48(2), 16-24. Retrieved from
http://search.proquest.com/docview/232573825?accountid =141440
18.Torkzadeh, G. & Dhillon, G. (2002). Factors that
influence the Success of Internet Commerce,
Information Systems Research, 13 (2), pp. 187-204
19.Web Analytics Association (2008). Web analytics
definitions – draft for public comment.
http://www.digitalanalyticsassociation.org/Files/PDF_sta
ndards/WebAnalytic sDefinitions.pdf [Accessed on 10