rK
F.N-'\ L\TT A" IrN7\~TT')7"'l
I
POBOx 43844 00100 j!NAIROBI KENYA,
i
By
?
5 JUL 2014
R.F1.CEI'lF:n
. OPJ-,D9p·Tr~
~:crI0('L ROPKOI JOEL K. (B. Ed Sc.REG NO I56/CE/11164/2006
A THESIS SUBMITTED IN PARTIAL FULFILLMENT OF THE
REQIDREMENTS FOR THE AWARD OF THE DEGREE OF MASTER OF
SCIENCE IN THE SCHOOL OF PURE AND APPLIED SCIENCES OF
KENY ATTA.UNIVERSITY
DECLARATION
Ihereby declare that this is my original work and has not been presented for the award of a degree inany other university.
Signed ~ Date
~.;?.-:.~.
']
~.
~.?.!
.Lj
.
Ropkoi Joel K. Kenyatta University
This thesis has been submitted with our approval as University supervisors.
Signed
~
Date
2,4-.\.\.)::r.j2:D.l~
.
Dr. Ruth N. Wanjau Department of Chemistry Kenyatta University
signed
k
.
l
r
t1~
:
Date.;
iIf
.
/~7/d
.
C
!
(1
:
.
Prof. Jane I. MurungiY
DEDICATION
ACKNOWLEDGEMENT
I wish to express my sincere thanks to my supervisors, Dr. Ruth Wanjau and Prof Jane Murungi for their guidance and encouragement throughout the period of my study, which have brought this thesis into areality.
I am grateful to Kenyatta University, the Department of Chemistry for the support of my study. Thanks to the technical staff of Department of Chemistry led by the chief technician, Mr Elius Maina. Much thanks go to the management and staff of the Department of Geology and Mines, Ministry of Environment and Natural Resources, for allowing me to use their atomic absorption spectroscopy instrument (AAS).
I sincerely thank my colleagues Tonui Mathew and geno Kipyegon for encouragement and support that they gave me during my research period. Thanks also to other colleages who supported me in one way or another.
TABLE OF CONTENTS
DECLARATION ii
DEDICATION iii
ACKNOWLEDGEMENT iv
TABLE OF CONTENTS v
LIST OF TABLES vii
LIST OF FIGURES ix
ABBREVIATIONS AND ACRONYMS x
ABSTRACT xi
CHAPTER ONE 1
1 INTRODUCTION 1
1.1 Background 1
·1.2 Statement ofthe problem andjustification 3
1.3 Hypothesis 4
1.4 Objectives 5
1.4.1 General objective 5
1.4.2 Specific objectives 5
1.5 Significance of the study 5
1.6 Scope and limitations 6
CHAPTER TWO 7
2 LITERATURE REVIEW 7
2.1 Nutrition 7
2.2 Infant food formulations 7
2.3 Essential elements 8
2.3.1 Iron 10
2.3.2 Zinc 11
2.3.3 Manganese 13
2.3.4 Copper 13
2.3.5 Potassium 14
2.3.6 Calcium 15
2.3.7 Magnesium 16
2.3.8 Chromium 17
2.4 Analytical techniques 17
2.4.1 Flame Atomic absorption spectroscopy (FAAS) 18
CHAPTER THREE 22
3 MATERIALS AND METHODS 22
3.1 Research design 22
3.2 Cleaning of glassware and preparation of standard solulions 22
3.3 Instrumentation and apparatus 23
3.4 Reagents: 23
3.5 Sample collection and pretreatment.. : 24
3.6 Acid digestion : 24
3.7 Method validation 25
3.8 Data analysis 26
4 RESULTS AND DISCUSSION 27
4.1 Introduction 27
4.2 Method validation 27
4.3 Linearity of FAAS calibration curves 28
4.4 Levels of essential elements in infant milk formulations for 0 - 6 months and
7- 12 months age groups 29
4.4.1 Mean levels of K in infant milk formulations for 0- 6 months and 7 - 12
months age groups 29
4.4.2 Mean levels of Mg in infant milk formulations for 0- 6 months and 7 -12
months age groups 31
4.4.3 Mean levels ofCa in infant milk formulations for 0 - 6 months and 7 -12
months age groups 32
4.4.4 Mean levels of Fe in infant milk formulations for 0 - 6 months and 7 -12
months age groups 34
4.4.5 Mean levels of Zn in infant milk formulations for 0 - 6 months and 7 -12
months age groups 36
4.4.6 Mean levels of Cu in infant milk formulations for 0- 6 months and 7 -12
months age groups 37
4.4.7 Mean levels of Mn in infant milk formulations for 0- 6 months and 7 -12
months age groups 39
4.4.8 Mean levels of Cr in infant milk formulations for 0 - 6 months and 7 -12
months age groups 40
4.5.1 Levels of essential trace elements in cereal based infant formulations 44 4.7.0 Comparison of mean levels of selected essential elements in infant milk and
cereal based formulations with RDI values 48
CHAPTER FIVE 62
5 CONLUSIONS AND RECOMMENDATIONS 62
5.1 CONCLUSIONS 62
5.2 RECOMMENDATIONS 62
5.2.1 RECOMMENDATIONS FROM THE STUDy 62
5.2.2 SUGGESTIONS FOR FURTHER STUDy 63
REFERENCES 64
APPENDICES 71
APPENDIX I: Potassium calibration curve by AAS 71
APPENDIX II: Magnesium calibration curve by AAS 71
APPENDIX III: Calcium calibration curve by AAS 72
APPENDIX IV: Iron calibration curve by AAS 72
APPENDIX V: Zinc calibration curve by AAS : 73
APPENDIX VI: Copper calibration curve by AAS 73
APPENDIX VII: Manganese calibration curve by AAS 74
LIST OF TABLES
Table 2.1 Mean concentration of essential elements in different brands of formulations
by some researchers 10
Table 2.2 Dietary reference values for zinc 12
Table 3.1 :The FAAS operating conditions 23
Table 3.2 Analyte concentrations 25
Table 4.1 Percentage recoveries of analyte sample 27
Table 4.2 Correlation coefficient (R2)values of AAS calibration curves 28 Table 4.3 Mean levels ofK (mgIlOOg) in infant milk formulations for 0-6 months
hs and 7 - 12 months age groups 29
Table 4.4: Mean levels of Mg (mgll OOg)in infant milk formulations for
a
-
6 mont.. 31hs and 7- 12 months age groups 31
Table 4.5: Mean levels of Ca (mgll OOg)in infant milk formulations for 0-6 months ..33
and 7-12 months age groups , 33
Table 4.6: Mean levels of Fe (mgIlOOg) in infant milk formulations for
a -
6 months 34and 7- 12 months age groups 34
Table 4.7: Mean levels ofZn (mgIlOOg) in infant milk formulations for
a -
6 months ..36and 7- 12 months age groups 36
Table 4.8: Mean levels of Cu (mgll OOg)in infant milk formulations for
a
-
6months .. 38and 7 - 12 months age groups 38
Table 4.9: Mean levels ofMn (mgIlOOg) in infant milk formulations for 0-6 months. 39
and 7 - 12 months age groups 40
Table 4.10: Mean levels of Cr (mgll OOg)in infant milk formulations for 0-6 months
and 7 - 12 months age groups 41
Table 4.11: Levels of major essential elements (mgll OOg)in cereal based infant
formulations for 7- 12months age group 42
Table 4.12: Levels of essential trace elements (mgll OOg)in cereal based infant
formulations for 7- 12months age group 44
Table 4.13 Comparison of mean levels of essential elements with label values
(mg/I OOg)in some milk based formulations 46
Table 4.14 Comparison of mean levels of essential elements with label values
(mgll OOg)in some cereal based formulations 47
Table 4.15: Comparison of mean levels of K (mgll OOg)in infant milk formulations
with RDI of700mg/day 48
Table 4.16: Comparison of the mean levels of K (mgll OOg)in cereal infant food
formulations for 7 - 12 months age group with RDI of 700 mglday 49 Table 4.17: Comparison of mean levels ofMg (mgIlOOg) in infant milk formulations
with RDI of 50 mg/day 50
Table 4.18: Comparison of the mean levels of Mg (mgll OOg)in cereal based infant
formulations for 7- 12 months age group with RDI of 50 mg/day 51 Table 4.19: Comparison of mean levels of Ca (mgll OOg)in infant milk formulations
with RD~ of 360 mg/day : , 52
Table 4.20: Comparison of the mean levels of Ca (mgll OOg)in cereal based infant
Table 4.21: Comparison of mean levels of Fe (mg/1 OOg)in infant milk formulations
with RDI of360 mg/day 54
Table 4.22: Comparison of the mean levels of Fe (mg/1OOg)in cereal based infant
formulations for 7- 12month age group with RDI of 10mg/day 55 Table 4.23: Comparison of mean levels of Zn (mgll OOg)in infant milk formulations
with RDI of 3mg/day 56
Table 4.24: Comparison of the mean levels of Zn (mg/1OOg)incereal based infant
formulations for 7- 12month age groupwith RDI of 3 mg/day 57 Table 4.25: Comparison of mean levels of Cu (mgll OOg)in infant milk formulations
with RDI of 0.5 mg/day 57
Table 4.26: Comparison of the mean levels of Cu (mgll OOg)incereal based infant
foodformulations for 7- 12 month age group with RDI of 0.5 mg/day 58 Table 4.27: Comparison of mean levels of Mn (mgll OOg)in infant milk formulations
with RDI of 0.5 mg/day 59
Table 4.28: The mean levels ofMn (mgll OOg)in cereal based infant food
formulations for 7- 12month age group with RDI of 0.5 mg/day 60 Table 4.29: Comparison of mean levels of Cr (ug/I OOg)in infant milk formulations
LIST OF FIGURES
Figure 2.1: Schematic diagram of an atomic absorption spectrophotometer. 19
ABBREVIATIONS AND ACRONYMS
AAS Atomic Absorption Spectrometry
ADI Accepted Daily Intake
AES Atomic Emission Spectroscopy
AIDS Acquired Immune Deficiency Syndrome
CDCP Centre for Disease Control and Prevention
FAO Food Agricultural Organization
HIV Human Immunodeficiency Virus
IF Infant Formula
RDI Recommended Daily Intake
SCF Scientific Committee on Food
SPSS Statistical Product and Service Solutions
UNICEF United Nations Children's Fund
WHO .World Health Organization
ABSTRACT
1.1 Background
There has been rapid increase in malnutrition related diseases among the Kenyan children
(Neuman, 1994). Child mortality rate has also increased (Kabi, 2004). A considerable
number of mothers may not breastfeed their young ones for various reasons. For most
.babies, breastfeeding is without question the best way to be fed, but unfortunately
breastfeeding can also transmit HIV. If no antiretroviral drugs are being taken,
breastfeeding, for two or more years can double the risk of the baby being infected to
around 40 percent (De 'Cock, 2000). Replacement feeding is the most effective way to
prevent mother-to-child transmission of HIV after birth. Many women prepare to tryout
formula food after receiving counseling on the possibilities of breast milk infecting the
infant (Chatterjee, 2003). Infant food formulations therefore playa leading role in the
provision of essential elements. A mineral rich infant food can provide a solution to
nutrition related problems among the infants.
Almost all infant food formulations are either of plant or animal origin. It consists of
carbohydrates, fats, proteins, mineral elements, vitamins and water. Mineral elements
which are needed in small quantity for the metabolism of the body consist mainly of the
macro nutrients and trace elements. Examples of macronutrients include potassium,
magnesium and calcium among others. Trace elements can be divided into three groups;
the essential trace elements (micronutrients), such as zinc, iron and copper, which are
constituents of hormones. In addition, vitamins and catalyst for the enzyme systems, the
which have no metabolic functions in the living organism. The roles of the essential trace
elements in human health and disease prevention have been documented in literature
(Garrison and Somer, 1995; WHO, 1996) and of particular interest is the role these
elements play in human nutrition and infant nutrition (Bowen, 1979). World Health
Organization report recommends exclusive breastfeeding for the first 6 months of life
(WHO, 2001). However, sometimes breastfeeding is not sufficient (Monte and Gulgilani,
2004) or if the mother is taking a particular drug that could harm the baby (CDCP, 2006),
or after six months feed, then the complementary feeding becomes necessary (Monte and
Gulgilani, 2004). Apart from breast milk, infant food formulations have special roles to
play in the diets of infants since they are a major source of nutrients (Bermejo et al.,
2000; Food and Drug Administration, 1997). Moreover, those infant food formulations
are designed to provide the required nutrients as recommended daily intake (RDI) of
minerals for infants and toddlers (WHO/UNICEF, 1998). However, reports have shown
that various nutritional inadequacies have been cited in infant food formulations (CDCP,
2007).
Baby food composition may vary according to region and economical status. Different
types of infant food formulations are available in supermarkets located in Nairobi.
Among these are 'lnfacare' and 'Gold', which are milk formulas. Cereal based
formulations include 'Purity' and 'Amaranth baby'. Others composed of both milk and
cereal are 'Cerelac' and 'Lactogen'. It has been documented that diet is the main source
of essential elements (Dim et al., 2004) and the nutritional importance of many trace
likeiron and copper are needed for production of hemoglobin, while calcium is required
for bone development. Zinc is involved in nucleic and bone metabolism. Selenium protects body tissues against oxidative stress and modulates growth and development. Manganese on the other hand is essential for several enzyme development. To maintain the physiological and metabolic processes of the body, the appropriate intakes of these
elements are required. Deprivation can lead to diseases (Oskarsson and Sandstoerm,
1995),whereas, excessive intake of some of the essential elements may adversely affect
the human biomedical function (Prasad, 1993). The importance of obtaining better
information on the trace elements levels in foods and diets and the necessity to provide
better knowledge-based sources of food has been highlighted (Stewart, 1980).
1.2 Statement of the problem and justification
No more than 35% of infants worldwide are exclusively breastfed during the first four
months of life and complementary feeding frequently begins too early and foods are often
nutritionally. inadequate and unsafe (WHO, 2003). Inadequate or incorrect nutrient and
energy intakes can directly affect infant growth and can have long-term consequences on
organ development and function, which may result in adverse health effects in later life
(SCF, 2006). Rising cases of obesity in children are also a matter of serious concern.
Adequate replacement feeding is needed for infants born to HIV-positive mothers who
choose not to breastfeed. It requires a suitable breast milk substitute, for example an
infant formula prepared in accordance with Codex Alimentarious Standards (WHO,
2002). Recent research on infant formula composition has focused mainly on protein and
essential elements present in infant food formulations have received little attention. For
example, for eight out of the eleven essential elements regulated in formula food, the data
required for a science-based risk assessment of infant exposure is currently lacking
(Codex Alimentarious Commission, 2007). A large number of Kenyan mothers who do
not breastfeed their babies for some reasons rely heavily on infant formula feeding.
However, little is known about the variation in levels of essential elements in the infant
formulas available in Kenyan county. Itwas therefore important to determine whether the
infant formula foods on sale inNairobi market are adequate in some essential elements.
Some elements may constitute-potential health risk if consumed above RDI values and
therefore information is needed on the levels of many metals and elements in the
,commercial infant formulas (WHOIUNICEF, 1998).
1.3 Hypothesis
There is no significant difference in the levels of essential elements III infant food
1.4 Objectives
1.4.1 General objective
Todetermine the levels of essential elements in selected infant food formulations.
1.4.2 Specific objectives
1. To determine the levels of Fe, Zn, Cu, Mn, Cr, K, Mg and Ca insix milk infant
food formulations for 0-6 months and 7-12 months age groups, sold inNairobi
county.
II. To determine the levels of essential elements K, Mg, Ca, Fe, Zn, Cu, Mn and Cr in
five cereal based infant food formulation brands for 7-12 months age group,
sold inNairobi county.
1.5 Significance of the study
Many infants have encountered great challenges of essential element malnutrition and
poor health. Infants require sufficient supply of essential elements for cell development,
metabolic processes and general growth. Sufficient supply of essential elements also
helps infants as immune boosters. There is now growing evidence of the importance of
essential elements in human nutrition, and there, are reports that suggest essential element
deficiencies can lead toimpaired growth during infancy (Mohan and Stump, 2000). Since
the neonatal period is one of the most critical ~ith respect to nutrition, there is need to
know the actual intake of essential elements by those feeding on infant food formulations
information on the levels of essential elements in some commercial infant food
formulations. These infant food formulations are important sources of essential elements
for they are useful as replacement foods to breast milk. The results were compared with
the documented RDI for infants in the literature. The study shed light on how best the infant foods may be used to meet the mineral nutritional needs of essential elements by infants. The results of this study can be used by policy makers to come up with policies
and guidelines on ensuring appropriate feeding of infants. The results will also be used to
sensitize the public.
1.6 Scope and limitations
The study dealt with analysis of selected essential elements namely; Fe, Zn, Cu, Mn, Cr,
K, Mg and Ca in infant food formula brands. Only eleven brands of infant food
CHAPTER TWO: LITERATURE REVIEW
2.1 Nutrition
Good nutrition is'extremely important in the management and control of diseases. There is need for proper nourishment of infants so that they are able to resist infection and malnutrition related diseases. The human body's immune system relies on a balance diet
rich in trace elements and other macro and microelements also have a role in immune system (WHO and FAO, 2002). A good diet consists of a number of nutrients, which can
bederived from a balanced diet. All nutrients are important but among the key nutrients are, carbohydrates, proteins, vitamins and minerals (Whanger, 2003).
2.2 Infant food formulations
Infant food formulation is manufactured to support adequate growth of infants under twelve months of age when fed as a sole source of nutrition. Besides breast milk, infant food formula is the only other milk substitute which the medical community considers
nutritionally' acceptable for infants under the age of one year (WHO, 2003). The composition of infant food formulation is roughly based on mother's milk approximately one to three months postpartum. The most commonly used infant food formulations
contain purified cow's milk, whey and casein as protein source, lactose as carbohydrate, vitamin-mineral mix and other ingredients depending on the manufacturer. There have been progressive attempts to bring the composition of infant formulations closer to that of
concentrating on those substances in human milk which serve other than traditional nutritional roles. Attempts are in progress to supplement infant formulas with protective and trophic factors unique only to human milk (Annemiek and Jacques, 1994). Use of infant food formulations has been cited for numerous health risks. Studies have found infants in developed countries fed on formulations are at increased risk for acute gastroenteritis, severe respiratory tract infections, type 1 and type 2 diabetes, and autism
when compared to infants who are breastfed (Riordan, 1997). This calls for continuous
analysis of infant food formulations to protect infants from the ailments.
2.3 Essential elements
Essential mineral elements are categorized into major and trace minerals, depending on the amounts needed per day. Major minerals are those that are required in the amounts of 100 mg or more, while trace minerals are required in amounts less than 50 mg per day. The terms major and trace however, do not reflect the importance of the mineral in maintaining health, as deficiency of either can be harmful. Some body processes require
several minerals to work together. For example, calcium, magnesium and phosphorous are all important for the formation and maintenance of healthy bones. Trace elements are mostly important as cofactors for enzymes. Trace elements are essential nutrients for
metabolism, growth and neurological and immunological function (Rei fen and Zlotkin, 1993; Castillo and Cassorla, 1999). Bioavailability of trace elements like iron, zinc, copper and manganese from human milk is high compared to cow's milk and infant food formulations. Trace elements play an important role as far as health is concerned. They
vitamins and'proteins (WHO, 1996b). Essential micronutrients include include, Fe, Cu,
Zn, Mn and Se which have a variety of biochemical functions in all living organisms.
This has led scientists to examine the trace element content ofhuman milk, the ideal food
during the first month of life, in order to estimate infant requirements and establish
reference values for use in manufacturing infant food formulations (Tripathi et al., 1999).
While Fe, Cu and Zn are essential, they can be toxic when taken in excess; both toxicity
and necessity vary from element to element (Tripathi et al., 1997). Several researchers
have carried out work on determination of key elements in commercially available infant
food formulations and baby foods. The values of essential elements reported by some of
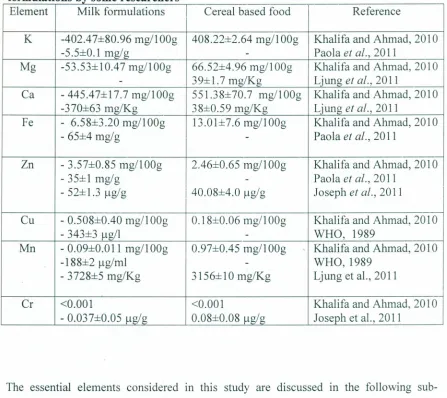
Table 2.1 Mean concentrations of essential elements in different brands of ~ormu a onslti b'Ysome researc ersh
Element Milk formulations Cereal based food Reference
K -402A7±80.96 mg/I
oo
,
408.22±2.64 mgll ~Og Khalifa and Ahmad, 2010-5.5±0.I mg/g
-
Paola et af., 2011Mg -53.53±10A7 mgllOOg 66.52±4.96 mgll OOg Khalifa and Ahmad, 2010
- 39±I.7 mg/Kg Ljung et af., 2011
Ca -445A7±I7.7 mgllOOg 551.38±70.7 mgll
oo,
Khalifa and Ahmad, 20I0-370±63 mg/Kg 38±0.59 mg/Kg Ljung et af., 2011
Fe - 6.58±3.20 mgllOOg 13.0I±7.6 mgllOOg Khalifa and Ahmad, 2010
- 65±4 mg/g
-
Paola et af., 2011Zn - 3.57±0.85 mgllOOg 2A6±0.65 mg/1~Og Khalifa and Ahmad, 2010
- 35±1 mg/g
-
Paola et af., 2011- 52±1.3 ug/g 40.08±4.0 ug/g Joseph et al., 2011
Cu - 0.508±OAO mgll ~Og 0.18±0.06 mgll ~Og Khalifa and Ahmad, 2010
-343±3 ug/l
-
WHO, 1989Mn -0.09±0.0 11mgll ~Og 0.97±OA5 mgll ~Og Khalifa and Ahmad, 2010
-188±2 ug/ml - WHO,I989
-3728±5 mg/Kg 3156±10 mg/Kg Ljung et aI., 2011
Cr <0.001 <0.001 Khalifa and Ahmad, 2010
- 0.037±0.05 ug/g 0.08±0.08 /lg/g Joseph et al., 2011
The essential elements considered in this study are discussed in the following
sub-sections.
2.3.1 Iron
Iron is one of the most essential elements for plants and animals. Iron plays a very
important role in production of hemoglobin. Decreased availability of hemoglobin in
human body leads to symptoms of anemia. Anemia has many different causes, although
absence of iron decreases heme synthesis, red blood cells in iron deficiency anemia are
hypochromic (lacking the red hemoglobin pigment). The iron in breast milk is highly
bioavailable and covers the needs for the infant until about the age of six months. The
Academy of pediatricians suggests infants should be supplemented with iron-fortified
cereals (Reifen and Zlotkin, 1993).
Iron absorption from infant food formulations is significantly lower (Fomon et al., 1993),
probably due to presence of iron in different forms. The tolerable upper intake of iron in
humans is 14 mg/l, while the recommended daily intake for infants is 10 mg (Standing
Committee, 1997). Some studies have found association between infant formulations and
lower cognitive development, including iron supplementation in baby formula being
linked to lower intelligence quotient and other neuro-developmental delays (Kerr and
Desiree, 2008). Studies have also shown that Fe deficiency in infants and older children
may be associated with irreversible behavioral abnormalities and abnormal functioning of
the brain (Nokes et al., 1998). Studies in man have confirmed that anemic individuals have greater chances of developing infectious diseases, particularly those associated with
respiratory system (Mindel and Mundis, 2004).
2.3.2 Zinc
Zinc is an important micronutrient that supports normal growth (Lynne, 2004). Taking
just a little zinc in the diet can
.
greatly reduce cases of malaria, pneumonia, diarrhoea and.
other diseases (Fox, 1998). These diseases are the major killers of children all over the
(Friel et al., 1985., Fuller, 1992). Deficiency of trace elements such as zinc and copper
can occur in infants for different reasons. It has been reported that zinc intake by infants
from breast milk is inadequate during weaning period, especially if weaning foods are
introduced at an early stage (Khanghani et al., 2009). Decrease of zinc causes growth
stoppage (Ruel et al., 1997) and its reduction damages immune system (Magnus et al.,
2004., Zhang et al., 2008). The incidence of cytomegalovirus infection is related to zinc
deficiency (Schumann et al., 2002). Some researchers recommend Zn supplementation
for infants on vagan diets during weaning (Allen, 1998), although high levels of dietary
Zn may inhibit absorption of Pb. However, Zn supplementation is not recommended for
infants with elevated blood lead levels (CDCP, 2000). The tolerable upper intake of zinc
in humans is 12 mg/l required for several enzymes such as carboxypeptidase, liver
alcohol dehydrogenase and carbonichydrase. The recommended daily intake of zinc for
infants is 3 mg (Standing Committee, 1997). Table 2.2 shows the dietary reference values
for zinc according to world health organization (WHO/F AO, 2002).
T bl 22a
e
°n°
Ietary re erence va ues orzmcIAge Zn levels (mg/day)
0-12 months 3.3-5.6
1-10 years 3.8-10
11-18 years 8.7-15
Adults 6.7-15
During pregnancy 7.3-15
During lactation 11.7-19
2.3.3 Manganese
Manganese is an essential micronutrient of several enzymes including pyruvate
carboxylate, mitochondrial superoxide dismutase and enzymatic systems of matrix
turnover in skeletal growth (Branca and Valtuena, 2001). The deficiency of manganese
has been related to bone deformation, impairment of reproductive organs and reddening
of hair amongst others, while excess manganese may inhibit iron assimilation (Solomons
et al., 1981). Previous studies indicate that diabetics invariably have low Mn levels in
blood; therefore lack of Mn in regular diets could be linked to prevalence of diabetes in
man (Williams and Caliendo, 1988). Mene Zes-Filho et al. (2009) reviewed studies on
health effects in children environmentally exposed to Mn and found that most studies
reported neuropsychological effects, such as poorer cognitive outcome and hyperactivity
with elevated postnatal exposure. Exposure sources ranged from industrial pollution and
mine waste to drinking water and food including infant food formulations (SCF, 2006).
The recommended daily intake of manganese for infants is 0.5-0.7 mg (Standing
Committee, 1997). Manganese levels determined in this study will be compared to those
of other researchers in table 2.2.
2.3.4 Copper
Copper is a cofactor in several metalloproteins, essential oxidation metabolism,
myelination and the metabolism of several steroid hormones (Department of Health,
1994). Clinical copper deficiency is a recognized hazard among preterm infants
(Lonnerdal, 1998). Copper deficiency increases the free radicals and leads to reduction of
infants are associated with iron deficiency and leads to several complications (Ebringe et al., 2008 ; Leotsinidis et al., 2005). Copper is a recent addition to many infant food formulations and little is known about its bioavailability (Khangani et al., 2009). A study by Lynne (2007) suggested that variation in copper levels present in infant formulations
and previously published values might be due to recent increase in copper content of
infant milk formulations in line with the infant food formula and follow-on formula
regulations. The recommended daily intake of copper for infants is 0.5-0.7 mg (Standing
Committee, 1997). The levels of copper found in this study will be compared together
with those of other researchers in literature.
2.3.5 Potassium
Potassium is a very important mineral for the proper functioning of the cells, tissues and
organs in the human body. It is also an electrolyte, a substance which conducts electricity
in the body, along with sodium, chloride, calcium and magnesium. Potassium is crucial to
heart function and plays a key role in skeletal and smooth muscle contraction (He et al., 2008). Potassium regulation and homeostasis during infancy are, owing to growth and
development, different from later life. Infants need to retain more K+than adults, to avoid
growth retardation (Aizman et al., 1998). Many foods contain potassium, including all meats, fruits and vegetables. Dairy products are also good sources of potassium (He et al., 2008). Having too much potassium in blood is called hyperkalemia while having too little is called hypokalemia (Perazzella, 2000). Studies show a positive link between a
diet rich in potassium and bone health, particularly among elderly women, suggesting
prevention (Zhu et al., 2009). Adequate intake of potassium dietary sources are 400
mg/day and 700 mg/day for infants of 0-6 months and 7-12 months respectively
(Physicians reference desk, 2001).
2.3.6 Calcium
Calcium, about which, 99% is found in the skeleton and other parts such as plasma,
(Bruadus, 1993), is very important element. Calcium requirements are affected
substantially by genetic variability and other dietary constituents, and the interrelation of
these factors make identification of a single unique number for calcium "requirements"
for all children impossible (Institute of medicine, food and nutrition board, 1997). It has
been recognized that a very low calcium intake can contribute to the development of
rickets in infants and children, especially those consuming very restrictive diets such as
macrobiotic diets (Legius et al., 1989). Premature infants have higher calcium
requirements than full-term infants while in the nursery and that this may be met by using
human milk fortified with additional minerals or with specifically designed formulations
for premature infants (Schanler et al., 1995). Although Ca and P levels of human milk are
significantly lower than those of current infant formulas, bone mineralization is similar in
breast and formula fed infants (Mimouni et al., 1993). It is not likely that in the future
both Ca and P levels in infant formulations will be further reduced to levels closer to
those in human milk, provided that homeostasis and bone mineralization prove to be
adequate (Mimouni et al., 1993). The recommended daily intake for infants is 360 mg
study will compared with the required daily intakes and also those of other researchers
presented in table 2.2.
2.3.7 Magnesium
Magnesium is the fourth most abundant cation in human body after sodium, potassium
and calcium (Civitelli et al., 1994). The human body contains about 760mg of
magnesium at birth, approximately 5g at age 4-5 months and 25g when adult. An amount
of 30- 40 percent magnesium in the body is found in muscles and soft tissues, 1 percent is
found in intracellular fluid and the remainder is in the skeleton, where it accounts for up
to 1 percent of bone ash (Webster, 1987).
Soft tissue magnesium functions as a co-factor of many enzymes involved in energy
metabolism, protein synthesis, RNA and DNA synthesis and maintenance of the
electrical potential of nervous tissues and cell membranes. Of particular importance with
respect to the pathologic effects of magnesium depletion is the role of this element in
regulating potassium fluxes and its involvement in the metabolism of calcium
(Al-Ghamdi et al., 1994). Pathologic effects of primary nutritional deficiency of magnesium
occur infrequently in infants but are even less common in adults unless a relatively low
magnesium intake is accompanied by prolonged diarrhea or excessive urinary magnesium
losses (Lonnerdal, 1995). The recommended diet intake for infants is 50mg (Standing
Committee, 1997). The reported levels of magnesium by other researchers in different
2.3.8 Chromium
Chromium is an essential trace element which has been used in alloy steels and
electroplating for a long time in chemical industries. It is important in the human body for
protection against cardiovascular disease by helping to regulate fat and cholesterol
synthesis in the liver (WHO, 1988a). It also plays a role in activation of vitamin C in the
body. Chromium aids in Fe absorption and reduces oxidative stress and HIV viral load
(WHO, 1996b). The daily human intake of Cr ranges from 50 to 200ug (AI Durtsch,
1999). Modem refining of foods and over consumption of refined carbohydrates, remove
the Cr naturally present. Chromium deficiency has been demonstrated in malnourished children with the basic disturbance being an impairment of the action of circulating
insulin. The body requires chromium when producing protein and failure to get enough
chromium leads to premature aging (AI Durtsch, 1999).
2.4 Analytical techniques
The most common modem methods for analysis of trace elements are: Flame atomic
absorption spectroscopy (FAAS) (American Chemical Society, 2006), X-ray fluorescence
(XRF) (Beckhoff etal., 2006), Inductively coupled plasma-atomic emission spectroscopy
(lCP-AES) (Wanjau et al., 2001), Mass spectrometry (MS) (Becker etal., 2008), Neutron
,
activation analysis (NAA) (Horwitz, 2001)and Proton induced x-ray emission (PIXE)
(Preoteasa et al., 2008). Flame atomic absorption spectrophotometry has been discussed
2.4.1 Flame Atomic absorption spectroscopy (FAAS)
The AAS works on the principle of absorption of radiation by atoms at discrete
wavelengths characteristic of the absorbing species. The radiation beam is attenuated by
an amount that is proportional to the concentration of the element under consideration in
the atomizer (American chemical society, 2006). The concentration of an element is
measured by the absorption of radiation with a characteristic frequency by free atoms of
an element. The strength of this method is that atoms absorb only at a wavelength that is unique to the test element. A hollow cathode with the cathode made of the element to be determined emits spectral lines corresponding to the excitation of the element of interest.
Atomization of the element can be achieved by introducing a fine spray of test solution
through a nebulizer into an air/acetylene or nitrous oxide/ acetylene flame. An electrically
heated graphite furnace is used when very high sensitivity is required. Before the solution
enters into the flame, it is dispersed into a mist of very small droplets, which gets
evaporated to give a dry salt. Part of the salt is dissociated into atoms of the element of
interest, which then absorbs radiation from an external source. The unabsorbed radiation
from the flame is allowed to pass through a monochromator, which isolates the existing
spectral lines of the light source. The unabsorbed radiation is then led into the detector
and the output of which is amplified and measured.Absorption of light is associated with
.---...,Entra ce slit.----~..., E it slit
Source f----f----t Atomizer
Exit I"tS 1
Readout
-f
--Detector System
Monochromator
Figure 2.1: Schematic diagram of an atomic absorption spectrophotometer
The components of the instruments as shown in the Figure 2.1 are:
(a) Radiation source
There are two types of sources:
(i) Continuous source
The continuous source gives a wide range of radiation including deuterium lamp and
mercury vapour lamp. Limitations of continuous source are that only a small band of
radiation passed by monochromator is absorbed and a large portion of unabsorbed
radiation falls on the detector and this reduces the sensitivity.
(ii) Hollow cathode source
It is the most common source of radiation used in most FAAS instruments. The cathode
is made of metal of interest. The lamp consists of a tungsten anode and a cylindrical
Figure 2.2 shows a diagram of ahollow cathode tube.
Anode
Quartz window
Cathode Filler gas
Figure 2. 2: Hollow cathode lamp
(b) Atomiser
There are two types, flame and electrothermal atomizers. In the flame the final
temperature is determined by flow rate and ratio of oxidant and fuel. When the
desolvation occurs in the flame, it is evaporated to produce a finely divided solid
molecular aerosol. Dissociation of these molecules then leads to an atomic gas. Some of
the atoms then ionize to give cations and electrons. In electrothermal atomizers, a few
microlitres of sample are first evaporated at a low temperature and then ashed ata higher
temperature in an electrically heated graphite. After ashing the temperature is increased
to 2000-3000 °C causing atomization of the sample.
(c) Monochromators
Monochromators are filters, prisms or gratings that disperse or separate radiation so that
selected wavelengths corresponding to a particular energy within the sample is
transmitted to the detector.
There are several kinds of detectors including, phototubes, photomultiplier tube and
photodiode array detectors. These detectors convert radiant energy into electrical signal. e) Read out systems
Read out systems are digital and coupled with microprocessors that allow the
programming of various aspects bringing simplicity to separate procedures such as
calibration and calculation of concentration.
The working of the atomic absorption spectrophotometer involves absorption of light that
is associated with the process of transition from one steady state to another. For instance the case of steady states 0 and J where Ej>Eo, the O-J transition results in the absorption
of light with frequency as shown by Maxwell-Boltzman Equations 2.1 and 2.2 below
VOl
=
E)
- E
o
;{ ---
(2.1)Where h is the plank constant.
The Maxwell-Boltzmann law gives relative number of atoms in the excited state to the
number of atoms in ground state as:
-N
;
{v
a
=
X
exp( --E/ kt) ---(2.2)Where k is the Bortzmann constant, T is the temperature in degrees Kelvin, and Ej is the
energy difference between the excited state and the ground state. The quantities Pj and Po
are statistical factors that are determined by the number of states having equal energy at
CHAPTER THREE: MATERIALS AND METHODS
3.1 Research design
The study focused on eleven types of infant formulation brands. Infant food formulations
analysed were selected randomly and purchased from Nakumat, Tuskys, Ukwala and
Naivas which are the major supermarkets in Nairobi County. The research experimental
design, involved determination of concentration of iron, zinc, manganese, chromium,
copper, potassium, magnesium and calcium in infant food formulations. The foods for
age sets; 0-6 months and 7-12 months were analyzed for the levels of the essential
elements. Levels of essential elements indicated on labels were noted and compared with
the experimental values of this study.
3.2 Cleaning of glassware and preparation of standard solutions
All glassware were cleaned, washed with detergent and rinsed in de-ionized water. They
were then soaked in 1:1 nitric acid solution. The reagent used was of high quality
analytical grade. Stock solution was used to prepare working solution by serial dilution.
The working solution was then used to prepare standard solution. The standard solution
of metal was freshly prepared on daily basis. All the powdered infant food formulations
samples were kept at room temperature. The infant formula food samples were then
3,3 Instrumentation and apparatus
Analysis of K, Ca, Mg, Fe, Zn, Cu, Mn and Cr was carried out in triplicate using a
computerized atomic absorption spectrophotometer model SpectrAA-10 from Varian
Techtron company, Australia. A blank solution made by using acids for the digestion
process was used to zero the instrument before calibration and aspiration of samples into
the flame. Standard solution for each element was prepared from a stock solution by
serial dilution. By aspirating standard in the atomizer the amount of absorbed radiation
was determined. Using concentration of standards, a calibration curve was obtained and
used to quantify the essential element levels in the digested samples and blank. Table 3.1 given shows the operating conditions of the FAAS instrument.
T bI 31Tha e , eFAAS operatin12con Ionsd'ti
~
Wavelength Slit wit (nrn) Flame (nm)
Element
K 766.5 l.0 Air/acetylene
Ca 422.7 0.5 Air/nitrous oxide
Mg 285.2 0.5 Air/acetylene
·Fe 248.3 0.2 Air/acetylene
Zn 213.9 l.0 Air/acetylene
Cu 324.7 0.5 Air/acetylene
Mn 279.5 0.1 Air/acetylene
Cr 357.9 0.2 Air/nitrous oxide
3.4 Reagents
The reagents used were of high quality analytical grade. The standard solutions of the
3.5 Sample collection and pretreatment
The more popular infant milk and cereal formulations in the major supermarkets in
Nairobi were first considered. Afterwards, eleven different branded commercial infant
formulas sold in Nairobi were purchased from the supermarkets. These brands comprised
of six infant milk formulations and five cereal formulations. The eleven brands show a
fair representation of the types of infant food formulations in Nairobi market. The infant
food formulations were collected from various supermarkets in Nairobi. The samples
were kept at room temperature. The total number of samples collected based on their
brand names, age group and batch numbers were 51.
3.6 Sample preparation
An amount of 2.5000 g of sample was weighed using a Mettler Toledo analytical balance
model AG 204. The weighed samples were placed in a 250 ml Kjedhal digestion flask
and a 27 ml mixture of HN0. 3 and H2 S04 was added to the sample in the ratio 2: 1.The '
mixture was heated gently on a hot mantle until brown fumes disappeared. It was then
cooled and 3 ml of perchloric acid was added carefully. Digestion was continued until
the solution was clear and white fumes observed. The digest was allowed to cool and
filtered using Whatman No. 42 filter paper into a 50 ml volumetric flask. Finally the
solution was diluted to the mark with distilled de-ionised water. The digested sample was
. 3.7 Method validation
The procedure and method were validated by use of matrix spikes. The sample was spiked with a known concentration of the analyte and allowed to pass through the
procedure as the unspiked sample. Concentration of each analyte used in spiking was as presented in table 3.2.
T bi 32 Aa e . naryiI te concen ra IOnst ti
Analyte Volume (ml) Concentration (ppm)
K 1 1000
Mg 1 1000
Ca 1 1000
Fe 1 100
Zn 1 100
Cu 1 10
Mn 1 10
The percentage recovery was calculated using the formula;
SSR - USR
%Recovery.= --- -AS
.
3.8 Data analysis
The results obtained in this research were analyzed using statistical product and service
solutions (SPSS), version 17.5. Analysis of variance (ANOVA) and students' t-test were
used to compare the concentration of the essential elements in the infant food
formulations. Percentage contributions were also used to compare levels obtained for
CHAPTER FOUR: RESULTS AND DISCUSSION
4.1 Introduction
The major essential elements, K, Mg, Ca and trace essential elements Fe, Zn, Cu, Mn and
Cr were analysed in triplicates using FAAS. The results obtained varied between the
different types of eleven (11) infant food formulations which were based on milk and
cereals. The results, as discussed in the following sections, demonstrated a variation in
the mean concentrations of most of the essential elements in the infant food formulations
that were analysed.
4.2 Method validation
This was done by use of recovery analysis of the elements. The results obtained are
presented in table 4.1.
T bl 41 Pa
e .
ercen age recot
venes 0fanatIyit
esampiIeElement USR (mg/100 g) SSR (mg/100 g) AS (mg) %
RE
C
O
VERY
Potassium 230.15 457.72 255.400 89
Calcium 183.35 ·348.40 163.420 101
Magnesium 26.56 47.90 22.460 95
Iron 3.13 6.23 3.560 87
Zinc 2.89 5.43 3.020 84
Copper 0.16 0.35 0.155 103
Manganese 0.31 0.61· 0.330 94
Chromium 0.21 0.39 0.210 86
USR, SSR and AS means unspiked sample result, spiked sample result and amount spiked respectively
From table 4.1 the percentage recoveries were in the range of 84 %- 103 %. The results
obtained from these recoveries show that the method used in the analysis was reliable.
'values of percentage recoveries could be due to random errors. Therefore the results from
these recoveries confirm the reliability of the analytical method used in this study.
4.3 Linearity of FAAS calibration curves
Regression analysis was used to evaluate the linearity of the established calibration
curves. The absorbance readings and concentrations of ideal standards were used to
calculate correlation coefficient (R2) values and the results are presented in table 4.2.
Table 4.2 Correlation coefficient (R2) values of AAS calibration curves
Element Correlation values (R.l)
K 0.9970
Mg 0.9870
Ca 0.9980
Fe 0.9970
Zn 0.9990
Cu 0.9980
Mn 0.9970
Cr 0.9951
From the results presented in Table 4.2,' it can be concluded that the linearity of the
established calibration curves are good, hence accurate measurements guaranteed. The
performance ofthe FAAS spectrophotometer used in this study was therefore good and
reliable to warrant its use in the analysis of the selected essential elements in infant food
.4.4 Levels of essential elements in infant milk formulations for 0- 6 months and
7-12 months age groupsThe results for the mean levels of each of the essential elements K, Mg, Ca, Fe, Zn, Cu,
Mn and Cr determined and measured in infant milk formulations for 0- 6 months and 7
-12 months age groups, are discussed in the following sections.
4.4.1 Mean levels of K in infant milk formulations for 0- 6 months and 7 - 12 months age groups
The results of the analysis ofK in the milk formulas for 0 - 6 months and 7 - 12 months
age group are presented in table 4.3.
Table 4.3 Mean levels of K (mg/l00g) in infant milk formulations for 0 - 6 mont hsan d 7
-
12monthsage groupsI
Code 0-6 months 7 -12 months
(n=9) (n=9)
A 464.00±6.0Sbc 478.83±2.3Sb
B 447.33±4.04b 461.S0±1.73b
C 3S8.17±7.70a 394.33±16.37a
0 36S.00±7.64a 463.83±6.93b
E , 44S.00±O.87b 468.17±3.24b
F 470.67±1.69c 479.67±1.01b
Mean values with the same superscript in the same column do not differ significantly
Table 4.3 presents the mean levels of K in infant food formulations for 0- 6 months and
7 - 12 months' age groups. From the results of 0- 6 months infant food formulations, it
. with averages of 470.67, 464.00, 447.33, 445.00, 365.00 and 358.17 mgll OOg respectively. The differences in the levels of K in C and D were not statistically significant. However, there was a significant difference (p <0.05) in the levels of K in E and F. Furthermore, table 4.3 present the results of 7 - 12 months infant food formulations with F having the highest concentration of K followed by A, D, E, Band C in that order. Levels of K in infant food formulations A, B, E, 0 and F are not significantly different. But K levels in infant formula C of 7 - 12 months was significantly different from those of A, B, 0, E and F. Comparing the means of K in
infant food formulations for 0 - 6 months and 7 - 12 months age groups, it was observed that infant formulations of 7 - 12 months always had the highest mean level. However, there was significant difference in the K means of A and C.
There was variation in the mean levels of K in some of the infant food formulations and this may be attributed to ingredients used to make up the several formulations. It is notable from the results presented in table 4.3 that all the analysed infant food
formulations, except for C, had low standard deviations in their K levels and this can be
attributed to consistency in the milling techniques used in the manufacture of infant food
formulations. The high standard deviations for C, 0 - 6 months (7.7) and C, 7 - 12 months (16.37) may be due to ingredients. The formulations may be used, generally as replacement foods so as to boost potassium requirements for infants and toddlers .
. and Ahmad (2010) in their work on determination of key elements in commercially
available infant formulations reported K levels of 402 mg/l OOg,which is also comparable
to the values reported in this study.
4.4.2 Mean levels ofMg in infant milk formulations for 0 - 6 months and 7 -12 months age groups
The results of the analysis of Mg in infant milk formulas are presented in table 4.4.
Table 4.4: Mean levels ofMg (mg/l00g) in infant milk formulations for 0 - 6 mont
hsan d 7
-
12monthsage groups0-6 months 7 -12 months Code
(n=9) (n=9) p-value
A 25.83±1.69 31.83±1.30 0.0480
B 34.17±3.38 27.00±0.87 0.1090
C 19.67±0.73 22.50±2.75 0.3760
D 34.00±0.00 35.17±0.88 0.2560
E 30.17±0.44 37.67±0.44 0.0003
.
F 32.33±3.18 29.83±1.69 0.5260
From the results in table 4.4, it can be noted that B had the highest mean level of Mg
(34.17), followed by D (34.00), F (32.33), E (30.17), A (25.83) and finally C (19.67)
mgll OOgrespectively among the infant food formulations for 0 - 6 months. On the other
.hand the results of 7- 12 months infant food formulations presented mean value of Mg in
E (37.67) as the highest followed by D, A , F, B and finally C with averages values of
and 7 - 12 months infant food formulations, there was no significant difference in the
average values of Mg in B, C, D and F with P>0.05 at 95% confidence level. However,
there was significant difference in the mean values of Mg in A and E, (P<0.05). The
highest mean value of Mg in E, 7- 12months, suggests that the infant food formulations
can be recommended for feeding infants with magnesium deficiency disease,
magnesemia. The other infant formulas may be used, generally, as replacement foods so
asto boost magnesium requirements for infants.
The variation in the mean levels of Mg in infant food formulations for 0- 6 months and 7
- 12 months may be attributed to the several ingredients from which the infant food
formulations are manufactured. The maturity stage of the infant, 0 - 6 months or 7- 12
months may be another factor considered when formulating.
The mean levels of Mg found in this research study are lower than Mg value of 53.53
mgll OOgreported by Khalifa and Ahmad (2010). This may be due to geographical factors
of ingredients used to manufacture the infant food formulations.
4.4.3 Mean levels of Ca in infant milk formulations for 0- 6months and 7 -12
months age groups
Table 4.5: Mean levels of Ca (mg/100g) in infant milk formulations for 0 - 6 months
d
7
12
than
-
mons
age groups0-6 months 7 -12 months
Code
(n=9) (n=9)
A
334.17±1.93bc 433.00±2.4i
B 163.00±1.44a 261.83±1.17a
C 433.67±2.89d 422.83±2.17e
D 366.00±9.26c 408.33±2.19d
E 318.33±2.62bc 333.S0±S.3Sc
F 286.33±S.37b 314.33±2.49b
p-value <0.001 <0.001
Mean values with the same superscript in the same column do not differ significantly
From the results of 0 - 6 months age group infant food formulations in table 4.5, Chad
the highest,mean value of Ca, 433.67 mgllOOg followed by D, A, E, F and B in that
order with means of 366.00, 334.17, 318.33, 286.33 and 163.00 mgll OOgrespectively.
The difference in the means of Ca in A, D, E and F was not statistically significant.
Infant formula C can be recommended for feeding infants suffering from Ca deficiency
disease, osteoporosis and those who are not breastfeeding due to its high Ca content. For
7 - 12months infant food formulations the mean Ca levels (mgIlOOg) in A, 433.00, was
the highest followed by C (422.83), D (408.33), E (333.50), F (314.33) and finally B
(261.83). The mean of Ca in infant formula C for 0 - 6 months and 7 - 12 months is a
small difference with both means, 433.67 and 422.83, well over 400 mgllOOg. Therefore
The variability in the mean values of Ca in all the infant food formulations and for both
age groups may be attributed to the ingredients and the manufactures formulation
techniques. The mean values of Ca in the milk formulations C of 433.67 mg/IOOg and
422.83 mg/l00g compare well with mean level of 445.47 mgllOOg reported by Khalifa
and Ahmad (2010).
4.4.4 Mean levels of Fe in infant milk formulations for 0 - 6 months and 7 -12 months age groups
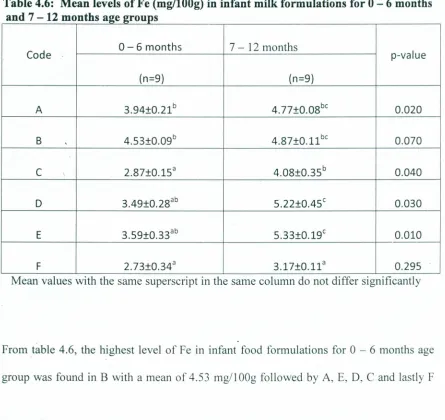
The levels of Fe in the infant food formulations for two maturity ages are presented in table 4.6.
Table 4.6: Mean levels of Fe (mg/l00g) in infant milk formulations for 0 - 6 months
d 7 12 th
an
-
mon s age groupsCode 0-6 months 7- 12 months p-value
(n=9) (n=9)
A 3.94±0.21b 4.77±0.OBbc 0.020
B , 4.S3±0.09b 4.B7±0.11 be 0.070
C 2.B7±0.lSa 4.0B±0.3Sb 0.040
D 3.49±0.2Bab S.22±0.4Sc 0.030
E 3.S9±0.33ab S.33±0.19c 0.010
F 2.73±0.34a 3.17±0.l1a 0.29S
Mean values WIth the same superscnpt In the same column do not differ significantly
:From table 4.6, the highest level of Fe in infant food formulations for 0- 6 months age
with mean values of 3.94, 3.59, 3.49, 2.87 and 2.73 mgll OOgrespectively. There was no
significant difference in Fe levels found inA, B, Dand E. The mean levels of Fe inC and
F, 0 - 6 months, infant food formulations were not significantly different from each
other. However, the mean levels of Fe in C and F were significantly different from those
found in A and B. The difference may be attributed to ingredients used by manufacturers
to fortify the infant food formulations with Fe, since at this stage, 0- 6 months, infants
require high amount of Fe for the making of blood. The low bioavailability of Fe from
infant food formulations may be another factor that necessitates Fe fortification.
From the results in table 4.6, for 7 - 12 infant food formulation age group, the highest
concentration of Fe detected is in E with a mean of 5.33mgll OOgfollowed by D (5.22
mgIlOOg), B (4.87 mg/lOOg), A, (4.77 mgIlOOg), C (4.08 mgllOOg) and lastly F (3.17
mg/l OOg). The mean levels of Fe recorded in 7 - 12 month infant F was significantly
different from those recorded in A, B, C, D and E. Infant food formulation F had low
mean levels of Fe and could be a food intended to be used as a substitute to breast milk.
Comparing the mean levels of Fe, using t-test, in infant food formulations for 0 - 6
months and 7 - 12 months age groups, it was found that 7 - 12 months infant food
formulations contain relatively higher values of Fe than the 0 - 6 months age group
formulations but the difference was not statistically significant except for A, C, D and E
at P<0.05. This may be attributed to the manufacturer's design of infant food
formulations since at this age of 7 - 12 months, a chi ld' s growth rate is very fast and
The mean levels of Fe in table 4.6 were higher than those reported by Ljung et al.,
(2011), who reported concentrations of Fe as 5.7 mg/Kg in milk formulations and 1.2
mg/Kg in cereal rice based formulations.
4.4.5 Mean levels of Zn in infant milk formulations for 0 - 6 months and 7 -12 months age groups
Table 4.7 presents the results ofthe levels of Zn in the analysed milk formulations
Table 4.7: Mean levels of Zn (mg/l00g) in infant milk formulations for 0- 6months
d7 12 th
an
-
mons
age groupsCode 0-6 months 7 -12 months p-value
(n=9) (n=9)
A 2.78±0.lS 3.26±0.11 0.060
B 3.83±0.OS 4.09±0.03 0.010
C , 2.93±0.10 3.2S±0.OS 0.103
D 2.1S±0.OS 4.34±0.06 0.00001
E 3.29±0.08 4.S3±0.39 0.037
F 2.79±0.02 2.82±0.10 0.7S6
With reference to the results presented in table 4.7, it can be noted that among the infant
food formulations for 0- 6 months age group B had the highest mean level of Zn as 3.83
mgllOOg followed by E, C, F, A and finally D.with average values of 3.29,2.93,2.79,
2.78 and 2.15 mgll OOgrespectively. Considering the mean Zn levels in the 7- 12 months
followed by D (4.34 mg/100g), B (4.09 mgIlOOg), A (3.26 mgIlOOg), C (3.25 mgllOOg)
and finally F (2.82 mgll OOg).There was significant difference in the mean levels of Zn in
A, C and F, 7 - 12 months infant food formulations at 95% confidence level.
Furthermore, there was no significant difference in the Zn levels of B, D and E. However,
a significant difference was observed in the Zn levels of A, C and F when compared to
those of B, D and E, 7 - 12 months infant formulas. The difference may be due to
ingredients and losses during manufacturers' milling procedures. ,
When the Zn mean levels in corresponding infant food formulations for 0 - 6 months and
7- 12 months age groups were compared at 95% confidence level, the mean levels were
significantly different except for those of A, Cand F.This showed that the manufacturers
of infant food formulations recognize that different age groups require varying amounts
of zinc. The Zn mean levels for 7 - 12 months age group are slightly higher in all the
infant food formulations A, B, C, D, E and F, than in allthe infant formulations for 0 - 6
months age group. For this reason more informed selection of infant food formulations
should be done basing on the child's stage of growth. The mean levels of zinc (mgll OOg)
reported inthis study were lower than in previous report on trace element pattern in some
Nigerian formulations which gave zinc levels as ranging between 32.00 ug/g and 89.89
ug/g (Joseph et al., 2011).
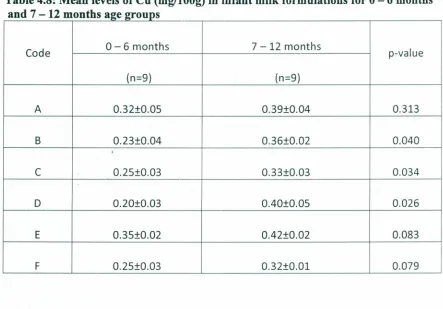
4.4.6 Mean levels of Cu in infant milk formulations for 0 - 6 months and age 7 - 12
months groups
.
The results for the analysis of copper in the infant milk formulations analysed were
Table 4.8: Mean levels of Cu (mg/l00g) in infant milk formulations for 0 - 6 months and 7 - 12 months age groups
Code 0-6 months 7 -12 months p-value
(n=9) (n=9)
A 0.32±0.OS 0.39±0.04 0.313
B 0.23±0.04 0.36±0.02 0.040
,
C 0.2S±0.03 0.33±0.03 0.034
D 0.20±0.03 OAO±O.OS 0.026
E 0.3S±0.02 OA2±0.02 0.083
F 0.2S±0.03 0.32±0.01 0.079
The results (table 4.8) showed that the concentration of Cu in the infant food
formulations, 0 - 6 months, had E (0.35 mgll OOg)being the highest. This was followed by A, C, F, B and finally D having average values of 0.32, 0.25, 0.25, 0.23 and 0.20
mgll OOgrespectively. There was a significant difference in the Cu mean levels inA from
those in B, C, D, E and F at 95% confidence level. This showed that there is consistency
in the levels of copper in the infant food formulations. On the same note, it can be
concluded that a good number of infant formula manufacturers comply with guidelines
for nutrient levels in the formulas, for example, Codex Alimentarious Code and
WHOIFAO recommendations. The mean levels of Cu in infant food formulations for 7
-12 moriths was the highest in E (0.42 mgll OOg),followed by D, A, B, C and F having
significantly different from those of A, B, C, E and F (P=0.05). This confirms that Cu requirements by infants of both age groups are almost the same. Comparing the average values of Cu in 0 - 6 months and 7 - 12 months, infant food formulations, there was a significant difference in those of B, C and D with P<0.05.
The levels of Cu in the milk based infant food formulations analysed in this study were lower than Cu levels of between 0.53 mg/L and 0.7 mg/L reported in infant food formulations by Khaghani et al. (2009).
4.4.7 Mean levels of Mn in infant milk formulations for 0 - 6 months and 7 -12 months age groups
The results for the analysis of Mn in infant milk formulations were presented in Table 4.10.
Table 4.9: Mean levels of Mn (mg/l00g) in infant milk formulations for 0 - 6 months d7 12 th
an
-
mon s age 2roupsCode 0-6 months 7 -12 months p-value
(n=9) (n=9)
A 0.15±0.02 0.33±0.04 0.014
B 0.31±0.01 0.41±0.03 0.043
C 0.34±0.02 0.44±0.02 0.038
D 0.32±0.04 0.65±0.07 0.014
E 0.26±0.02 0.52±0.02 0.001
From the results presented in table 4.9, the mean levels of Mn determined in the 0 - 6
months infant food formulations was highest in C with a value of 0.34 mgll OOg,followed
by D, B, E, A and F with average values of 0.32, 0.31, 0.26, 0.15 and 0.10 respectively.
Table 4.10 presents the Mn mean levels in infant food formulations for 7 - 12 months age
group with D having the highest mean level of 0.65 mgll OOgfollowed by E, F, C, Band
A, with average values of 0.52, 0.45, 0.44, 0.41 and 0.33 in that order. Comparing the
mean levels of Mn in infant food formulations for 0 - 6 months and 7 - 12months age
groups showed that infant food formulations for 7 - 12 months age group contained
higher Mn levels than their corresponding formulations. For example, A had Mn
(0.33mgIl00g) in A, 7- 12 months, higher than Mn (O.l5mgIl00g) in A, 0 - 6 months.
The results of Mn, in D and F, 7 - 12 months age group were significantly different
(P<0.05), from those of the corresponding 0 - 6months age group.
4.4.8 Mean levels of Cr in infant milk formulations for 0 - 6 months and 7 -12 months age groups
The results presented in table 4.10 were obtained from the analysis of Cr in infant milk
Table 4.10: Mean levels of Cr (mg/l00g) in infant milk formulations for 0 - 6 th
d 7
12
th
mon san
-
mons
age groupsCode 0-6 months 7 -12 months p-value
(n=9) (n=9)
A 0.03±0.01 0.07±0.02 0.206
B
<
DL
<DL
C 0.02±0.00 0.03±0.01 0.116
D
0.03±0.01 0.04±0.01 0.725E 0.02±0.00 0.02±0.00 0.130
F
<
DL
<
DL
DL - Detection limit
It can be noted in table 4.10, that the mean levels of Cr in infant formulation Band F for
both age groups were below detection limit. However, in the other infant food
formulations for 0 - 6 months and 7 - 12 months age groups, Cr was detected and
measured. The mean level of Cr determined was higher in infant formulations A
(0.03mg/l00g) and D (0.03mg/1 OOg)than in C (0.02 mg/1OOg) and E (0.02). The low
levels of Cr, though detected in some of the infant milk investigated suggests the
manufacturers quest to formulate a product that can supply all the essential minerals to
the infant. Infant food formulation A, for 7 - 12 months, had the highest mean level of
Cr, 0.07mg/1 OOg followed by C, D, and E with mean values of 0.04, 0.03 and
0.02mg/l OOgrespectively. The results showed that infant's needs for Cr increased with
detected in all the infant food formulations for 0 - 6 months and 7 - 12 months. The
difference can be attributed to ingredients used manufacture the infant milk formulations.
4.5.0 Levels of major essential elements in cereal based infant formulations
The mean levels of major essential elements in cereal based infant formulations (IF) were
determined and the results shown in table 4.11.
Table 4.11: Levels of major essential elements (mg/lOOg) in cereal based infant
~ormu a Ions orI f
r
7-
12months age2roup~
G H I J L
Elemen
K 271.3±23.0c 399.1±8.7° 481.67± 1.1
i
344.67±8.80° 475.833±0.7 3~Mg 89.83b 34.67b 87.00° 28.17b 38.00c
Ca 439.17° 251.67c 387.17e 253.00c 443.00°
-Mean values with same superscript in the same row do not differ significantly -IF represents infant formula
From the results (table 4.11), the mean value of K was highest in infant formulation I
with a mean of 481.67 mgll OOg and lowest in cereal formulation G with a mean of
The mean amount of K in cereal formulas Hand J were not significantly different at 95%
confidence level. However, the mean values of K in G, I and L were significantly
different. This may be attributed processing practices by the manufacturers so as to produce various formulation brands.
From table 4.11, the mean amount of Mg in cereal formula G (89.83 mgllOO) was the
highest while that obtained from J (28.17 mgll OOg)was the lowest. It can be noted that
there was no significant difference in the mean values of Mg in G, Hand 1.But the mean
values of Mg in I (87.00 mgll OOg)and L (38.00 mgllOOg) were significantly different.
The variation may be attributed to ingredients. The mean value of Mg in cereal
formulation I was significantly different from the mean values of G, H, J and L.
The mean values of Ca from table 4.11 show variation with the highest value in L
(443.00 mg/100g) followed by G, I,J and H with mean values of 439.17, 387.17, 253.00
and finally 251.67 mgll OOgrespectively. The mean values of Ca in cereal based infant