Concept Discovery from Text
Dekang Lin and Patrick Pantel
Department of Computing Science University of Alberta
Edmonton, Alberta, Canada, T6G 2E8 {lindek,ppantel}@cs.ualberta.ca
Abstract
Broad-coverage lexical resources such as WordNet are extremely useful. However, they often include many rare senses while missing domain-specific senses. We present a clustering algorithm called CBC (Cluster-ing By Committee) that automatically discovers concepts from text. It initially discovers a set of tight clusters called committees that are well scattered in the similarity space. The centroid of the members of a committee is used as the feature vector of the cluster. We proceed by assigning elements to their most similar cluster. Evaluating cluster quality has always been a difficult task. We present a new evaluation methodology that is based on the editing distance between output clusters and classes extracted from WordNet (the answer key). Our experiments show that CBC outperforms several well-known clustering algorithms in cluster quality.
1 Introduction
Broad-coverage lexical resources such as WordNet are extremely useful in applications such as Word Sense Disambiguation (Leacock, Chodorow, Miller 1998) and Question-Answering (Pasca and Harabagiu 2001). However, they often include many rare senses while missing domain-specific senses. For example, in WordNet, the words dog, computer
and company all have a sense that is a hyponym
of person. Such rare senses make it difficult for
a coreference resolution system to use WordNet to enforce the constraint that personal pronouns (e.g. he or she) must refer to a person. On the
other hand, WordNet misses the user-interface-object sense of the word dialog (as often used in
software manuals). One way to deal with these problems is to use a clustering algorithm to
automatically induce semantic classes (Lin and Pantel 2001).
Many clustering algorithms represent a cluster by the centroid of all of its members (e.g., K-means) (McQueen 1967) or by a representative element (e.g., K-medoids) (Kaufmann and Rousseeuw 1987). When averaging over all elements in a cluster, the centroid of a cluster may be unduly influenced by elements that only marginally belong to the cluster or by elements that also belong to other clusters. For example, when clustering words, we can use the contexts of the words as features and group together the words that tend to appear in similar contexts. For instance, U.S. state names can be clustered this way because they tend to appear in the following contexts:
(List A) ___ appellate court campaign in ___
___ capital governor of ___ ___ driver's license illegal in ___ ___ outlaws sth. primary in ___ ___'s sales tax senator for ___
If we create a centroid of all the state names, the centroid will also contain features such as:
(List B) ___'s airport archbishop of ___
___'s business district fly to ___ ___'s mayor mayor of ___ ___'s subway outskirts of ___
because some of the state names (like New York
and Washington) are also names of cities.
Using a single representative from a cluster may be problematic too because each individual element has its own idiosyncrasies that may not be shared by other members of the cluster.
class. For example, our system chose the following committee members to compute the centroid of the state cluster: Illinois, Michigan, Minnesota, Iowa, Wisconsin, Indiana, Nebraska and Vermont. As a result, the centroid contains only features like those in List A.
Evaluating clustering results is a very difficult task. We introduce a new evaluation methodol-ogy that is based on the editing distance between output clusters and classes extracted from WordNet (the answer key).
2 Previous Work
Clustering algorithms are generally categorized as hierarchical and partitional. In hierarchical agglomerative algorithms, clusters are constructed by iteratively merging the most similar clusters. These algorithms differ in how they compute cluster similarity. In single-link clustering, the similarity between two clusters is the similarity between their most similar members while complete-link clustering uses the similarity between their least similar members. Average-link clustering computes this similarity as the average similarity between all pairs of elements across clusters. The complexity of these algorithms is O(n2logn), where n is the
number of elements to be clustered (Jain, Murty, Flynn 1999).
Chameleon is a hierarchical algorithm that employs dynamic modeling to improve clustering quality (Karypis, Han, Kumar 1999). When merging two clusters, one might consider the sum of the similarities between pairs of elements across the clusters (e.g. average-link clustering). A drawback of this approach is that the existence of a single pair of very similar elements might unduly cause the merger of two clusters. An alternative considers the number of pairs of elements whose similarity exceeds a certain threshold (Guha, Rastogi, Kyuseok 1998). However, this may cause undesirable mergers when there are a large number of pairs whose similarities barely exceed the threshold. Chameleon clustering combines the two approaches.
K-means clustering is often used on large data
sets since its complexity is linear in n, the
number of elements to be clustered. K-means is
a family of partitional clustering algorithms that iteratively assigns each element to one of K
clusters according to the centroid closest to it and recomputes the centroid of each cluster as the average of the cluster’s elements. K-means
has complexity O(K×T×n) and is efficient for
many clustering tasks. Because the initial centroids are randomly selected, the resulting clusters vary in quality. Some sets of initial centroids lead to poor convergence rates or poor cluster quality.
Bisecting K-means (Steinbach, Karypis,
Kumar 2000), a variation of K-means, begins
with a set containing one large cluster consisting of every element and iteratively picks the largest cluster in the set, splits it into two clusters and replaces it by the split clusters. Splitting a cluster consists of applying the basic K-means
algorithm α times with K=2 and keeping the
split that has the highest average element-centroid similarity.
Hybrid clustering algorithms combine hierarchical and partitional algorithms in an attempt to have the high quality of hierarchical algorithms with the efficiency of partitional algorithms. Buckshot (Cutting, Karger, Pedersen, Tukey 1992) addresses the problem of randomly selecting initial centroids in K-means
by combining it with average-link clustering. Buckshot first applies average-link to a random sample of n elements to generate K clusters. It
then uses the centroids of the clusters as the initial K centroids of K-means clustering. The
sample size counterbalances the quadratic running time of average-link to make Buckshot efficient: O(K×T×n + nlogn). The parameters K
and T are usually considered to be small
numbers.
3 Word Similarity
Following (Lin 1998), we represent each word by a feature vector. Each feature corresponds to a context in which the word occurs. For example, “threaten with __” is a context. If the word handgun occurred in this context, the
context is a feature of handgun. The value of the
feature is the pointwise mutual information (Manning and Schütze 1999 p.178) between the feature and the word. Let c be a context and Fc(w) be the frequency count of a word w
occurring in context c. The pointwise mutual
information between c and w is defined as:
( )
( ) ( )
N j F
N w F
N w F
c w
j c i
i c
mi
∑
where N =
∑∑
( )
i j i j
F is the total frequency counts of all words and their contexts. A well-known problem with mutual information is that it is biased towards infrequent words/features. We therefore multiplied miw,c with a discounting
factor:
We compute the similarity between two words
wi and wj using the cosine coefficient (Salton and
McGill 1983) of their mutual information vectors:
4 CBC Algorithm
CBC consists of three phases. In Phase I, we compute each element’s top-k similar elements.
In our experiments, we used k = 20. In Phase II,
we construct a collection of tight clusters, where the elements of each cluster form a committee.
The algorithm tries to form as many committees as possible on the condition that each newly formed committee is not very similar to any existing committee. If the condition is violated, the committee is simply discarded. In the final phase of the algorithm, each element is assigned to its most similar cluster.
4.1. Phase I: Find top-similar elements
Computing the complete similarity matrix between pairs of elements is obviously quadratic. However, one can dramatically reduce the running time by taking advantage of the fact that the feature vector is sparse. By indexing the features, one can retrieve the set of elements that have a given feature. To compute the top similar words of a word w, we first sort w’s features
according to their mutual information with w.
We only compute pairwise similarities between
w and the words that share a high mutual
information feature with w.
4.2. Phase II: Find committees
The second phase of the clustering algorithm recursively finds tight clusters scattered in the similarity space. In each recursive step, the
algorithm finds a set of tight clusters, called committees, and identifies residue elements that are not covered by any committee. We say a committee covers an element if the element’s
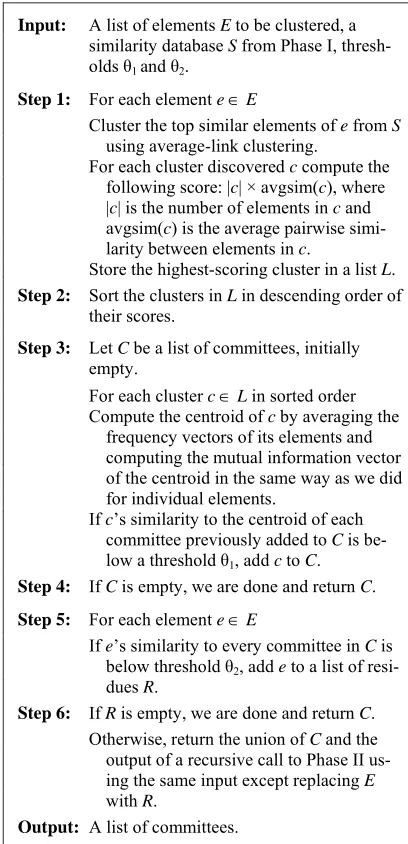
similarity to the centroid of the committee exceeds some high similarity threshold. The algorithm then recursively attempts to find more committees among the residue elements. The output of the algorithm is the union of all committees found in each recursive step. The details of Phase II are presented in Figure 1.
In Step 1, the score reflects a preference for bigger and tighter clusters. Step 2 gives preference to higher quality clusters in Step 3, where a cluster is only kept if its similarity to all previously kept clusters is below a fixed threshold. In our experiments, we set θ1 = 0.35.
Input: A list of elements E to be clustered, a similarity database S from Phase I,
thresh-olds θ1 and θ2.
Step 1: For each element e∈E
Cluster the top similar elements of e from S
using average-link clustering.
For each cluster discovered c compute the
following score: |c| × avgsim(c), where
|c| is the number of elements in c and avgsim(c) is the average pairwise
simi-larity between elements in c.
Store the highest-scoring cluster in a list L.
frequency vectors of its elements and computing the mutual information vector of the centroid in the same way as we did for individual elements.
If c’s similarity to the centroid of each
committee previously added to C is be-low a threshold θ1, add c to C.
output of a recursive call to Phase II us-ing the same input except replacus-ing E
with R.
Output: A list of committees.
Step 4 terminates the recursion if no committee is found in the previous step. The residue elements are identified in Step 5 and if no residues are found, the algorithm terminates; otherwise, we recursively apply the algorithm to the residue elements.
Each committee that is discovered in this phase defines one of the final output clusters of the algorithm.
4.3. Phase III: Assign elements to clusters In Phase III, every element is assigned to the cluster containing the committee to which it is most similar. This phase resembles K-means in
that every element is assigned to its closest centroid. Unlike K-means, the number of
clusters is not fixed and the centroids do not change (i.e. when an element is added to a cluster, it is not added to the committee of the cluster).
5 Evaluation Methodology
Many cluster evaluation schemes have been proposed. They generally fall under two categories:
• comparing cluster outputs with manually generated answer keys (hereon referred to as classes); or
• embedding the clusters in an application and using its evaluation measure.
An example of the first approach considers the average entropy of the clusters, which measures the purity of the clusters (Steinbach, Karypis, and Kumar 2000). However, maximum purity is trivially achieved when each element forms its own cluster. An example of the second approach evaluates the clusters by using them to smooth probability distributions (Lee and Pereira 1999).
Like the entropy scheme, we assume that there is an answer key that defines how the elements are supposed to be clustered. Let C be a set of
clusters and A be the answer key. We define the
editing distance, dist(C, A), as the number of
operations required to make C consistent with A.
We say that C is consistent with A if there is a
one to one mapping between clusters in C and
the classes in A such that for each cluster c in C,
all elements of c belong to the same class in A.
We allow two editing operations:
• merge two clusters; and
• move an element from one cluster to another.
Let B be the baseline clustering where each
element is its own cluster. We define the quality of a set of clusters C as follows:
(
)
(
B A)
dist A C dist
, , 1−
Suppose the goal is to construct a clustering consistent with the answer key. This measure can be interpreted as the percentage of operations saved by starting from C versus
starting from the baseline.
We aim to construct a clustering consistent with A as opposed to a clustering identical to A
because some senses in A may not exist in the
corpus used to generate C. In our experiments,
we extract answer classes from WordNet. The word dog belongs to both the Person and Animal
classes. However, in the newspaper corpus, the
Person sense of dog is at best extremely rare.
There is no reason to expect a clustering algorithm to discover this sense of dog. The
baseline distance dist(B, A) is exactly the
number of elements to be clustered.
We made the assumption that each element belongs to exactly one cluster. The transforma-tion procedure is as follows:
1. Suppose there are m classes in the answer
key. We start with a list of m empty sets,
each of which is labeled with a class in the answer key.
2. For each cluster, merge it with the set whose class has the largest number of elements in the cluster (a tie is broken arbitrarily).
3. If an element is in a set whose class is not the same as one of the element’s classes, move the element to a set where it be-longs.
dist(C, A) is the number of operations performed
using the above transformation rules on C.
a b e
c d e
a c d
b e
b a c d e
a b
c d e
A) B)
C) D) E)
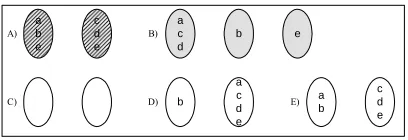
Figure 2. An example of applying the transformation rules
Figure 2 shows an example. In D) the cluster
containing e could have been merged with either
set (we arbitrarily chose the second). The total number of operations is 4.
6 Experimental Results
We generated clusters from a news corpus using CBC and compared them with classes extracted from WordNet (Miller 1990).
6.1. Test Data
To extract classes from WordNet, we first estimate the probability of a random word belonging to a subhierarchy (a synset and its hyponyms). We use the frequency counts of synsets in the SemCor corpus (Landes, Leacock, Tengi 1998) to estimate the probability of a subhierarchy. Since SemCor is a fairly small corpus, the frequency counts of the synsets in the lower part of the WordNet hierarchy are very sparse. We smooth the probabilities by assuming that all siblings are equally likely given the parent. A class is then defined as the maximal subhierarchy with probability less than a threshold (we used e-2).
We used Minipar 1 (Lin 1994), a
broad-coverage English parser, to parse about 1GB (144M words) of newspaper text from the TREC collection (1988 AP Newswire, 1989-90 LA Times, and 1991 San Jose Mercury) at a speed of about 500 words/second on a PIII-750 with 512MB memory. We collected the frequency counts of the grammatical relationships (contexts) output by Minipar and used them to compute the pointwise mutual information values from Section 3. The test set is constructed by intersecting the words in WordNet with the nouns in the corpus whose total mutual information with all of its contexts exceeds a threshold m. Since WordNet has a low coverage
of proper names, we removed all capitalized nouns. We constructed two test sets: S13403
consisting of 13403 words (m = 250) and S3566
consisting of 3566 words (m = 3500). We then
removed from the answer classes the words that did not occur in the test sets. Table 1 summa-rizes the test sets. The sizes of the WordNet classes vary a lot. For S13403 there are 99 classes
that contain three words or less and the largest class contains 3246 words. For S3566, 78 classes
have three or less words and the largest class contains 1181 words.
1Available at www.cs.ualberta.ca/~lindek/minipar.htm.
6.2. Cluster Evaluation
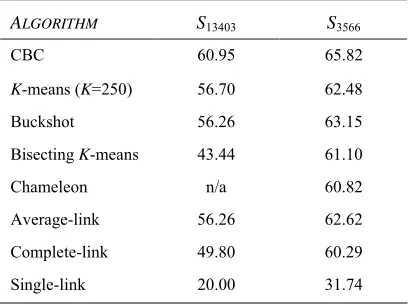
We clustered the test sets using CBC and the clustering algorithms of Section 2 and applied the evaluation methodology from the previous section. Table 2 shows the results. The columns are our editing distance based evaluation measure. Test set S3566 has a higher score for all
algorithms because it has a higher number of average features per word than S13403.
For the K-means and Buckshot algorithms, we
set the number of clusters to 250 and the maximum number of iterations to 8. We used a sample size of 2000 for Buckshot. For the Bisecting K-means algorithm, we applied the
basic K-means algorithm twice (α = 2 in Section
2) with a maximum of 8 iterations per split. Our implementation of Chameleon was unable to complete clustering S13403 in reasonable time due
to its time complexity.
Table 2 shows that K-means, Buckshot and Average-link have very similar performance. CBC outperforms all other algorithms on both data sets.
6.3. Manual Inspection
Let c be a cluster and wn(c) be the WordNet
class that has the largest intersection with c. The
precision of c is defined as:
Table 1. A description of the test sets in our experiments.
DATA SET
TOTAL WORDS
m Average # of Features
TOTAL CLASSES
S13403 13403 250 740.8 202
S3566 3566 3500 2218.3 150 Table 1. A description of the test sets in our experiments.
DATA SET
TOTAL WORDS
M Avg. Features per Word
TOTAL CLASSES
S13403 13403 250 740.8 202
S3566 3566 3500 2218.3 150
Table 2. Cluster quality (%) of several clustering algorithms on the test sets.
ALGORITHM S13403 S3566
CBC 60.95 65.82
K-means (K=250) 56.70 62.48
Buckshot 56.26 63.15
Bisecting K-means 43.44 61.10
Chameleon n/a 60.82
Average-link 56.26 62.62
Complete-link 49.80 60.29
( )
( )
c c wn c c precision = ∩
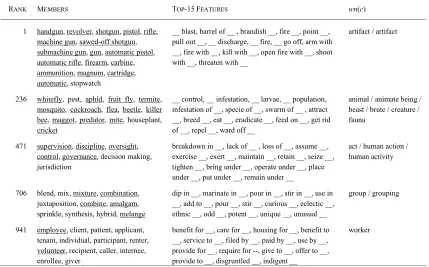
CBC discovered 943 clusters. We sorted them according to their precision. Table 3 shows five of the clusters evenly distributed according to their precision ranking along with their Top-15 features with highest mutual-information. The words in the clusters are listed in descending order of their similarity to the cluster centroid. For each cluster c, we also include wn(c). The
underlined words are in wn(c). The first cluster
is clearly a cluster of firearms and the second one is of pests. In WordNet, the word pest is
curiously only under the person hierarchy. The
words stopwatch and houseplant do not belong
to the clusters but they have low similarity to their cluster centroid. The third cluster represents some kind of control. In WordNet, the legal power sense of jurisdiction is not a
hyponym of social control as are supervision, oversight and governance. The fourth cluster is
about mixtures. The words blend and mix as the
event of mixing are present in WordNet but not as the result of mixing. The last cluster is about consumers. Here is the consumer class in
WordNet 1.5:
addict, alcoholic, big spender, buyer, client, concert-goer, consumer, customer, cutter, diner, drinker, drug addict, drug user, drunk, eater, feeder, fungi, head, heroin addict, home buyer, junkie, junky, lush, nonsmoker, patron, policy-holder, purchaser, reader, regular, shopper, smoker, spender, subscriber, sucker, taker, user, vegetarian, wearer
In our cluster, only the word client belongs to
WordNet’s consumer class. The cluster is ranked
very low because WordNet failed to consider words like patient, tenant and renter as
consumers.
Table 3 shows that even the lowest ranking CBC clusters are fairly coherent. The features associated with each cluster can be used to classify previously unseen words into one or more existing clusters.
Table 4 shows the clusters containing the word
cell that are discovered by various clustering
algorithms from S13403. The underlined words
represent the words that belong to the cell class
in WordNet. The CBC cluster corresponds almost exactly to WordNet’s cell class. K-means
and Buckshot produced fairly coherent clusters. The cluster constructed by Bisecting K-means is
obviously of inferior quality. This is consistent with the fact that Bisecting K-means has a much
lower score on S13403 compared to CBC, K
-means and Buckshot.
Table 3. Five of the 943 clusters discovered by CBC from S13403 along with their features with top-15 highest mutual
information and the WordNet classes that have the largest intersection with each cluster.
RANK MEMBERS TOP-15FEATURES wn(c)
1 handgun, revolver, shotgun, pistol, rifle, machine gun, sawed-off shotgun, submachine gun, gun, automatic pistol, automatic rifle, firearm, carbine, ammunition, magnum, cartridge, automatic, stopwatch
__ blast, barrel of __ , brandish __, fire __, point __, pull out __, __ discharge, __ fire, __ go off, arm with __, fire with __, kill with __, open fire with __, shoot with __, threaten with __
artifact / artifact
236 whitefly, pest, aphid, fruit fly, termite, mosquito, cockroach, flea, beetle, killer bee, maggot, predator, mite, houseplant, cricket
__ control, __ infestation, __ larvae, __ population, infestation of __, specie of __, swarm of __ , attract __, breed __, eat __, eradicate __, feed on __, get rid of __, repel __, ward off __
animal / animate being / beast / brute / creature / fauna
471 supervision, discipline, oversight, control, governance, decision making, jurisdiction
breakdown in __, lack of __ , loss of __, assume __, exercise __, exert __, maintain __, retain __, seize __, tighten __, bring under __, operate under __, place under __, put under __, remain under __
act / human action / human activity
706 blend, mix, mixture, combination, juxtaposition, combine, amalgam, sprinkle, synthesis, hybrid, melange
dip in __, marinate in __, pour in __, stir in __, use in __, add to __, pour __, stir __, curious __, eclectic __, ethnic __, odd __, potent __, unique __, unusual __
group / grouping
941 employee, client, patient, applicant, tenant, individual, participant, renter, volunteer, recipient, caller, internee, enrollee, giver
benefit for __, care for __, housing for __, benefit to __, service to __, filed by __, paid by __, use by __, provide for __, require for --, give to __, offer to __, provide to __, disgruntled __, indigent __
7 Conclusion
We presented a clustering algorithm, CBC, for automatically discovering concepts from text. It can handle a large number of elements, a large number of output clusters, and a large sparse feature space. It discovers clusters using well-scattered tight clusters called committees. In our experiments, we showed that CBC outperforms several well known hierarchical, partitional, and hybrid clustering algorithms in cluster quality. For example, in one experiment, CBC outperforms K-means by 4.25%.
By comparing the CBC clusters with WordNet classes, we not only find errors in CBC, but also oversights in WordNet.
Evaluating cluster quality has always been a difficult task. We presented a new evaluation methodology that is based on the editing distance between output clusters and classes extracted from WordNet (the answer key). Acknowledgements
The authors wish to thank the reviewers for their helpful comments. This research was partly supported by Natural Sciences and Engineering Research Council of Canada grant OGP121338 and scholarship PGSB207797.
References
Cutting, D. R.; Karger, D.; Pedersen, J.; and Tukey, J. W. 1992. Scatter/Gather: A cluster-based approach to browsing large document collections. In Proceedings of SIGIR-92. pp. 318–329. Copenhagen, Denmark.
Guha, S.; Rastogi, R.; and Kyuseok, S. 1999. ROCK: A robust clustering algorithm for categorical attributes. In Proceedings of ICDE’99. pp. 512–521. Sydney, Australia.
Jain, A. K.; Murty, M. N.; and Flynn, P. J. 1999. Data Clustering: A Review. ACM Computing Surveys 31(3):264–323.
Kaufmann, L. and Rousseeuw, P. J. 1987. Clustering by means of medoids. In Dodge, Y. (Ed.) Statistical Data Analysis based on the L1 Norm. pp. 405–416. Elsevier/North Holland, Amsterdam. Karypis, G.; Han, E.-H.; and Kumar, V. 1999. Chameleon: A
hierarchical clustering algorithm using dynamic modeling. IEEE Computer: Special Issue on Data Analysis and Mining 32(8):68–75. Landes, S.; Leacock, C.; and Tengi, R. I. 1998. Building Semantic
Concordances. In WordNet: An Electronic Lexical Database, edited by C. Fellbaum. pp. 199-216. MIT Press.
Leacock, C.; Chodorow, M.; and Miller; G. A. 1998. Using corpus statistics and WordNet relations for sense identification.
Computational Linguistics, 24(1):147-165.
Lee, L. and Pereira, F. 1999. Distributional similarity models: Clustering vs. nearest neighbors. In Proceedings of ACL-99. pp. 33-40. College Park, MD.
Lin, D. 1994. Principar - an Efficient, Broad-Coverage, Principle-Based Parser. In Proceedings of COLING-94. pp. 42-48. Kyoto, Japan.
Lin, D. 1998. Automatic retrieval and clustering of similar words. In
Proceedings of COLING/ACL-98. pp. 768-774. Montreal, Canada. Lin, D. and Pantel, P. 2001. Induction of semantic classes from natural
language text. In Proceedings of SIGKDD-01. pp. 317-322. San Francisco, CA.
Manning, C. D. and Schütze, H. 1999. Foundations of Statistical Natural Language Processing. MIT Press.
McQueen, J. 1967. Some methods for classification and analysis of multivariate observations. In Proceedings of 5th
Berkeley Symposium on Mathematics, Statistics and Probability, 1:281-298.
Miller, G. 1990. WordNet: An Online Lexical Database. International Journal of Lexicography, 1990.
Pasca, M. and Harabagiu, S. 2001. The informative role of WordNet in Open-Domain Question Answering. In Proceedings of NAACL-01 Workshop on WordNet and Other Lexical Resources. pp. 138-143.
Pittsburgh, PA.
Salton, G. and McGill, M. J. 1983. Introduction to Modern Information Retrieval. McGraw Hill.
Steinbach, M.; Karypis, G.; and Kumar, V. 2000. A comparison of document clustering techniques. Technical Report #00-034. Department of Computer Science and Engineering, University of Minnesota.s
Table 4. The clusters representing the cell concept for several clustering algorithms using S13403.
ALGORITHMS CLUSTERS THAT HAVE THE LARGEST INTERSECTION WITH THE WORDNET CELL CLASS.
CBC white blood cell, red blood cell, brain cell, cell, blood cell, cancer cell, nerve cell, embryo, neuron
K-means cadaver, meteorite, secretion, receptor, serum, handwriting, cancer cell, thyroid, body part, hemoglobin, red blood cell, nerve cell, urine, gene, chromosome, embryo, plasma, heart valve, saliva, ovary, white blood cell, intestine, lymph node, sperm, heart, colon, cell, blood, bowel, brain cell, central nervous system, spinal cord, blood cell, cornea, bladder, prostate, semen, brain, spleen, organ, nervous system, pancreas, tissue, marrow, liver, lung, marrow, kidney
Buckshot cadaver, vagina, meteorite, human body, secretion, lining, handwriting, cancer cell, womb, vein, bloodstream, body part, eyesight, polyp, coronary artery, thyroid, membrane, red blood cell, plasma, gene, gland, embryo, saliva, nerve cell, chromosome, skin, white blood cell, ovary, sperm, uterus, blood, intestine, heart, spinal cord, cell, bowel, colon, blood vessel, lymph node, brain cell, central nervous system, blood cell, semen, cornea, prostate, organ, brain, bladder, spleen, nervous system, tissue, pancreas, marrow, liver, lung, bone marrow, kidney
Bisecting K-means picket line, police academy, sphere of influence, bloodstream, trance, sandbox, downtown, mountain, camera, boutique, kitchen sink, kiln, embassy, cellblock, voting booth, drawer, cell, skylight, bookcase, cupboard, ballpark, roof, stadium, clubhouse, tub, bathtub, classroom, toilet, kitchen, bathroom,