I
IBM
. SALES
and
SYSTEMS GUIDE'
Use of Communication Facilities
in the Design and Implementation
of Tele-processing Systems
The information in this guide is, to the best of our knowledge, accurate • However, the common carrier information has not been reviewed with them. Therefore, the information herein should be used for planning purposes only and this should not be shown to customers.
Copies of this and other IBM publications can be obtained through IBM branch offices. Address comments concerning t.he contents of this publication to
TABLE OF CONTENTS
I. INTRODUCTION
II. DESIGNING A DATA COMMUNICATION NETWORK
A. Definition
B. Communication Facility Information
C. Data Required for Network Design D. Response Time of Multipoint Lines
E. Pick a Terminal
F. Switched Lines vs Leased Lines G. Switched System Design Procedure
H. Leased System Design Procedure
J.
V - H Coordinate SourcesK. Example of Manual Network Design
III. COMMUNICATIONS FACILITIES
A. Common Carriers
B. General Classifications of Communications Facilities
Communications Facilities Index
C. Communication Facilities Details
Table I - Leased (Dedicated) Interstate Facilities Table II - Leased (Dedicated) Groups of Interstate
Facilities
Table III - Switched Interstate Facilities Table IV - Status of Interstate Facilities
D. Interface Equipment for Communications Channels
IV. IBM COMMUNICATIONS CONFIGURATOR
V. LINE CONTROL SYSTEMS
Telegraph Line Control Sequences AT&T 8IDl Line Control System AT&T 83B2 Line Control System
Page
II-l II-l II-2 II-6 II-l5 II-l5 II-l6 II-l8 II-2l II-22
III-l III-2 1II-3 1II-6 III-lO
III-16 1II-20 III-35 III-36
V-2
V-4
V-6
( Continued)
VI. BIBLIOGRAPHY
TABLE OF CONTENTS ( Continued)
VII. SYSTEM IMPLEMENTATION
A. Switchover Methods for Communication Lines Served by Duplexed 7740's
B. Customer/Common Carrier/IBM Conference
Page
VII-2 VII-4
SECTION 1. INTRODUCTION
This guide presents, in Section II, a step-by-step approach to the design of a data communications network. Each alphabetic division of that section covers a major step -- most of these steps are used in anyone system design.
Various types of reference material are presented in the rest of the sections.
Because of the dynamic nature of some of the reference material in this guide, your Tele- Processing Representative or Industry Technical Assistance should be consulted before making customer commitments. Also, it is intended
to revise this guide from time to time. Normal channels of manual
announce-ment should be consulted periodically.
Critical responses from users of this guide are useful in improving its contents. Comments and criticisms will be appreciated.
SECTION II. DESIGNING A DATA COMMUNICATIONS NETWORK
A. Definition
A data communication network refers to a combination of communication channels used to move data between points geographically separate from each other. Such channels may take many forms and are described in , Section III, "Communications Facilities." A network of these channels can be as simple as two machines interconnected by a single channel, or as complex as a nation-wide system with several processing centers and many stations using leased and switched lines. Generally, the communi-cation network must be designed before a system proposal is submitted to a customer.
The more complex the network, the more difficult it is to determine the response time and even data handling capacity. This problem is two-sided because it is also difficult to design a network when given a large number of stations and specific throughput and response criteria.
This section covers the design of a network given a number of stations and throughput criteria. Whenever the data-moving requirements include remote locations and throughput and/ or response times, the network must be designed rather than just assumed. Design includes the choice of terminals, facilities, processors, and locations. It usually involves several iterations of these choices, separated by cost estimates and re-study of requirements. A procedure for design prior to customer proposal is spelled out in detail in the remaining headings of this section.
B. Communication Facility Information
These facilities are supplied by common carriers (by contract) and by vendors (for purchase). Several steps in network design require informa-tion about services, facilities and equipment. Since the network design is done prior to proposal and sale to the customer, IBM has set down specific rules for obtaining information about services, facilities and equipment directly from communication companies. These rules are stated in the Sales Manual on General page 7 "Planning for Teleprocessing." Briefly, it says that when you have to design a system for a specific customer, that customer makes the initial move in making contact with communications supplier. If the customer has a privately owned system this is no problem. If he intends to purchase a system, he must choose the vendor without our involvement, after which we can work directly with the vendor. If the customer wishes to use a common carrier, he has to choose betWeen a
telephone company or the telegraph company, for the domestic U. S. We may work with or without the carrier's representative, as explained below.
1. Working with the common carrier.
When the customer chooses a carrier, we are free to ask for meetings to obtain specific infornn tion about facilities to use in a system solution. This has one possible disadvantage-in some cases we may be alerting the carrier to provide a competitive bid.
2. Working without a common carrier.
When we would rather not work with a carrier's local representative, or when the customer makes no choice of carrier, we may develop a system independently.
To obtain specific information about communications facilities, services, availability, equipment, prices, etc., prior to the sale of a system, there are several published sources. This Guide, other publications listed in Section VI- Bibliography, and public file copies of tariffs at regulatory offices, are a few examples. IBM TP Reps, Education Centers, and Regional System Design Centers are additional
sources. Also, internal IBM channels have been set up to get speci~ic
information without risk of exciting competition or violating our business policy. District Offices and Regional Offices have Tele-processing Representatives who have contacts with data specialists in each common carrier serving their area.
For data contacts in the Bell System, lists of their specialists and advisors are distributed periodically to the above locations. Data contacts in other carriers are not as formally organized, thus the Region or District Office must develop them locally.
Whenever you have a need for general information about common carrier facilities, specific information for a customer who hasn't chosen a carrier, or specific information for a customer who is also being bid by a carrier, the above sources and channels are for you. In addition, Industry Technical Assistance can also help you in any of these areas.
C. Data Required for Network Design
There are many statistics and other data which can be helpful in network design. The following list is considered minimum. Each item is discussed to facilitate estimating it, if unknown.
1. Functions of the Remote Stations
The document requirements of the data to be handled will decide the type of equipment needed: cards require card punching/ reading, printed output requires keyboard and card or tape buffering, etc. Also, the characteristics of this data governs how the terminal will operate: for example, an inquiry terminal would have its keyboard
polled for inquiries and then its paper tape reader for batch transmission.
The mode of operation is also determined by the type of data. A full duplex line is only slightly more expensive than a half duplex line, but moving traffic both ways at the same time is not possible in all type of applications. Also, the terminal cost increases for full duplex.
The need for error detection and error correction can be decided from the contents of the data to be handled. If the messages contain ordinary words and are not processed by a computer, then error
checking probably is not needed. If coded or numeric data are included, or if processing will take place, checking usually is justified.
The speed of operation is not easily decided. Many low-speed terminals have only a narrow 'choice of speed. Generally, the higher the speed, the less the channel costs, per bit transmitted. Usually, the speed of remote stations is determined from an existing system or after the above criteria have reduced the applicable terminals to only or two. Of course, a station with an obvious requirement for high speed
(50-500 char./sec.) will probably require a particular machine just
to satisfy speed and document type.
If existing terminals are to be used, their operation must be clearly defined.
2. Traffic Statistics
Ideally, a peak period on a heavy day is determined and all messages moving in tile communications system are logged for each origination and destination by length and type. This information is then projected to the date in the future for which the system is to be designed.
Actually, the peak period must be carefully determined from sampling over a long period of time. Care must be taken to get a true peak based on origination frequency rather than on activity of existing channels. The peak period used for design must be a system peak, and is not necessarily one hour. The application will determine
an acceptable peak period length. When a system is to serve more than one time zone, traffic origination may follow a pattern according to local time. In designing for terminals in more than one time zone, design fir st for system peak and then check each line to make sure it can handle each terminals peak traffic. When actual traffic data is not available on a time basis, the peak period can be estimated. Typical systems have peak hour loads of 15-30 percent of an eight-hour day. If only origination locations are studied, an estimate of the effect of multi-address messages is required. Message length can be estimated. It can be in terms of a simple average, but a distribution of length vs. frequency is most useful.
Message type is needed only when different types are processed or routed differently, or a priority exists. When needed, the traffic data should be separated and shown for each origination point and destination by type.
A growth factor can be based on previous year's growth or customer's expected growth. Typical growth is 5-10 percent per year.
3. ChannelLoading
This is the ratio of time used for moving messages, to the time available. The closer this ratio is to 100%, the longer the average response time, which is the total time a message is in transit including all queues. It has been shown that for a contention, multi-point line, the average delay for a message waiting to transmit at a station is 2. 5 times its transmission time at 70% utilization; 4 times at 80% utiliza-tion; almost 6 times at 90% utilization. These figures assume
exponential service times, no order of picking the terminal which will send, and they do not include transmission time. Experience has shown that if specific response criteria (see below) are not known, 80% loading will provide a reasonable compromise between response and economy.
When definite response criteria are given, they are usually in the form of x% of messages delivered in y or less minutes. This includes all transmission and queue time. Care must be taken that these figures are realistic and apply to all the traffic handled in the peak period. Sometimes several sets of x and yare given such as 50%, 80%, and 95%. The system designer is advised not to ask the customer for such figures unless it is evident he understands the meaning.
A method of deriving loading and response time from each other is included under Response Time of Multipoint lines. For design data, only one is required.
4. Terminal Locations
Each geographical location must be defined. If more than one location should be within a city, each location should be shown separately. This list should include all locations to be served in the year for which the system is being designed.
5. Central Switching Locations
Ideally, the machine which will control communications among the terminals is located at the weighted center of the terminals. Actually, other considerations almost always dictate the location. If you are free to locate the machine, pick a city near the apparent geographic center of a map showing all locations, then move toward the more heavily loaded stations. It may be necessary to pick several different centers in order to find the most economical. A Communications Network Design Program (CNDP) will assist in the determination,
(See Bibliography). In picking a central switching location, keep in mind any need for communicating with other computers, a function which often is not apparent from studying only terminal locations.
Some systems can economically support decentralized switching. This is a matter of trial and error depending on the equipment cost and locations. A program is being developed to help on this problem (See Bibliography).
6. Present System Description
Many opportunities for initial IBM penetration have been the replace-ment of existing central switching equipreplace-ment by IBM equipreplace-ment, using existing lines and terminals. Even if such a "drop-in" replacement is not contemplated, a customer's existing system description will provide much of the above information and may well be a foundation for a new system design. Two important advantages may be:
a. By using existing terminals and/or present message formats, a minimum of remote confusion will result at changeover.
b. The present system may use communication lines which are more economical than those a new design might require, due to existing customer-owned channels or a Telpak.
7. Operating Periods
Some IBM equipment can be leased for less than full time. To take advantage of such rates, the required operating hours of each location served should be noted, with time zone.
8. Operating Constraints
The application of the data moved on the system will generally include burdens for the system design. Exceptional verification or error checking routines, direct communication and message switching, particular speed, inexperienced or part-time operators, unusual environment, non-IBM terminals which have been altered from "standard",etc., are a few of the items which have made system designs unique •
. D. Response Time of Multipoint Lines
The design of a multipoint network, as discussed later in Section III H, is often based on the line utilization or loading. The critical design para-meter may be the response time on a line, but this must somehow be converted to line utilization to enable us to manually design the network. This subsection presents a graphical method of finding the necessary line utilization, given the required response time or vice-versa. The graphs used are based on a simulation model for a message switching network. The graphs have been normalized to make them independent of line speeds and message lengths. The assumptions and parameters used in the
development of the model and use of the resultant curves is discussed below.
1. Assumption and Parameters for Half Duplex Malel
In establishing a network model, there were a number of parameters
or variables that could have been considered. It was necessary to
make the model as widely applicable and practical as possible.
a. Line Loading
All terminals on a line are assumed to be equally loaded. For an inbalance in terminal loadings a variation of the polling scheme to favor the heavily loaded terminals should make the curves developed applicable.
b. Polling Scheme
The terminals are polled sequentially with a maximum of one message being accepted per terminal in one pass through the polling list. Output messages are handled on a priority basis with a check for output being made after each input message and after each complete pass through the polling list. The output queue for the line is exhausted at each check point with the first message in the queue being transmitted first.
c. Number of Stations Per Line
Several runs were made for various length messages on lines with 2, 6, and 10 stations. It was found that the maximum
deviation from the 6 station curve was 10% within 2 to 10 stations. Therefore, only the 6 station curves are shown and they are considered valid for 2 - 10 stations.
d. Ratio of Input to Output
One of the important considerations in message switching systems is the ratio of the number of input messages to the number of output messages in the system. This ratio will be called RIO. Generally, RIO will be 1:1.1 or slightly more messages out than in. This 1: 1. 1 ratio is due to a small number of multiple address messages. The curves shown can be used for an RIO of from 1:.7 (less out than in), to 1:2, (twice as many out as in).
More output than input would tend to increase message response time, while less would have the opposite effect. There are two sets of curves. The first set, graphs 1 and 2, is to be used where the RIO falls in the range of 1: .7 to 1:1.4. The second
set of curves graphs 3 and 4 is to be. used where the RIO falls in the range of 1:1.4 to 1:2. These curves hold to within 10% for any RIO in these ranges.
e. Message Generation
Messages are created or are assumed to arrive "randomly" in time at each terminal, that is, follow what is termed a Poisson arrival distribution. The distribution of the message lengths
(discussed under Line Holding Time) is assumed to be exponential which may be considered a worst case condition. Constant mes-sage lengths would yield considerably better results at higher
line utilizations. The output messages are generated by the multiplexor and the model was run with the assumption that output messages will not be returned to the same line that initiated the input message. The use of the response curves is limited by the number of lines in a system. That is to say, the curves are more accurate for a 10 line system than for a 5 line system where a larger percentage of the messages might be sent back on the same line.
f. Line Holding Time (LHT)
For this model and the resultant curves, the message length is represented as the Line Holding Time or LHT. LHT is the total line holding time for the transmission of a message plus the single poll or selection time that caused that message to move. The LHT includes such fixed functions as End of Block, End of Message, line turn around time, etc., where applicable. The LHT may be expressed as character time units or in time units such as seconds. The LHT is thus independent of line speed and actual message length.
g. Line Control Time (LCT)
In this model as in most message switching systems, all that time not used by LHT is used for unsuccessful polls. LCT is thus the time taken for one unsuccessful poll. The critical factor in normalizing the results of this simulation was found to be the ratio of LCT : LHT. The time to poll for a "no" message response, poll a message or address a terminal is assumed to be 8 characters for this model. (The 8 characters is normal for polling and addressing in many message switching systems.)
It was found that in the RIO range of 1:.7 to 1:1.4, the curve for
a 100 character message, with an LCT: LHT ratio of 1:13.5, was significantly different from that for a 300 character message, LCT: LHT ratio of 1:38.5. Thus there are two curves for this RIO range. The upper curve in Graph 1 holds within 10% for LCT: LHT ratio of 1:10 to 1:15, and the other curve holds within 10% for LCT : LHT greater than 1: 15.
Where RIO is from 1:1.4 to 1:2 there is no significant difference due to change in the LCT: LHT ratio. Thus there is only one curve for this RIO range. The one curve is valid to 10% for any LCT: LHT ratio greater than 1:10.
h. Mean Response Time (MRT)
In this model we define round trip response time as the time from request-to-send to receipt of last character by addressee. This time includes queue time at terminal, transmission time into CPU, queue time at CPU, and transmission time out to addressee. Message handling or process time by CPU is
neglected as it is normally a fixed amount of time and is usually too small, in comparison to transmission time, to be of significance to the model.
The Mean Response Time is the statistical mean of the round trip response times.
2. Use of Curves
In order to use the curves for a system, the following parameters must first be determined:
a. Average message length
b. Polling time or length = LCT
c. RIO
d. LHT
There are three design parameters, maximum line utilization (U),
system response time (T), and the percentile of messages (P) that must meet the system response time. Knowing any two parameters, we can find the third by using the curves. Thus if in our system 90% of the messages must experience a round trip response of 5 minutes or less, then we have that P
=
90% and T=
5 minutes or 300 seconds. We can now use the curves to find the maximum line utilization, U.Conversely if the maximum line utilization is given, say 70%, we would like to know what kind of response time most of the messages in the system will experience. Knowing the response time we could then ascertain if the given line utilization will permit us to adequately service the system. For example, we may have been given U = 70%. We will have to pick a P, say 90%, and now we could find T, the response time for most of the messages.
There are two sets of graphs. The first set covers an RIO range of
1:.7 to 1:1.4 and the second set an RIO of 1:1.4 to 1:2.
The first graph of each set (1 and 3) express the relationship between
the utilization (U) and Yu, where Yu = : : • The second graph of
each set expresses the relationship of the percentile (P) to Yp where
Yp =
~T.
Thus if we were given a design criteria of 90% of themessages in 5 minutes or 300 seconds for a system where the
LHT = 20 seconds. By knowing the RIO' say 1:15, we can find U.
We have given
P = 90%
T = 300 seconds
LHT = 20 seconds
Yp is found by entering graph 4 (proper RIO range) at 90% and going
up to the curve and over to the Y axis. Yp = 2.3.
T
T
Yp
= - -
or MRT= -
=
MRT Yp
300
2. 3 seconds ~ 130.
We now know the MRT and have been given LHT. Therefore
MRT 130
Yu
=
LHT=
20
=
6. 5 Entering graph 3 at Yu=
6. 5 and readingover to the curve and down we find that U = 63.5%. Thus if each line
in the network was loaded to no more than 63. 5% of its total message
handling capability then 90% of the messages in the system would
experience a round trip response time of 5 minutes or less. Notice that to use the graphs we first had to make the units between T, the time, and LHT consistent.
As an exercise trace the alternate path where given a 70% utilization
and an LHT of 20 seconds and RIO of 1:15 we find that 90% of the
messages have a round trip response of
Answer is T = 6.1 minutes.
E. Pick A Terminal
Several of the data items in C above will help narrow the choice of a terminal. The simplest system will have the same basic terminal at all locations, but this is not necessary.
Familiarity with the IBM product line is assumed. For convenience, the IBM Teleprocessing machines are listed in the Configurator (Section IV). Also, refer to the Terminal Equipment Guide, (See Bibliography) which describes all IBM terminal devices.
There are many non-IBM terminals capable of operating with IBM central equipment. The most common is the line of telegraph equipment manu-factured by Teletype Corporation and these machines have punched tape, keyboard, and page printer capability, and can operate at 6, 7. 5 and 10 char. / sec., HDX or FDX. Often these terminals are used in various Line Control Systems described in Section V.
The choice of terminal, especially speed and code, is a prerequisite to the system design procedure which follows. The central equipment which will operate with these terminals is assumed to be an IBM 7740:1448, or
similar machine with communication line capability.
F. Switched Lines vs. Leased Lines
Once a terminal type has been chosen, the amount of time each terminal in the system will be actually moving data can be estimated. If the terminal is geographically separated from other locations, or if it will have very light usage, switched lines may be more economical that leased. However, all the cost factors for both types must be considered.
Switched lines are available from most common carriers on a nation-wide basis. There is Telex at 50 baud, TWX at up to 150 baud, and the Telephone System at up to 2, 000 baud. All are "public" (accessible to all subscribers), use some type of signalling to originate a call, are HDX (except the Telephone System under 200 baud), and all offer billing on a time - used basis -- varying in details. Also, the Telephone System offers Wide Area calling at various flat rates. A switched Broad Band service is offered by Western Union. All of these services are more fully explained and priced in Section III of this Guide. Terminals on switched lines may be used to communicate with other terminals in the same company or in other companies on the same switched system, but while doing so, they appear busy to an incoming call. A busy condition also may be created by the system itself when all trunks between two
points are busy. Switched terminals can "converse" with each other, but this is an inefficient method at keyboard speed.
Leased lines are available from most carriers on a nation-wide basis. The speeds and signal types available are described in Section III. All are available as HDX or FDX, and usually less cost for HDX. When
used with a central machine, such lines, and terminals on those lines, are under control or supervision of the central. The lines are always avail-able, but a terminal can communicate only with the machines on the line. Store and forward message switching/processing is implied in such a system of lines.
Most data communications networks should probably use some switched and some leased lines. As IBM machines become more capable of directly using switched lines, as they can leased lines, the systems designer is freer to choose from the entire offerings of communications facilities. The next two sub-sections provide current knowledge on designing the switched and leased portions of systems, respectively.
G. Switched System Design Procedure (The information specified in headings C and E above, is required.)
1. All Switched Terminals
When the traffic pattern (organization/destination patterns of all messages) is entirely point-to-point among many different points, with all locations lightly loaded, it may be economical to use Telex
or TWX for this traffic. The Telephone System can handle higher speed if there are large amounts of such traffic and the Wide Area billing arrangement also becomes attractive for this. This type of system, however, offers no central control of traffic and assumes no one major origination/destination point--hence, no "central" machine configuration for on-line processing. The design of such a system is generally quite approximate, with the number of terminals required at each location based on the peak period send-pIus-receive load, the HDX terminal speed, and the amount of control time to get a connection before moving data (see 3 below).
As an example, the system design for a TWX network might be to have the terminals call the CPU when a transmission is required. If this is the case then the network cost and number of TWX access lines could be found in the following manner. From the traffic statistics for each terminal, the number of calls per day per terminal could be obtained. This would require lmowing type of messages, message
length, transmission method, and other information discussed in C above. By knowing the location of each terminal, the distance to the CPU can be found by the V-H coordinate method. From the Usage Charge list in Section III, the cost per call per terminal can then be obtained. The total cost for calls per terminal can then be com-puted and the total cost found.
To then determine the number of TWX stations needed at the CPU such that a calling station will not get a busy signal when it calls, see
"IBM 1410 Telephone Inquiry Device Study" referenced in the Bibliography.
2. Some Switched Terminals
Since most data communication networks require some sort of central on-line processing, and leased lines are generally more economical for such traffic, switched terminals usually appear as only part of a communications network. They are used for one or more of these reasons:
a. To back-up other lines and/or machines for priority traffic.
b. Lightly used terminals too far from leased line terminals for an economical leased link.
c. Need to communicate directly with other terminals for conversa-tion or with terminals in other companies.
When a or b is the reason, the central equipment also needs access to the switched system, if the machine is capable. These access lines may only originate calls or may answer and originate. To take advantage of WATS flat rates, for example, the central usually does all originating. In this case, the number of access lines required at the the central is based on connect time, (see 3 below) peak period mes-sage load, average mesmes-sage length, and line speed. Additional short messages must be added to the load to account for calls originated to stations so that they can send, but they have nothing to send ("Non-Productive Polls").
If the central must answer and originate calls, the number of access lines (trunks) is based on the same factors above, except there are not any dead polls, but the queueing problems demand less efficient lines at the central. For example, if 95% of the incoming calls are to be delayed less than 0.2 times the constant length message transmission
time: 1 trunk can be 7% occupied, 2 trunks 24%, 3 trunks 35%, 4 trunks 42%, 6 trunks 52%, 12 trunks 68%, 20 trunks 78%, etc. These figures assume that a busy signal results in an immediate retry (which is not exactly true) and that delayed calls are answered in order (also not exactly true). A queueing formulation for deter-mining the number of lines needed has been developed and is discussed in "IBM 1410 Telephone Inquiry Service Study" referenced in the
Bibliography.
3. Control Times for Switched Lines
On TWX and the Telephone System, it takes about 25 seconds to
"dial" and connect and disconnect, plus about 5 seconds to handshake
and disconnect the data sets. Depending on the customer's require-ments, identification time may have to be added to this before data
starts moving. If "dialing" uses all touch tone equipment, about 15
seconds of "dialing" and connect time is saved.
On Telex, it takes about 24 seconds to "dial" by hand or machine and
get connected and disconnected. Identification time is additional, if
required.
Portions of the above control times may be chargeable time.
H. Leased System Design Procedure
The data specified in C and E above is required. A list of locations is
made with the peak period load itemized for each terminal. Then, one of the two methods outlined below is followed. When a solution is completed,
another combination of speed and terminal may be tried, if others are
valid. Also changes in traffic patterns, peak period, central locations, loading/response, etc., are ways of getting different solutions. A com-parison of all results will enable the designer to pick the one (or several) solution which best meets the customer's communications needs.
A map is necessary or desirable, depending on the method used. We have found that a large-scale map, showing as many location names as possible,
is very helpful. Two such U. S. maps are Cleartype, by American Map Co. ,
#783 and #7009. The former is 38 x 25, shows all cities over 5,000 popula-tion, and costs $2.00. The latter is 50 x 38, shows all cities over 2, 500 population, and costs $5.25. An index book is available for $3. 50. A
smaller and less expensive map is #732. Any map, showing all the places to be interconnected on one sheet, is satisfactory. For manual design, the scale must be quite accurate in all directions, such as on a "conformal conic" projection.
1. Manual Design (A map is required).
a. Plot each location on the map, along with its peak load. Also, plot the central location.
b. Determine the maximum load per line in the same units as
location loads. If response time criteria has been given, convert to a load figure using the method described in the sub-section on Response Time of Multipoint Lines.
c. If there are locations which exceed the maximum line load, split each location into a number of maximum load lines, with one terminal each, and one terminal for the remainder load. The full-line loads and terminals may be removed from the map and listed separately.
d. Beginning at a terminal farthest from the central, link terminals together by straight lines with these objectives:
1,,) Get as close to the maximum line load as possible (may be slightly over it), then connect to center and start a new line.
2.) Keep line mileage to a minimum by pointing the line towards the qentral with narrow lateral detours to pick up stations.
C
" Dashed Lines would be ' " longer alternatives
To Central
...
D B
EXAMPLE OF BRANCHING TO MINIMIZE LINE MILEAGE
3.) Any three adjacent stations to be linked are connected by the two shortest of the three possible sides of the defined triangle. This will occasionally result in branching. Branches may be any length and number of links and may repeatedly branch.
(step d results in assigning terminals to a multipoint line and connecting them together by a "minimum tree." This is the method used by common carriers to determine the mileage for which to charge, regardless of actual wire routes. )
e. When several lines in the same portion of the map have been completed, review them to try different combinations that will improve the objectives in step d, above. Terminals in, or very near to, the central location can be selectively put on any line to raise its load without increasing cost significantly. Try to avoid making connections which look like this:
x'
:---0: '
I I
~
as they generally may be designed for a lower line cost.
f. When a satisfactory group of lines has been drawn, the cost of the network can be estimated using the scaled mileage for each link and the method described in Section III.
g. Where a number of lines appea:r to be nearly parallel to each other, Telpak bundling may reduce the cost. Telpak (explained in
Section III) provides groups of channels between two points at a quantity rate. Leased line extensions from a Telpak group at any common carrier location to terminal locations are then used to rebuild the lines designed above. In order to effectively use Telpak, recombinations of stations are usually necessary.
h. The results of this design might be listed as follows:
1. Leased line miles (actual or equivalent)
2. Leased miles cost
3. Telpak cost
4. Number of lines
5. Number of stations
6. Number of loops 7 • Cost of loops
8. Number of chan terminals
9. Cost of station charges and chan terminals
10. Total cost of communications facilities
2. Multi-Point Linkage Program (MPL)
This is one of the Communications Network Design Programs (CNDP) which have been announced and will be made available as restricted
Type II programs. MPL performs on the 7090 and 7040 steps b, c, d, and f above. The multipoint lines are quite well optimized and the printout is collated by line. Input can specify loading and/or response time. Output includes loading and/or response time analysis of each line. The program is presently available for use through the Regional Systems Design Centers.
There is an SRL Bulletin (Z20-0310-0) available which describes the program operation in general. The programs are still considered under development.
J. V-H Coordinate Sources
Programmed methods of Network Design require the locations to be defined to the computer. One standard method is the V-H Coordinate system developed by AT&T. The primary source of this information is the tariff described in 1 below. Because of the expense of obtaining personal copies, additional sources are also listed which may be helpful.
1. FCC Tariff AT&T 255 - "List of Rate Centers and Central Offices for
the U. S., and Canada and Mexico".
This tariff contains two lists for each state. First, a list of V and H Coordinates for a list of Rate Centers in that state and the corresponding "toll center." A toll center does not concern us in leased line design, but is usually a large locality--perhaps more readily found on a map. Second, a list of central offices (numerical and alphabetic) with
corresponding rate centers. If a locality can not be found in the first
list, perhaps a telephone number will determine the rate center using the second list.
The V and H coordinates were obtained by superimposing a grid on a "Donald Elliptic" proj ection map of North America. The grid is tilted clockwise about 20° from a normal N-S, E-W grid. 0, 0 is in the far northeast corner. Using the trigonometric rules of a right triangle, the airline distance between any two points is defined as:
2 2
(VI - V
2) + (HI - H2)
10
miles for leased line considerations. (Thus, one coordinate unit is
a distance of the square root of O. 1 in miles). A different method is
used when measuring for toll purposes which usually does not concern us. This tariff was filed by AT&T only but nearly all domestic common carriers have concurred with it, and it includes all the rate centers for all the telephone companies.
Copies of this tariff may be obtained from Cooper Trent, a printing house in Washington, D. C., but charges are per page and very expensive. Within IBM, copies have been made available to the four regional design center managers and a copy is also available at Industry Technical Assistance.
2. Abstract - The Data Communications Handbook (see Bibliography)
has a list of around 1500 of the largest cities including their V and H coordinates.
K. Example of Manual Network Design
As an example of the method described in this guide for Manual Design of a Leased System, a small system connecting 11 cities to Jonesboro, Arkansas is designed. The fixed information obtained about the problem is listed below:
1. Cities and total message loads/peak hour (avg. 200 ch/msg input
and output):
Auburn, Washington 33.0
Long Beach, California 9.2
Glendale, California 67.5
Napa, California 9.2
Santa Rosa, California 31.7
Watsonville, California 35.3
Jackson, Wyoming 11.1
Magnolia, Arkansas (1) 29.5
Magnolia, Arkansas (2) 61.3
Galveston, Texas ' 45.6
Humble, Texas 37.6
Monroe, Louisiana 18.5
2. The network we wish to design is a full time, half duplex, 100 wpm,
leased telegraph line network with the following network parameters:
a. A ratio of input messages to output messages of 1:1.1
b. Control of 8 character times
c. Full control polling (one message per poll) of each station.
d. 90% of messages must be delivered in less than 7.5 minutes.
e. Terminals operate at 10 cps line speed.
3. From the parameters given, we find that the control time (or poll time or address time) is 8 character times. Thus LCT is 8 characters. Since the line speed is 10 cps, LCT could also be expressed as .8 seconds. LHT is the average message length + control time = 200 characters + 8 characters = 208 characters or 20.8 seconds. The ratio of LCT:LHT would be 8/208 or 1:26. The RIO is 1:1.1, which means we will be working with graphs #1 and #2. Because the LCT:LHT = 1:26, we will use the lower curve on graph #1.
In the parameters we have been given the percentile of messages P
=
90% and the response time T=
7.5 minutes or 450 seconds(7.5 x 60). We are thus looking for the line utilization U. Entering graph #2 at 90%, we find a Yu of 2.1. Since Yp =
~T
(from D. 2.),MRT 450 d 214 d Yu
=
MRT=
214 seconds=
10.3 = 2. 1 secon s = secon s. LHT 20.8 secondsEntering graph #1 with a Yu of 10.3 and using the lower curve, we find that U = 80.5% utilization. Thus the maximum line utilization for our system requirements is 8 O. 5%. One 100 wpm telegraph line is capable of transmitting 10 characters per second, 600 characters per minute or 3600 characters per hour. Since each message has an average of 208 characters (we must include control time), the line is
. 3600char/hr
capable of handhng 208 h / = 172 messages/hour maximum. c ar mes
To load the line to 80.5% utilization, we allow only 172 x .805 = 138 messages/hour on the line. The 138 messages/hour is thus our line loading factor. Notice that this is total messages/hour. The traffic rate from each city is also expressed at total number of messages
(both in and out)/hour. If the city traffic rate is expressed in other units, then the line loading factor must be in the same units.
4. By following the procedure outlined in Section H. 1, we manually construct a network. We see that Watsonville, Napa and Santa Rosa will all be connected on the same line. Since the distance from
Santa Rosa to Auburn is less than Watsonville to Glendale, we make the Santa Rosa - Auburn connection. From Auburn we go to Jackson
Line 1
Line 2
Line 3
and then the DPC. This line now has 120. 3 messages/hour which is nearly equal to the line loading factor. By similar analysis the rest of the network was configurated and the cost was then computed. The resultant network is shown below.
Distance in Equivalent
From To Load Miles Miles
Galveston Humble 45.6 49.5 49.5
Humble Magnolia (1) 37.6 247 247
Monroe Magnolia (1) 18.5 82.5 82.5
Magnolia (1) Jonesboro 29.5 225 225
Total 131.2
Long Beach Glendale 9.2 30 30
Glendale Magnolia (2) 67.5 1420 722
Magnolia (2) Jonesboro
- -
61.3 225 225Total 138.0
Watsonville Napa 35.3 82.5 82.5
Napa Santa Rose 9.2 22.5 22.5
Santa Rose Auburn 31.7 600 415
Auburn Jackson 33.0 610 419
Jackson Jonesboro 11.1 990 571
Total 120.3 3091
The total line cost for the system would be 3091 x 1.21 (from AT&T
Schedule 3 cost for 100 wpm telegraph) = $3,740. The local channel
costs are 15 x $6.70 or $100. The channel terminal charges are 15 x $12.50 or $187.50. Thus the total cost of the network is $4, 027 .50. A map of this solution is shown on the next page.
Auburn
Watsonville
Glendale
Long Beach
NETWORK CONFIGURATION
II-25
Jonesboro
Magnolia
Monroe
Humble Galveston
SECTION III. COMMUNICATIONS FACILITIES
This section covers common carriers, general description of communication facilities, details of available facilities, and a data set index.
Communications Facilities refers to all lines, channels, circuits, mod/demod, etc, required to move data between two or more geographically separated machines. The majority of customers prefer to obtain these from a common carrier, however privately owned systems are growing in popularity. This section includes information on those facilities available from the common
carriers for data transmission. Many private systems provide similar facilities. See the beginning of Section II for a discussion of IBM Marketing Policy with respect to recommending specific common carriers and vendors of private system equipment.
A. Common Carriers
I,. Who are they - There are basically two common carriers serving anyone point in the U. S. A. One is the Western Union Telegraph Company, the other is a telephone company. These two offer some similar facilities and some unique. The many telephone companies have divided up the country so that only one serves anyone spot. AT&T is the largest and consists of over 20 local operating companies interconnected by the facilities of AT&T Long Lines. General Tele-phone is the largest independent (non AT&T), consisting of over 30 local operating companies. About 2700 other independent companies, all quite small, make up the rest of the "telephone system ". Western Union is a single company covering the entire U. S.
2. . Tariffs - A tariff describes the service which a common carrier
provides to the public. It is the document used by regulating bodies to control the carriers, since every service must eventually be approved by the regulatory office. Common carriers offering inter-state facilities are regulated by the Federal Communications Com-mission. Those offering intrastate facilities are regulated by various state commissions. Many carriers operate at both levels and file tariffs at both levels.
For the purposes of obtaining tariff information about common carrier facilities, two assumptions can be made:
a. All telephone companies can offer a service or facility that AT&T offers.
b. Tariffs filed with the F. C. C. are representative of intrastate tariffs.
These assumptions are valid for estimating the cost of
geographically large communication systems. However, some telephone companies may have different availabilities and intra-state tq.riffs can be different.
3. Information Sources - Many sources are discussed at the beginning of Section II. Two IBM documents are the Data Communications Handbook and this Section III of this book.
The Data Communications Handbook contains: F. C. C. tariff abstracts, data set summary sheets, and descriptions of some common carrier systems.
This section III combines the rate information from the tariffs with technical information not found in tariffs to provide a reference source for system design using common carrier facilities. Tariff regula-tions, restricregula-tions, etc, are purposely omitted because they are in the Data Communications Handbook.
B. General Classifications of Communications Facilities
The index chart on the following page shows all of the common carrier facilities presently capable of attaching to IBM machines. It is arranged by bit speed to provide a quick reference to facility name, type and supplier. Each term used is explained in the following paragraphs. Details of each facility are covered in Tables whose use is explained in Section III C below.
1. Speed - The speed of a communications facility is basically how fast bits can be moved over that facility. A common dimension is bits per second, usually abbreviated bps or baud.
Speed (bps)
45 max.
50 max.
55 max.
75 max.
75 & 110 fixed 150 max.
180 max.
200 max.
200 max.
600 max. 600 max. 1200 max. 1200 max. 1200 max. 1800 max.
2000 fixed
2000 fixed
2400 fixed
2400 max.
40.8 K fixed
105 K fixed
500 K fixed
DATA COMMUNICATIONS FACILITIES INDEX (interstate, usable with IBM Machines) Terms are explained in Section III B of text.
L* Name of Facility HDX
S Telephone Co. WU FDX
L Sched. 1 Class A H/F
S --- Telex H
L Sched. 2 Class B H/F
L Sched. 3 Class C H/F
S TWX
---
HS BMTWX
---
F**L --- Class D H/F
S Telephone --- F**
L Sched. 4
---
F**L
---
Class E H/FS --- Broadband Ex. F
S Telephone
---
HS
---
Broadband Ex. FL --- Class E H/F
L Sched. 4 --- H
(cond. required above 1000)
S Telephone --- H/F
L
[SChed' 4
ClassE
}{
H/F(additional conditioning may change the type of service
L designation) H/F
S --- Broadband Ex. F
L Telpak A2 Telpak A2 F
L Telpak C2 Telpak C2 F
L TEipak D1 Telpak D1 F
Data Set none auto-dial none none incl. incl. 8500 103A 103F*** 1601A*** 1601A 202C 2121A 8501*** 202D*** 201A 201A*** 201B*** 2241A
301 B
special
special
* All facilities designated L may be combined in certain ways into Telpak groups (table 2).
**FDX on HDX line (see text)
***Customer (or IBM) may provide a data set in lieu of the carrier's set shown.
As used in the index, maximum means the highest bit speed permitted or possible, fixed means the facility operates at that particular bit speed. These limitations may be the result of using the data set shown.
The maximum bit speed of a particular communication facility is a function of many interacting technical factors, such as: physical length, physical composition, DC or AC signal, type of modulation, state of the art. Past attempts to directly relate bit speed to frequency bandwidth are being proved inadequate today. For our purposes in designing systems for customers, the primary concern is what speed can be obtained using any particular facility.
To choose the facility required for a particular machine, it is
necessary to know the maximum bit speed the machine will use. This may be higher than the average bit speed (char/sec times bits/char on the line) because many serial machines use pauses between characters on the line. The configurator for IBM machines in Section IV shows maximum speed in bps and average data rate in characters per second. Throughput will be affected by several factors, primarily turnaround time. Some data sets require 200 ms to change direction. Machines also may use line time to process or make decisions.
Thus speed must be measured in three ways:
a. Maximum bits/sec to determine needed facilities,
b. Data rate in characters per time unit to allow for inter-character line time,
c. Throughput in transactions per time unit to allow for turnaround.
2. Leased/Switched - this refers to whether or not the facilities are dedicated to the user's machine. As used in this index and the tables which follow, leased means any facility which is contracted for and permanently connected to specific machines. A typical example is a multipoint line linking three 1050's in Washington, New York, and White Plains. The line is always available for use by one of those terminals.
Switched means any facility which uses a publicly accessible switched network. Access lines are permanently connected to specific machines, but such lines are not permanently connected to each other. A typical example is three 1050!s in Washington, New York, and White Plains, each attached to the public telephone system. Connection between any two requires placing a call, obtaining an idle network path, determining that the called station is idle and paying some form of charge for the time.
Many leased facilities can be combined into a private, switched system which then take on the characteristics of a switched system. An example of this would be three 1050's located in IBM offices in FRO, ERO, and DPHQ, each attached to the IBM telephone system. This system consists entirely of leased lines but is combined to look and act like a switched system. Prospective customers may have such systems already, or may find one justified as part of our proposal.
3. Name of Facility - Each facility is briefly described in the tables
in Section III C.
4. HDX/FDX - The mode of transmission describes how data moves on
the communications facility.
a. Simplex - transmission in one direction only.
b. Single or Half Duplex (HDX) - transmission in both directions
but only one direction at a time.
c. Duplex or Full Duplex (FDX) - capable of simultaneous trans-.
mission in both directions.
These terms are used in two ways: to describe the technical limitation on use caused by the physical characteristics of the facility, and to describe the way in which the facility is used caused by the machines or application. Thus a facility may be capable of FDX
but due to a machine limitation it is only used HDX. The index show s
the technical limitation. H/F means the facility can be ordered with a technical limitation of either HDX or FDX - the FDX usually costs
10% more per montho
There is one case where these terms get confused. The facility used
in the public telephone system is technically HDX because it is designed
to handle voice in one direction at a time. This is also true of a
leased voice grade facility (schedule 4 or class E). Both switched
and leased voice facilities can often handle voice in a FDX mode. Also, both types can always handle data in a FDX mode on a HDX facility when a 100 series data set is used on telephone company facilities.
Any facilities technically capable of a particular mode can be used in that or a simpler mode (except for the case noted above). There are no facilities technically limited to Simplex use.
Two other technical descriptions of transmission mode commonly encountered are:
a. Two-wire: transmission in opposite directions are carried on the same line.
b. Four-wire: transmission in opposite directions are carried over separate lines. Each line is effectively a simplex line.
5. Data Set - This is the major consideration in the general problem of defining the interface - which is how a communication facility is connected to, and controlled by, a machine. The three-digit numbers are AT&T units, the four-digit numbers are WU. See the tables for a fuller description of particular interfaces. Where "none" appears in the index, the facility has a dc serial interface direct to the machine.
C. Communication Facilities Details
1. Organization - All interstate facilities available for data use from the common carriers have been detailed in three tables: 1. Leased Single Facilities, 2. Leased Groups of Facilities, 3. Switched Facilities. In addition, table 4 shows the present status of these facilities. Within each table the different facilities are arranged by maximum bit speed. Each facility is identified by name, tariff from which derived, and a brief description. A chart of rates, interface description and notes on usage follows. Regulations and restrictions are fully covered in the Data Communications Handbook tariff abstracts.
The information in these tables was obtained fron1 tariffs and authori-tative sources within the common carriers. The prices herein are accurate enough for estimating purposes; page 7 of the general section of the Sales Manual should be consulted before supplying any com-munications cost information to customers. Installation charges have been ignored.
2. Definitions - the following terms are used in these tables:
Service Point - A location (city/exchange) where one or more stations are located.
Exchange/ City - When leasing from phone companies, the term is exchange; when leasing from WU, the term is city. In all smaller cities, it may be assumed that, for pricing, the entire city is one exchange. Larger cities are broken up by both carriers into exchange areas or zones. In general, it is not necessary to know what part of a zoned city the station is in unless a leased line segment serving the station is less than 40 miles long, or unless it is a switched system station.
Station - An equipment location. This can include all equipment in one building on the same line, but usually not in separate buildings. Extra equipment in the same building is connected as an extension. These rates are lower than local channels and can be found in the tariff abstracts.
Channel Terminal - In Telegraph, Class D, and Voice Grade facilities, a device required at each service point to connect all stations there to one line. In Telpak, a device required at each station.
Local Channel or Loop - Required to connect each station to its channel terminal (except in Telpak).
Press Customers - An exception in the present tariffs requires this definition. It includes newspapers, broadcasting,magazines, etc. See the tariff abstract for a more detailed definition.
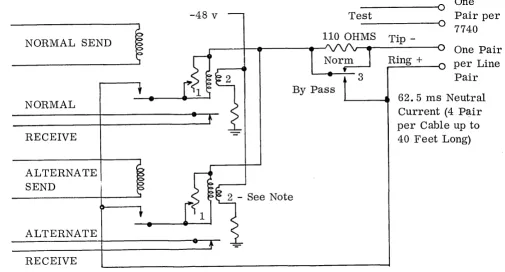
Interface - This describes the physical connection between an IBM
machine and the facility. The type of signal on the facility, modi demod, and type of signal to the machine is shown. See Section V for more information on how to control a multipoint line (logical interface).
Interstate/Intrastate - For leased line purposes, a line is interstate if any segment of it crosses a state line. An intrastate line has all of its segments wholly within one state. A system of lines connected to a single machine (but not interconnected to each other) can have some interstate lines and some intrastate lines.
For switched systems the destination is less important. Essentially, a call placed to a point within the state is covered by intrastate
tariffs, a call placed to a point in another state is interstate.
Except where noted, all information in these tables is interstate. These can be used as a rough estimate for intrastate.
Full Time - Leased facility contracted for 24 hours/day for the period of contract, usually one month minimum.
3. Cost Estimation - Communications Facilities are priced on a monthly basis. The areas of cost are:
a. To attach a machine to a facility
b. To have a facility access at a service point
c. To provide the facility between various service points.
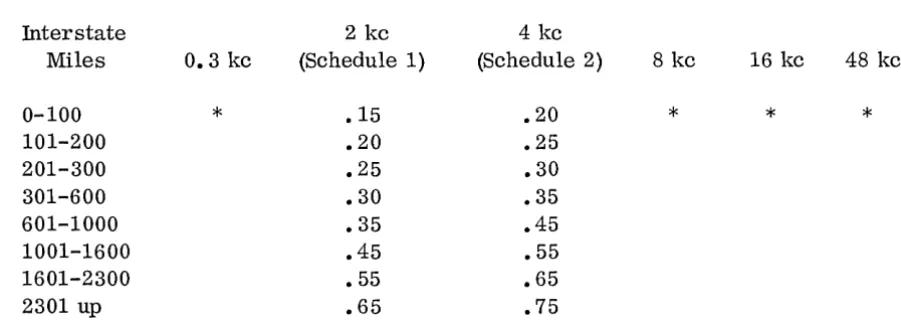
When leased lines (Table 1) are used to connect several points on one line, a "minimum tree" of straight lines is designed (see Section II H) to compute the line cost. Each segment or leg of such a tree is priced according to the rates in the table, starting at 0 miles in each segment. This "minimum tree" has no relation to the way the line is installed. Cumulative figures are shown in the tables for specific portions of each segment. To compute the cost of a segment, take the largest cumulative total mileage within the segment, then multiply the balance by the next per-mile rate. For example, a 600 mile (between two service points), 75 bps HDX leased facility would cost $453.50 (for 500) plus 100 x .484, for a total of $501. 90. Two channel terminals are required ($27.50) for facility access at the two service points and one local channel ($7.37) is required to attach each machine on the line.
Another way to compute the cost of a leased facility between service points is to use equivalent miles. The actual straight line mileage is converted to equivalent miles using the percentages in the rate charts. Then the equivalent miles are multiplied by the rate for the first mile. This method is useful for multi-line, multi-point systenls where each segment is converted to equivalent miles and all segments are totaled before multiplying by the rate for a first mile. For example, the 600 mile segment above is 250 x 100%
+
250 x 50%+
100 x 40% = 415 equivalent miles. An example of pricing a leased system is shown at the end of Section II.When leased groups (Table 2) or switched (Table 3) facilities are used there is no separate charge for facility access at a service point and the cost between service points becomes a toll charge for time and distance used. For exarnple, two basic telex stations 600
miles apart which converse for 30 hours a month would use 21,600
pulses. If all of these calls originate from one station the toll charge
is 3500 x $.025 + 18,100 x $.015 = $359.00. Two service charges
are incurred ($70.00) for the machines attached to the system.
TABLE I
LEASED (DEDICATED) INTERSTATE FACILITIES
45, 55, 75 bps (Telegraph, 60, 75, 100 wpm) (AT&T Schedules 1, 2, 3 Tariffs 208 and 237) (WU Classes A, B, C, Tariff 237)
Miles
1-250 251-500
Description - Obtainable as service (with mostly telegraph terminals), or as channel - rates shown below are the same. Character regenerating devices are usually required on multi-point channels or where a channel has long segments of DC signalling. In cases where much of the channel is actually derived from non-DC facilities, regeneration may not be required. When regeneration is required, the device must match both the bit length of the characters being transmitted and the speed of the bits within each character. The standard character length is 7.42 bits/
character and the standard speed is that shown on the rate tables below. WU will make available, on request, 9 bit/character regenerating devices. Circuits may be multipoint or point-to-point.
Rates - 45 and 55 bps, full-time for one month. (Except "press customers")
HDX (2 wire) FDX (4 wire)
Equiv Per Per
%
Mile Total Cum Mile Total Cum.100 $1.100 $275.00 $1.210 $302.50
50 0.550 137.50 $412.50 0.605 151.00 $453.50
501-1000 40 0.440 220.00 632.50 0.484 242.00 695.50
1001-over 35 0.385 0.424
Each Channel Terminal (1 per service pt. )
$12.50 $13.75
Each Local Channel (1 per station) $ 6.70 $13.40
Rates - 75 bps, full-time for one month. (Except "press customers")
1-250 100 $1.210 $302.50 $1.331 $332.75
251-500 50 0.605 151.00 $453.50 0.661 166.10 $498.85
501-1000 40 0.484 242.00 695.50 0.532 266.20 765.05
1001-over 35 0.424 0.466
Each Channel Terminal (1 per service pt. ) $13.75 $15.13
Each Local Channel (1 per station) $ 7.37 $14.74
[image:40.612.74.550.322.638.2]TABLE I (cont'd)
LEASED (DEDICATED) INTERSTATE FACILITIES
Interface - Telephone Companies - DC, two wire neutral loop, direct connection. 60 rna (±2.5 rna) current supplied from central office with the "tip" wire negative to ground and "ring" wire positive to ground.
Current ON = Mark or 1, current OFF = Space or O. DC resistance of
attached machine should be approximately 130 ohms. Open circuit voltage may reach 260 volts; 130 volts from each wire to ground. For FDX, two such loops are required.
Western Union - DC, four wire polar loop, direct connection. Two wires for receive, two for send, one wire of each pair is ground. 35 rna current supplied from central office on receive, current generator required at station to send.
Western Union will include no-cost converters on request, which
provide an interface equivalent to the Telephone Companies I
described above.
Notes on Usage - These facilities are usually used as a service, with telegraph terminals at remote points and a computer as a master station. Some line control system (see section V of this guide) is used when the
lines are multi-point. The carrier must decide if a customer qualifies
as "press", and then uses different rates. The press rates are actually the rates in effect for all users prior to October 1, 1964, and may be found in the Data Communications Handbook.
The regenerating devices only present a problem when non-telegraph terminals are used, such as IBM 1050. Only the carrier can determine if regenerating devices are needed on a particular facility; therefore, this facility must be considered available from telephone and Western Union even for non-telegraph use. When regenerators are not used, the speed shown in bps is a maximum.
TABLE I (cont'd)
LEASED (DEDICATED) INTERSTATE FACILITIES
180 bps (WU Class D, Tariff 237)
Miles
1-250 251-500 501-over
Description - Basically sub-bands of carrier channels on Western Union's own intercity facilities. No regeneration, no line code restriction, speed shown is a maximum. Circuits may be multipoint or point-to-point.
Rates - full-time for one month
HDX Use FDX Use
Equiv Per Per
%
Mile Total Cum. Mile Total Cum.100 $1.500 $375.00 $1.650 $412.50
85 1.275 318.50 $693.50 1.430 350.35 $762.85
80 1.200 1.320
Each Channel Terminal (l per service pt. ) $ 12.50 $ 13.75
Each Local Channel (1 per station) $ 8.25
Interface - DC, four wire to a WU Data Loop Transceiver. RS232A standard interface from DLT to the BM. One DLT required per
$ 16.50
station whether HDX or FDX $ 30. 00
Notes on Usage - Originally developed for IBM Transceiver, WU cannot offer these channels where they don't have their own facilities. However, they will consider implementing any proposed network and this facility must be assumed available anywhere.
2400 bps (Voice Grade) (AT&T Schedules 4, 4A, 4B, 4C, Tariffs 135 and 237) (WU Class E, E conditioned ,F, Tariffs 237)
Description - Basically lines capable of communicating a voice conversa-tion. When used for data, modulation - demodulation device converts the
data to voice type signals. The design of this modem dictates the speed
of data transmission. 2400 bps is the technical maximum presently avai-able. See interface for more detail.
[image:42.613.62.546.219.358.2]Miles
1-250 251-500 501-over
TABLE I (cont'd)
LEASED (DEDICATED) INTERSTATE FACILITIES
Facility is available as a service (with handsets and/or data sets for voice and/or data) or as a channel, (customer provides modems). No regeneration, no line code restriction, circuit may be point-to-point or multipoint.
Rates - full time for one month. (Basic Schedule 4, Class E, and Class F)
HDX (2 wire) FDX (4 wire)
Equiv Per Per
%
Mile Total Cum. Mile Total Cum.100 $2.020 $505.00 $2,222 $555.50
85 1.717 429.50 $934.40 1.889 472.45 $1027.95
80 1.616 1.778
Each Channel Terminal (1 per service pt. ) $ 12.50 $ 13.75
Each Local Channel (1 per station) AT&T WU
Alternate Use Charge
$ 12.50 $ 10.00
Telephone & Data Set - None Telephone & Data Set requiring Automatic Echo Suppression
$ 17.50
$ 18.25
Cutoff $ 15. 00
Channel Conditioning - May be required, at speeds and configurations shown, to reduce distortion which is a cause of errors. AT&T refers to Grades A
(min.) to C (max.), WU conditions Class E or specifies Class F channels. The need for such conditioning is on