ABSTRACT
LOZIUK, PHILIP LAWRENCE. Development of MS-based Methodologies for Discovery, Quantitative Proteomics, Post-Translational Modification Profiling and TransOMIC Pathway Approaches in Complex Biological Systems (Under the direction of Dr. David C. Muddiman).
Aided by the increasingly greater amounts of qualitative and quantitative information that can be obtained from a systems biology approach, the new age of OMICs data has demonstrated the ability to solve complex biological problems. The field of mass spectrometry based proteomics and metabolomics has provided many solutions to the intricate biochemistry posed by biology. From sample preparation to instrumentation, from the fundamentals to applications, these areas have been driven by the necessity to provide speed, sensitivity, specificity and high-thoughput, quantitative chemical information. The work described here focuses on utilizing new technology to develop mass spectrometry based workflows for quantitatively characterizing proteins and metabolites in the monolignol and cellulose/hemicellulose biosynthetic pathway.
inherent experimental variability was used to establish thresholds and successfully improve the processing of large quantitative data sets.
The development and understanding of these fundamental steps in MS-based proteomic workflows led to further biological insights as they were applied to the systems study of lignin and cellulose/hemicellulose biosynthesis. In applying this knowledge, transcription factors regulating lignocellulose biosynthesis were characterized at the protein level for the first time. These findings were further utilized to develop a quantitative assay for 14 enzymes involved in cellulose biosynthesis. This represented the first quantitative measurements for proteins involved in cellulose biosynthesis.
Novel MS-based approaches were also developed for studying post translational modifications and gain further insight into mechanisms regulating lignin biosynthesis. Phosphopeptide enrichment strategies were implemented to profile the phopshoproteome of the model woody plant
complex nature of glycans and glycoproteins. Newly developed technology from our research group was implemented to elucidate glycosylation sites and glycans within the P. trichocarpa proteome and more specifically, the monolignol pathway. Many of these represent the first insights into glycosylation and its possible role in regulating lignin biosynthesis. These findings present a foundation of knowledge which will provide the ability to advance our depth of understanding of lignocellulose biosynthesis, plant proteomics and the field of mass spectrometry.
© Copyright 2016 by Philip Lawrence Loziuk
Development of MS-based Methodologies for Discovery, Quantitative Proteomics, Post-Translational Modification Profiling and TransOMIC
Pathway Approaches in Complex Biological Systems
by
Philip Lawrence Loziuk
A dissertation submitted to the Graduate Faculty of North Carolina State University
in partial fulfillment of the requirements for the degree of
Doctor of Philosophy
Chemistry
Raleigh, North Carolina
2016
APPROVED BY:
________________________________ _________________________________
David C. Muddiman Edmond F. Bowden
Chemistry Chemistry
Committee Chair
_________________________________ _________________________________ Reza Ghiladi Vincent L. Chiang
DEDICATION
To my grandparents, Veronica and Lawrence Loziuk, married 72 years. You
BIOGRAPHY
ACKNOWLEDGMENTS
TABLE OF CONTENTS
LIST OF TABLES ………... .... xvi
LIST OF FIGURES ……… .... xix
LIST OF PUBLICATIONS .……….. . xxvi
LIST OF PRESENTATIONS ………... xxviii
CHAPTER 1 ... 1
Mass Spectrometry-based Measurements and OMICs Technologies: An Introduction ... 1
1.1 Biological Mass Spectrometry... 1
1.1.1 Preface ... 1
1.1.2 Quadrupole Mass Analyzer and Selective Reaction Monitoring (SRM) . 1 1.1.3 Quadrupole Orbitrap High Field Mass Spectrometer, Data Dependent Acquisition (DDA) and Targeted Selected Ion Monitoring (TSIM) DDA .... 5
1.2 Reverse-Phase Ultra High Performance Liquid Chromatography (RP-UPLC) ... 8
1.3 Electrospray Ionization ... 9
1.3.1 Description & Mechanism ... 9
1.3.2 Hydrophobic Bias & Derivatization ... 11
1.4 Bottom-up Proteomic Workflows ... 12
1.4.1 Bottom-up Proteomics, Filter-Aided Sample Preparation, Anion Exchange StageTip Fractionation and Bioinformatics ... 12
1.5 Post translational modifications ... 19
1.5.1 Accurate Identification of Deamidated Peptides for Glycosylation Site Profiling ... 20
1.5.2 N-linked Glycosylation in Plants ... 22
1.5.3 FANGS-INLIGHT: A Methodology for Glycan Derivitization and Identification ... 24
1.6 Immobilzed Metal Affinity Chromatography (IMAC) for Phosphopeptide Enrichment and LC-MS/MS ... 27
1.7 Absolute Quantification ... 28
1.7.1 Protein Cleavage - Isotope Dilution Mass Spectrometry ... 28
1.7.2 Proteolysis and Peptide Decay ... 30
1.7.3 Design of Experiments ... 34
1.7.4 Relative Abundance and Thresholds for Confirming Transition Purity using PC-IDMS ... 35
1.8 Synopsis of Completed Research ... 37
1.9 References ... 42
CHAPTER 2 ... 52
Understanding the Role of Proteolytic Digestion on Discovery and Targeted Proteomic Measurements Using Liquid Chromatography Tandem Mass Spectrometry and Design of Experiments ... 52
2.1 Introduction ... 52
2.2 Experimental ... 56
2.2.2 Stem differentiating xylem tissue (SDX) protein and filter-aided sample
preparation ... 56
2.2.3 Full Factorial Design of Experiments ... 57
2.2.4 Stable Isotope-labeled Peptide Standards and Transition Characterization... 59
2.2.5 LC-MS/MS Analysis ... 62
2.2.6 Bioinformatics, Global and Targeted Data Analysis ... 63
2.3 Results and Discussion ... 64
2.3.1 Proteolysis and Global Proteomic Measurements... 64
2.3.2 Proteolysis and Targeted Proteomic Measurements ... 69
2.3.3 Time course studies, quantifying chymotryptic activity and assessing quantitative accuracy ... 74
2.4 Conclusion ... 77
2.5 References ... 78
CHAPTER 3 ... 82
Establishing Ion Ratio Thresholds Based on Absolute Peak Area for Absolute Protein Quantification using Protein Cleavage Isotope Dilution Mass Spectrometry ... 82
3.1 Introduction ... 82
3.2 Experimental ... 85
3.2.1 Materials ... 85
3.2.3 Stable Isotope-labeled Peptide Standards and Transition
Characterization... 86
3.2.4 LC-MS/MS Analysis ... 87
3.2.5 Defining Relative Abundance ... 89
3.3 Results and Discussion ... 91
3.3.1 Examining the Dynamic of Relative Abundance over Time... 91
3.3.2 Relative Abundance and Absolute Abundance... 98
3.3.3 Implementation of Relative Abundance Thresholds for Absolute Quantification Experiments ... 103
3.4 Conclusion ... 107
3.5 References ... 109
CHAPTER 4 ... 113
A Cell Wall-bound Anionic Peroxidase, PtrPO21, is Involved in Lignin Polymerization in Populus trichocarpa ... 113
4.1 Introduction ... 113
4.2 Results ... 116
4.2.1 Identification of class III peroxidases in the genome of P. trichocarpa ... 116
4.2.2 PtrPO21 is a Xylem-Abundant and Xylem-Specific Class III Peroxidase in P. trichocarpa ... 117
4.2.4 PtrPO21 is an Unusual Anionic Peroxidase in the Stem Differentiating
Xylem (SDX) ... 121
4.2.5 PtrPO21 is a Cell Wall-Bound Peroxidase ... 124
4.2.6 PtrPO21 Downregulated Transgenics in P. trichocarpa Have Reduced Growth and Reddish Internodes in the Stem Wood ... 125
4.2.7 Cell Wall Component Analysis of PtrPO21 Downregulated Transgenics ... 129
4.2.8 Mechanical Properties of the Wood of PtrPO21 Downregulated Transgenics... 130
4.2.9 Lignin Composition of PtrPO21 Downregulated Transgenics... 131
4.2.10 Differentially Expressed Genes (DEGs) in the PtrPO21 Downregulated Transgenics... 133
4.3 Discussion ... 136
4.3.1 Class III Peroxidases Involved in Lignification ... 136
4.3.2 PtrPO21 Possesses Structural Motifs Similar to G- and S-Specific Peroxidases ... 137
4.3.3 Reddish Internodes of Stems in PtrPO21 Downregulated Transgenics ... 138
4.3.4 The Role of Peroxidases and Laccases in Lignin Polymerization ... 139
4.4 Materials and Methods ... 140
4.4.1 Plant Materials ... 140
4.4.2 Identification of Class III Peroxidases in P. trichocarpa and Phylogenetic Analysis ... 140
4.4.4 Transcriptome (RNA-seq) and Differentially Expressed Gene (DEG)
Analysis ... 141
4.4.5 Absolute Quantification of PtrPO21 from Cell Fractionation Using Protein Cleavage-Isotope Dilution Mass Spectrometry (PC-IDMS) ... 142
4.4.6 RNA-Interference (RNAi) Plasmid Constructions and Plant Transformation ... 143
4.4.7 Real-Time PCR (RT-PCR) ... 144
4.4.8 Lignin Content and Carbohydrate Determination ... 144
4.4.9 Nitrobenzene Oxidation for Lignin Composition... 145
4.4.10 Mechanical Properties of Wood ... 145
4.5 References ... 146
CHAPTER 5 ... 164
Elucidation of Xylem Specific Transcription Factors and Absolute Quantification of Enzymes Regulating Cellulose Biosynthesis in Populus trichocarpa ... 164
5.1 Introduction ... 164
5.2 Experimental Section ... 168
5.2.1 Materials ... 168
5.2.2 Nuclear Protein Isolation from Stem differentiating xylem (SDX) ... 168
5.2.3 Filter-aided Sample Preparation (FASP) and Stage-tip Fractionation ... 169
5.2.4 Sample Preparation for Targeted Analysis ... 171
5.2.6 LC-MS/MS Analysis ... 172
5.2.7 Bioinformatics, Global and Targeted Data Analysis ... 174
5.3 Results and Discussion ... 175
5.3.1 Shotgun Proteomic Analysis of Nuclear Stem Differentiating Xylem 175 5.3.2 Label Free Quantification of Cellulosic Proteins and Associated Transcription Factors ... 181
5.3.3 Absolute Quantification of Cellulosic Proteins ... 183
5.4 Conclusions ... 189
5.5 References ... 190
CHAPTER 6 ... 198
Phosphorylation is an on/off switch for 5-hydroxyconiferaldehyde O-methyltransferase activity in poplar monolignol biosynthesis .... 198
6.1 Introduction ... 198
6.2 Results ... 201
6.2.1 Liquid Chromatography–Tandem Mass Spectrometry Phosphoproteomic Analysis Revealed PtrAldOMT2 Monophosphorylation at Ser123 or Ser125 In vivo. ... 201
6.2.2 PtrAldOMT2 Is a Homodimeric Cytosolic Enzyme Expressed More Abundantly in Fiber Cells than in Vessel Cells of P. trichocarpa SDX. 203 6.2.3 P. trichocarpa SDX Contains Necessary Kinases for Monophosphorylation of PtrAldOMT2. ... 206
6.2.5 Phosphorylation Inhibits Endogenous PtrAldOMT2 Activity in P.
trichocarpa SDX Protein Extracts. ... 210
6.2.6 Site-Directed Mutagenesis at Ser123 and Ser125 Verified PtrAldOMT2 Phosphorylation Sites and Their Functional Significance. ... 212
6.2.7 The Ser123 Phosphorylation Site Is Highly Conserved in AldOMTs from Diverse Plant Species. ... 213
6.3 Discussion ... 214
6.4 Materials and Methods ... 217
6.5 References ... 218
CHAPTER 7 ... 223
N-linked Glycosylation Profiling in the Monolignol Biosynthetic Pathway of Populus trichocarpa ... 223
7.1 Introduction ... 223
7.2 Experimental ... 225
7.2.1 Materials ... 225
7.2.2 FANGS-INLIGHT ... 226
7.2.3 LC-MS/MS Analysis and Bioinformatics ... 228
7.3 Results and Discussion ... 230
7.3.1 Comparative analysis of PNGase F, Glycosidase A and Control Deamidation ... 230
7.3.2 Characterization of Glycans in P. trichocarpa ... 238
7.5 References ... 243
CHAPTER 8 ... 246
TransOmic Analysis of Forebrain Sections in Sp2 Conditional Knockout Embryonic Mice Using IR-MALDESI Imaging of Lipids and LC-MS/MS Label-Free Proteomics ... 246
8.1 Introduction ... 246
8.2 Experimental Procedures ... 248
8.2.1 Materials ... 248
8.2.2 Tissue samples ... 249
8.2.3 Histochemistry ... 250
8.2.4 Laser Capture Microdissection ... 250
8.2.5 Sample Preparation for LC-MS/MS ... 251
8.2.6 IR-MALDESI imaging ... 252
8.2.7 IR-MALDESI Data analysis ... 253
8.2.8 Histology-defined analysis of IR-MALDESI imaging data ... 254
8.2.9 LC-MS/MS Analysis ... 256
8.2.10 LC-MS/MS Data Analysis ... 257
8.2.11 Western Blot Confirmation of Identified Lipid Metabolic Pathways 258 8.3 Results ... 259
8.3.2 Molecular imaging of embryonic mouse rostral forebrain ... 263
8.3.3 Mapping unsaturated lipids via specific silver adduct formation ... 266
8.3.4 Resolving conflicts in peak assignment by Ag cationization ... 269
8.3.5 Comparison of Sp2-cKO and WT mouse embryonic cortices via IR-MALDESI imaging and histology-dependent analysis ... 272
8.3.6 Histology-independent strategy: Principal Component Analysis (PCA) ... 275
8.3.7 Comparative Proteomic Profiling of Sp2-cKO and WT cortices via Label-Free Quantification by LC-MS/MS and Western blot ... 280
8.3.8 Integrating ‘omics’ Datasets for Pathway Analysis ... 283
8.4 Discussion ... 289
8.5 Conclusion ... 295
8.6 References ... 295
APPENDICES ... 303
APPENDIX A ... 304
Understanding the Role of Proteolytic Digestion on Discovery and Targeted Proteomic Measurements Using Liquid Chromatography Tandem Mass Spectrometry and Design of Experiments ... 304
APPENDIX B ... 311
Establishing Ion Ratio Thresholds Based on Absolute Peak Area for Absolute Protein Quantification using Protein Cleavage Isotope Dilution Mass Spectrometry ... 311
A Cell Wall-bound Anionic Peroxidase, PtrPO21, is Involved in Lignin
Polymerization in Populus trichocarpa ... 331
APPENDIX D... 345
Elucidation of Xylem Specific Transcription Factors and Absolute Quantification of Enzymes Regulating Cellulose Biosynthesis in Populus trichocarpa ... 345
APPENDIX E ... 347
Phosphorylation is an on/off switch for 5-hydroxyconiferaldehyde O-methyltransferase activity in poplar monolignol biosynthesis .... 347
E.1 Plant Materials. ... 349
E.2 Crude Protein Isolation from P. trichocarpa SDX. ... 350
E.3 Production of PtrAldOMT2 Recombinant Protein. ... 350
E.4 BN-PAGE. ... 350
E.5 Laser Capture Microdissection. ... 351
E.6 Filter-Aided Sample Preparation and Immobilized Metal-Affinity Chromatography for Phosphopeptide Enrichment... 351
E.7 LC-MS/MS Analysis of Phosphorylated Peptides. ... 353
E.8 Peptide Identification and Site Occupancy Calculations. ... 354
E.9 Phos-Tag Immunodetection of Phosphorylated PtrAldOMT2. ... 355
E.10 In Vitro Phosphorylation of Recombinant PtrAldOMT2. ... 356
E.11 Targeted Phosphoserine Mutagenesis in PtrAldOMT2. ... 357
E.13 Enzyme Assays. ... 359
E.14 Phylogenetic Analysis of PtrAldOMT2 Phosphorylation Sites. ... 359
APPENDIX F ... 360
TransOmic Analysis of Forebrain Sections in Sp2 Conditional Knockout Embryonic Mice Using IR-MALDESI Imaging of Lipids and
LIST OF TABLES
Table 3.1 Percent RSD and RA Calculation Method ... 104
Table 4.1 Isoelectric points of PtrPO21 and other lignin peroxidases ... 122
Table 4.2 Amino acid sequence identity (%) of PtrPO21 and lignin peroxidases ... 123
Table 4.3 Lignin and polysaccharide composition in cell walls of PtrPO21 transgenics and wildtype P. trichocarpa. ... 130
Table 4.4 Lignin composition of PtrPO21 transgenics and wildtype P. trichocarpa. ... 132
Table 4.5 Transcript abundance of the xylem-abundant P. trichocarpa peroxidases in PtrPO21 downregulated transgenics ... 134
Table 7.1 DAVIDGO Pathway Analysis of Deamidated Proteins ... 234
Table 7.2 Deamidated Monolignol Proteins ... 235
Table 7.3 Glycan Compositions Identified by Intact Mass ... 239
Table 8.1 Lipids Upregulated and Downregulated by IR-MALDESI in Sp2-cKO Mouse Embryos ... 272
Table 8.2 Lipid Biosynthetic Proteins Differing in Abundance by Label Free Quantification ... 282
Table 8.3 Molecular Functions of Proteins Differing by Label-free Quantification ... 282
Table 8.4 Biological Processes of Proteins Differing by Label-free Quantification ... 283
Table A.2 A list of all the peptides and the corresponding transitions
monitored ... 305
Table B.1 The mean peptide concentration and relative standard deviation of 23 peptides from 3 wild type samples. ... 311
Table B.2 Transitions measured and collision energy used for all peptides. ... 312
Table B.3 Average RA values and percent change in RA values for all
transitions from 2011, 2012, 2013 and 2014. Significant changes (α = 0.05) are highlighted in red. ... 317
Table B.4 Percent change in RSD of RA values for all transitions from 2011, 2012, 2013 and 2014. Significant changes (α = 0.05) are highlighted in red. ... 322
Table C.1 Summary of the lignin peroxidases transgenics and mutants in plants. ... 331
Table C.2 The candidate list of P. trichocarpa class III peroxidases (PtrPOs). ... 333
Table C.3 Expression of the P. trichocarpa laccases in PtrPO21
downregulated transgenics ... 338
Table C.4 Expression of the P. trichocarpa monolignol biosynthetic genes in PtrPO21 downregulated transgenics ... 340
Table C.5 Specific primer sets for RNAi construction and Real-Time PCR 341
Table F.1 Laser microdissection of cWT and cKO Sp2 mouse embryo
cerebral cortices by tissue area. ... 360
Table F.2 Metlin Identification of Metabolites by conventional IR-MALDESI Imaging ... 366
LIST OF FIGURES
Figure 1.1 Linear Quadrupole and Mathieu Stability Diagram ... 2
Figure 1.2 Triple Quadrupole Selected Ion Monitoring Schematic ... 4
Figure 1.3 Schematic of a Quadrupole Orbitrap High Field Mass
Spectrometer ... 6
Figure 1.4 Ion Motion in an Orbitrap Mass Analyzer ... 6
Figure 1.5 Data Dependent Acquisition ... 7
Figure 1.6 Targeted Selected Ion Monitoring Data Dependent Acquisition ... 8
Figure 1.7 Electrospray Ionization and Hydrophobic Bias ... 10
Figure 1.8 Filter Aided Sample Preparation and Anion Exchange StageTip Fractionation ... 15
Figure 1.9 Bioinformatics for Bottom-up Proteomic Data ... 16
Figure 1.10 Deamidation of Asparagine ... 19
Figure 1.11 False Identification of Deamidated Peptides... 21
Figure 1.12 Resolving Power and Accurate Identification of Deamidated Peptides ... 22
Figure 1.13 N-linked Glycan Biosynthesis ... 23
Figure 1.14 Enzymatic Cleavage of Glycans From Asparagine ... 24
Figure 1.15 Filter Aided N-linked Glycan Separation ... 25
Figure 1.17 INLIGHT Hydrazone Formation With Free Glycans ... 26
Figure 1.18 Identification of Tagged Glycans by Peak Pairs ... 27
Figure 1.19 Immobilized Metal Affinity Chromatography ... 28
Figure 1.20 Protein Cleavage-Isotope Dilution Mass Spectrometry ... 29
Figure 1.21 Investigating Tryptic Digestion Parameters by Design of
Experiments ... 31
Figure 1.22 Theoretical Models for Peptide Production and Decay ... 32
Figure 1.23 Collision Energy Optimization ... 36
Figure 1.24 Relative Abundance as a Function of Percent Peak Area ... 37
Figure 2.1 DOE Results ... 66
Figure 2.2 Comparison of Digestion Conditions on Discovery Proteomic Data ... 67
Figure 2.3 Effect of Peptide Decay on Quantitative Accuracy and Precision 71
Figure 2.4 Effect of Enzyme-to-substrate Ratio on Quantitative Accuracy . 73
Figure 2.5 Chymotryptic Peptide Decay Mechanism ... 74
Figure 2.6 Quantitative Assessment of Chymotryptic Peptide Decay... 76
Figure 3.1 RA Values Across 3 Years ... 92
Figure 3.2 Absolute RA Values and RSD Spanning 3 Years ... 94
Figure 3.4 Effect of RA Calculation Method on Overall RSD and Quantifiable Points ... 105
Figure 3.5 Percent Change in RA value and RA Calculation Method ... 107
Figure 3.6 Extracted Ion Chromatogram and Fragment Ion Contamination ... 109
Figure 4.1 Transcript Abundance of Peroxidases in P. trichocarpa ... 117 Figure 4.2 Transcript Abundance of Peroxidases and Monolignol
Biosynthetic Genes ... 119
Figure 4.3 Amino Acid Alignment of PtrPO21 and Known Peroxidases... 120
Figure 4.4 Phylogenic Analysis of Poplar Lignin Peroxidases ... 124
Figure 4.5 Cellular Localization of PtrPO21 and Ptr4Cl3 by PC-IDMS ... 125
Figure 4.6 Transcript Abundance of Transgenic PtrPO21 ... 126
Figure 4.7 Phenotype of Transgenic PtrPO21 ... 128
Figure 4.8 Stem Wood of Transgenic PtrPO21 ... 129
Figure 4.9 Modulus of Elasticity in PtrPO21 Transgenic ... 131
Figure 5.1 Discovery Proteomic Workflow For Targeting Transcription
Factors... 176
Figure 5.2 Peptide Distribution Across StageTip Fractions ... 177
Figure 5.3 Target Cellulosic, Hemicellulosic and Transcription Factors
Identified ... 179
Figure 5.5 Absolute Quantification of Cellulosic Proteins ... 185
Figure 6.1 PtrAldOMT2 converts 5-hydroxyconiferaldehyde to sinapaldehyde for syringyl monolignol biosynthesis. SAH, S-adenosyl-l-homocysteine. ... 201
Figure 6.2 PtrAldOMT2 Phosphopeptide Identification by MS/MS ... 202
Figure 6.3 Characterization of Recombinant PtrAldOMT2 ... 205
Figure 6.4 In Vitro Phosphorylation of Recombinant PtrAldOMT2 ... 207
Figure 6.5 Phosphorylation and Native PtrAldOMT2 Enzymatic Activity .. 211
Figure 7.1 Deamidated Peptides Identified in Enzyme Treated and Control Xylem Samples... 230
Figure 7.2 XXNXX Motifs For All Deamidated Peptides in Treated vs.
Control Samples. ... 232
Figure 7.3 XXNXS/T motifs enriched for in deamidated peptides identified in PNGase F and Glycosidase A treated samples ... 233
Figure 7.4 Identification of Deamidated Peptides by Accurate Intact Mass ... 236
Figure 7.5 Site Localization of Deamidation by MS/MS Spectra ... 237
Figure 7.6 Different classes of glycans identified by MS/MS spectra using SIMGLYCAN. ... 240
Figure 7.7 Confirmation of Glycans by Co-elution of Native and SIL Species in 1-to-1 Abundance ... 241
Figure 8.1 Fluorescence Microscopy of Coronal Section of Embryonic Mouse Brain ... 264
Figure 8.2 IR-MALDESI Lipid Images of Coronal Sections of Embryonic
Mouse Brain ... 265
Figure 8.3 Comparison of Silver-doped vs. Conventional IR-MALDESI Lipid Images ... 269
Figure 8.4 Comparison of WT and Sp2-cKO mouse embryos via Ag-doped IR-MALDESI imaging... 275
Figure 8.5 PCA Analysis of Conventional IR-MALDESI Imaging of Sp2 cWT and cKO Mice ... 278
Figure 8.6 PCA Analysis of Ag-doped IR-MALDESI Imaging of Sp2 cWT and cKO Mice ... 280
Figure 8.7 Steroid Hormone Pathway Analysis ... 284
Figure 8.8 Glycerophospholipid Pathway Analysis ... 286
Figure 8.9 Fatty Acid Elongation Pathway Analysis ... 287
Figure 8.10 LC-MS and Western Blot Quantitative Analysis of 3 Lipid
Biosynthetic Proteins ... 288
Figure A.1 A Quantitative Comparison Using Concurrent Addition of SIL Peptides to Assess Quantitative Accuracy of Digestion Methods. ... 307
Figure A.2 Post-digest Addition of SIL Under Optimized Digest Conditions ... 308
Figure A.4 Peptide Production Curves as a Functnion of Trypsin
Concentration ... 310
Figure B.1 Percent Tolerances Allowed as a Function of Percent Total Peak Area of a Transition ... 327
Figure B.2 Change in The Relative Standard Deviation of Transitions From 2011-2014 as a Function of The Percent Change in Peak Area... 328
Figure B.3 The Mean Percent Relative Standard Deviation for All Transitions From 2011-2014 ... 329
Figure B.4 The Mean %RSD and Standard Deviation for Peptides as a
Function of Precursor m/z. ... 330
Figure C.1 The RNAi specificity for PtrPO21 downregulation P. trichocarpa
transgenics. ... 342
Figure C.2 Wood Powder of PtrPO21 Transgenic ... 343
Figure C.3 Lignin Content and Stem Coloration of PtrPO21 Transgenic... 344
Figure D.1 Frequency of Consecutive MS/MS scans (1-12) following a full MS1 scan across stagetip fractions. ... 345
Figure D.2 Comparative cellular compartmentalization ... 346
Figure E.1 MS/MS Spectra of PtrPAL1 and PtrPAL4|5 Phosphopeptides . 347
Figure E.2 TSIM-ddMS/MS analysis of phosphorylated recombinant
PtrAldOMT2 protein ... 348
Figure F.1 Coronal Embryonic Mouse Brain Optical Images and
IR-MALDESI Images at Different Spot Sizes ... 361
Figure F.2 Conventional IR-MALDESI and Ag-doped IR-MALDESI Mass Spectra ... 362
Figure F.3 Ion Images Acquired Under Conventional and Ag-doped
IR-MALDESI Conditions ... 363
Figure F.4 Conflicts in Peak Assignment Due to In-source Decay Under Conventional IR-MALDESI ... 364
Figure F.5 Principal component analysis of an IR-MALDESI imaging dataset of an embryonic mouse brain section. ... 365
LIST OF PUBLICATIONS
1. Wang, J.P.; Chuang, L.; Loziuk, P.L.; Chen, H.; Muddiman, D.C.; Sederoff, R.R. and Chiang, V.L.: Simple and Robust Production of Functional Recombinant Phosphoproteins Using Crude Plant Extracts. Nat. Protoc. 2015, submitted.
2. Loziuk, P.L.; Meier,F.; Johnson, C.; Ghashghaei, H.T.; Muddiman, D.C.; Direct Integrated Omic Analysis in Forebrain Sections of Sp2 Conditional Knockout Embryonic Mice Using IR-MALDESI Imaging and LC-MS/MS-based Proteomics. Anal. Bioanal. Chem. 2015, In press.
3. Lin, C.; Li, Q.; Tunlaya-Anukit, S.; Shi, R.; Ying-Hsuan, S.; Liu, J.; Loziuk, P.L.; Edmunds, C.; Miller, Z.; Ilona, P.; Muddiman, D.C.; Sederoff, R.R. and Chiang,V.L.: A cell wall-bound anionic peroxidase, PtrPO21, is involved in lignin polymerization in Populus trichocarpa.
Tree Genet Genomes. 2015, In-press.
4. Shilling, J.; Loziuk, P.L.; Muddiman, D.C.; Daniels, H.V.; Reading, B.J.: Mechanisms of egg yolk formation and implications on early life history of white perch. PLOS ONE2015, In-press.
5. Wang, J.P.; Chuang, L.; Loziuk, P.L.; Chen, H.;, Ying-Chung, L.; Shi, R.; Muddiman, D.C.;, Sederoff, R.R.; Chiang, V.L.: Phosphorylation is An On/Off Switch for 5-Hydroxyconiferaldehyde O-Methyltransferase Activity in Poplar Monolignol Biosynthesis. Proc Natl Acad Sci U S A 2015 27: 8481-86.
6. Loziuk, P.L.; Parker, J.; Li, W.; Chien-Yuan, L.; Wang, J.P.; Li, Q.; Sederoff, R.R.; Chiang, V.L.; Muddiman, D.C.: Elucidation of Transcription Factors Regulating Cellulose Biosynthesis in Stem Differentiating Xylem Tissue of Populus trichocarpa. J. Proteome Res.
2015 10: 4158-68.
8. Loziuk, P. L.; Sederoff, R. R.; Chiang, V. L.; Muddiman, D. C.: Establishing ion ratio thresholds based on absolute peak area for absolute protein quantification using protein cleavage isotope dilution mass spectrometry. Analyst 2014, 139, 5439-50.
LIST OF PRESENTATIONS
1. Poster – “Plants, Pathogens and Pathways” Loziuk, P.L., Chiang, V.L., Sederoff, R.R., Dean, R.A. and Muddiman, D.C. BASF iTeam Raleigh, NC December 2015.
2. Oral – “Mass Spectrometry-Based Profiling of Post-Translational Modifications in the Lignin Biosynthetic Pathway” Wang, J.P.; Chuang, L.; Loziuk, P.L.; Chen, H.;, Ying-Chung, L.; Shi, R.; Muddiman, D.C.;, Sederoff, R.R.; Chiang, V.L. Molecular Biotechnology Training Program Symposium Raleigh, NC November 2015.
3. Oral - “Fundamental Aspects of MS-based Strategies for Discovery and Targeted Quantitative Proteomic Measurements in Complex Biological Systems” Loziuk, P.L.; Parker, J.; Li, W.; Chien-Yuan, L.; Wang, J.P.; Li, Q.; Sederoff, R.R.; Chiang, V.L.; Muddiman, D.C. Triangle Area Mass Spectrometry Discussion Group RTP, NC April 2015.
4. Oral/Poster - “Elucidation of Transcription Factors Regulating Cellulose Biosynthesis in Stem Differentiating Xylem Tissue of Populus trichocarpa.” Loziuk, P.L.; Parker, J.; Li, W.; Chien-Yuan, L.; Wang, J.P.; Li, Q.; Sederoff, R.R.; Chiang, V.L.; Muddiman, D.C. U.S. Human Proteome Organization. Tempe, AZ March 2015.
5. Oral - “Fundamental Aspects of Quantitative Measurements in Complex Biological Systems: Considerations from a Systems Biology Approach” Loziuk, P. L.; Wang, J.; Li, Q.; Sederoff, R. R.; Chiang, V. L.; Muddiman, D. C. Clinical & Pharmaceutical Solutions through Analysis: Steven A. Hofstadler Graduate Student Session October 2014.
6. Poster - “Absolute Signal Intensity as a Metric for Ion Ratio Thresholds for Absolute Quantification Mass Spectrometry” Loziuk, P. L.; Sederoff, R. R.; Chiang, V. L.; Muddiman, D. C. American Society for Mass Spectrometry. Baltimore, MD June 2014.
Society for Mass Spectrometry Plant Proteomics Workshop Minneapolis, Mn June 2013.
CHAPTER 1
Mass Spectrometry-based Measurements and OMICs Technologies: An Introduction
1.1 Biological Mass Spectrometry
1.1.1 Preface
Complex biological systems present many analytical challenges which require analytical methodology that has the capability of characterizing biomolecules with a great deal of chemical specificity and sensitivity. Mass spectrometry renders accurate mass through high resolving power instrumentation, structural information through tandem mass spectrometry, and more recently, higher speed and sensitivity necessary to obtain greater breadth and depth of information necessary to meet the challenges present by the complexity of biological systems.
1.1.2 Quadrupole Mass Analyzer and Selective Reaction Monitoring (SRM)
The resolving power of a quadrupole, or rather its ability to differentiate between two distinct m/z ions, is based on the relative magnitudes of the
DC and AC potentials.
At higher DC-to-AC ratios, the linear quadrupole offers greater resolving power. Broad spectrum measurements are achieved by fixing the ratio necessary to obtain the desired resolving power and scanning from low to high magnitude potentials. Alternatively, the potentials can be fixed at a point on the “scan line” to selectively transmit only one m/z ion. This mode of operation is referred to as selected ion monitoring (SIM). It is also possible to operate quadrupoles in “RF-only” mode (i.e., DC = 0 V), in which the DC-to-AC potential ratio is zero and no mass selection occurs.1 Relative to high performance mass analyzers such as the Orbitrap, quadrupole instruments provide poor resolving power; however, when three quadrupoles are
Figure 1.1 Linear Quadrupole and Mathieu Stability Diagram
connected in series to perform tandem MS analyses, this provides great molecular specificity. Tandem-MS (MS/MS) involves the use of multiple mass selection, utilizing a form of fragmentation (Most commonly collision induced) to obtain structural information regarding an analyte. In this manner, a precursor ion is isolated in the first dimension (MS1), subjected to fragmentation and, finally the resulting product ions are detected in the second dimension (MS2). Tandem-MS thus provides an additional mode of separation and specificity based on intact mass in the first dimension and chemical structure in the subsequent dimensions. Tandem-MS is particularly suitable for analysis of peptides and proteins due to their predictive cleavage occurrence along the peptide backbone (Figure 1.9) but can be extended to small molecules as well. Triple quadrupole mass analyzers (QqQ) consist of two mass selective quadrupoles (Q1 and Q3) and one, non-mass selective (RF-only) quadrupole (q2) that is utilized as a collision cell for fragmentation. Selective reaction monitoring (SRM) is the most common acquisition method utilized on the triple quadrupole instrument to perform targeted absolute quantification of small molecules and peptides.2 During SRM analysis (see Figure 1.2), a QqQ serves as a two-stage filtering device with a collision cell separating the two. In the first stage, charged targeted peptide ions (precursor ions) entering the mass spectrometer are isolated based on their m/z, which is dictated by their amino acid composition and other modifications. These separated ions are then fragmented at a specified collision energy (eV) in the collision cell containing collision gas, typically argon or nitrogen. The resulting fragmented peptide ions are then isolated in the second stage based on the
m/z of their various product ions or “transitions”, which is mainly dependent upon their amino acid sequence. Through this method, SRM
due to the extremely low probability of another peptide in a sampled proteome having both the same precursor m/z and product ion m/z, allowing it to pass through both filtering stages. While filtering does reduce the abundance of targeted ions being detected, it more considerably reduces the amount of background ions reaching the detector and thus results in a significant increase in signal to noise relative to other MS detection modes. Furthermore, SRM detection also provides a linear response over a wider dynamic range of protein/peptide concentrations, which is advantageous when performing quantitative measurements. More recently, advances in quadrupole electronics have improved the speed of these mass analyzers such that >500 transitions can be monitored in 1 second.
Q1
(680.1 0.5 m/z)
Q3
(347.7 0.5 m/z)
q2
(RF only)
680.1 m/z 347.7 m/z
Transition
Figure 1.2 Triple Quadrupole Selected Ion Monitoring Schematic
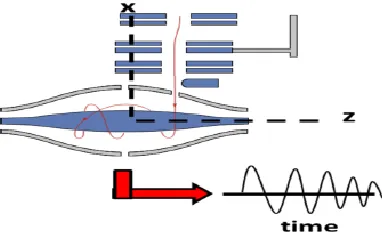
1.1.3 Quadrupole Orbitrap High Field Mass Spectrometer, Data Dependent Acquisition (DDA) and Targeted Selected Ion Monitoring (TSIM) DDA
In a data dependent MS/MS mode the instrument will transmit all ions in a given m/z window through the mass filter and perform high resolution MS in the orbitrap. From this, the relative abundance of ions is then determined and the instrument will attempt to isolate the most
Figure 1.4 Ion Motion in an Orbitrap Mass Analyzer
The trapping motion of ions in an orbitrap. Ions are tangentially injected into the orbitrap and are trapped by electric fields. The frequency in the z direction is proportional to m/z.
Figure 1.3 Schematic of a Quadrupole Orbitrap High Field Mass Spectrometer
abundant species using the quadrupole mass filter. Ions collected in the C-trap will now be sent to the HCD cell in order to fragment the selected ions. These ions will pass back and forth through the collision cell, recollected in the C-trap and transferred to the orbitrap for MS/MS detection. In data dependent acquisition precursor ions are sequentially isolated, fragmented and analyzed based on their abundance. While the orbitrap is acquiring an MS/MS scan, the next most abundant ion determined from the MS scan can be isolated in the C-trap and fragmented in the HCD cell to prepare for the next round of MS/MS analysis by the orbitrap, facilitating parallel isolation and acquisition. This provides for rapid data acquisition speeds, allowing a survey MS1 scan followed by 20 MS/MS scans to be performed in a single
second.
In targeted selected ion monitoring (TSIM) DDA the survey scan range is reduced in order to accumulate only ions of interest of a particular m/z in the c-trap, thereby lowering our limit of detection. This is particularly important in identifying low abundant species such as phosphorylated
Figure 1.5 Data Dependent Acquisition
peptides. Once the signal threshold is reached, the instrument performs MS/MS. This method maximizes sensitivity towards a target analyte and
results in more reproducible identification.
1.2 Reverse-Phase Ultra High Performance Liquid Chromatography (RP-UPLC)
Liquid chromatography can be coupled online with mass spectrometry in order to retain, concentrate analytes and provide separation of complex samples while controlling the time of the experiment to allow the mass spectrometer sufficient time for sequencing as many analytes as possible. Reverse phase separations are particularly compatible with mass spectrometry as they use solvents with low salt content and volatile buffers which reduces the presence of adducts as well as suppress ionization. Furthermore, many of the biomolecules (peptides, metabolites) of interest have hydrophobic properties which are utilized by reverse phase methods. In addition, nanoflow systems allow for small amounts of material (amol, ng quantities) to be used for analysis. Ultra high performance liquid chromatography (UPLC) is compatible with higher pressures (up to 15,000 psi/1000 bar) which allow for smaller stationary phase particles (2.6µm)
Figure 1.6 Targeted Selected Ion Monitoring Data Dependent Acquisition
and longer columns to be utilized (>30 cm). For these reasons, reverse phase UPLC provides peak widths of <20 sec. full width half maximum (FWHM), providing greater separation, resulting in reduced competition and improved sensitivity during electrospray ionization mass spectrometry.
1.3 Electrospray Ionization
1.3.1 Description & Mechanism
Electrospray ionization (ESI) is a powerful ionization method that produces multiply charged ions with minimal fragmentation, thereby allowing for the characterization of intact biological macromolecules by mass spectrometry.5,6 Prior to the introduction of this “soft” ionization technique, mass spectrometry was limited to the study of relatively small molecules due to the challenge of producing of large, intact gas phase ions. ESI also improved upon existing techniques such as matrix assisted laser desorption ionization or MALDI as ESI increased the effective, upper mass range of mass analyzers by providing multiply charged ions and reducing the mass-to-charge. Moreover, ESI allowed for direct interface of liquid chromatographic (LC) separations with mass spectrometry7,8 which facilitated analysis of complex biological systems. In 2002, Professor John Fenn received the Nobel Prize in Chemistry for this invention due to its tremendous impact to the field of bioanalytical chemistry.9
electrostatic energy. The solvent evaporates until the surface-charge density
reaches the Rayleigh Limit.11
The surface tension of the droplet is then overcome by electrostatic repulsion and coulombic fission results in several progeny droplets and reduce the surface-charge density of the system. There are two competing theories on how gas phase ions are finally produced from these progeny droplets: the charged-residue model proposed by Dole et al.12 and the ion desorption model proposed by Iribarne and Thompson.13 In the charge residue model,12 the process of coulombic fission is repeated by progeny droplets and subsequent droplets, until the ultimate droplet is formed containing a single analyte molecule. A gas phase ion is formed as the remaining solvent evaporates. In the ion desorption model,13 ions desorp
+ + + + + + + + + + + + Coulombic Fission + + + + + + + + + + ++ + + + + + + + + + + + + m/z ESI Emitter V Hydrophilic Peptide Hydrophobic-Modified Peptide MS Inlet + + + + + + + +
Figure 1.7 Electrospray Ionization and Hydrophobic Bias
directly from the surface of charged progeny droplets by interaction with the droplet’s electric field. It is now generally accepted that
production of gas phase ions occurs by this latter mechanism, although Dole’s model is believed to hold some validity for extremely large molecules.14
1.3.2 Hydrophobic Bias & Derivatization
with the more hydrophobic (i.e. more surface active) peptides. Within the ion producing progeny droplets more surface active peptides are not only enriched, but are also in contact with a greater number of charges, which increases their interaction with the droplet’s electric field. This factor, in combination with their inherently lower free energy of solvation, causes more hydrophobic peptides to be ejected at a faster rate and give a greater ESI response.
Null et al. were the first to take advantage of the hydrophobic bias of ESI through chemical modification when they coupled an alkyl chain to the 5’ end of an oligonucleotide primer in order to increase the hydrophobicity of the resulting PCR product.20 As a result, the authors observed the 16 kDa PCR product to have dramatic increase in ESI response and a 10-fold decrease in the detection limits. Since this preliminary work with oligonucleotides, hydrophobic modification strategies have been developed for the derivatization of various functional groups within proteins and peptides, including the primary amines of N-termini and lysine residues,21 the guanidine group of arginine residues,22 and the thiol group located on cysteine residues.23-25 More recently, hydrophobic derivatization has also been successfully employed for augmenting ESI responses of small molecules26 and glycans.27-29
1.4 Bottom-up Proteomic Workflows
1.4.1 Bottom-up Proteomics, Filter-Aided Sample Preparation, Anion Exchange StageTip Fractionation and Bioinformatics
sample. The peptides’ sequences can then be obtained by bioinformatics software using their intact mass and subsequent product-ion spectra; experimental spectra are matched to theoretical spectra obtained from an in silico digestion of a target (or target-reverse) database.30,31 The most commonly used enzyme for protein digestion in bottom-up proteomics is trypsin. Due to the frequency of arginine (R) and lysine (K) residues within the proteome, trypsin generates peptides with a mass range ideal for obtaining sequence.32 Because it cleaves at basic residues R and K, the use of trypsin favors the +2 charge state of peptides when conducting experiments under acidic conditions using positive electrospray ionization mass spectrometry (ESI), generating fragments that are easily detectable.
The digestion process begins with removing the proteins’ quaternary and tertiary structure by chemically reducing all disulfide bonds and, if needed, by heating or adding chaotropic reagents such as Urea.33,34 Denaturation of proteins serves to enhance the cleavage rate and efficiency of subsequent digestion steps with proteolytic enzymes, which is vital for detection and accurate and sensitive quantification. Additionally, thiol moieties responsible for disulfides bonds which preserve tertiary structure such as those found in cysteine containing peptides must be irreversibly modified with chemical alkylation reagents.35 This prevents spontaneous reformation of disulfide bonds, preventing scrambling of disulfide bonds between peptides and creates linear peptide sequences which can be easily de-convoluted during MS analysis.36
high-throughput and peptide recovery is often poor.41 In solution digestion, while not labor intensive, results in a bias towards the soluble proteome since many detergents often used for the solubilization of proteins are not LC-MS compatible.42 The introduction of FASP combined advantages of in-gel and in solution digestion.43 FASP implements the use of a molecular size cut-off filter, allowing the experimenter to remove impurities and unwanted detergents while retaining the protein sample which can then be digested in solution. Subsequently, the resulting peptides can be eluted and collected for analysis.
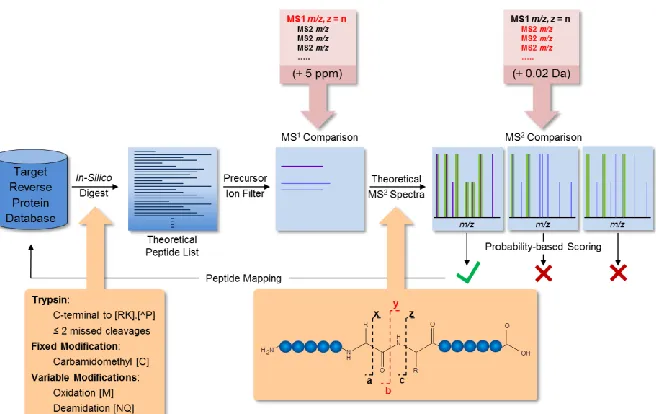
Bottom-up bioinformatics workflows typically begin with a target-reverse or target-decoy database which is digested in silico according to digestion rules specified (RK, <2 missed cleavages, fixed and variable modifications). A theoretical peptide list is then obtained which is then compared to a peak list from the acquired data containing accurate intact mass values from our MS1 survey scans. The theoretical list is then refined by filtered matches within 5ppm mass accuracy. Theoretical MS/MS spectra are generated based on known cleavage events occurring during collision induced dissociation which results in primarily cleavage of the amide bond resulting in y and b ions. Probability based scoring is then performed based on the number of identified fragment ions within 0.02 Da. These resulting identifications can then be filtered at a 1% false discovery rate to obtain highly confident peptide and protein identifications.
Figure 1.8 Filter Aided Sample Preparation and Anion Exchange StageTip Fractionation
Schematic of FASP and StageTip workflow. After protein extraction and reduction the sample is loaded onto a molecular weight cutoff filter. Urea is used to help denature and deplete detergent from the sample. Reduction, alkylation, buffer wash and trypsin digestion were performed on the filter. StageTip anion exchange fractionation was performed at the peptide level.
1.4.2 Label Free Quantification by Peak Area and Spectral Counting
The quantity of a given protein can be estimated without the presence of an internal standard. This is known as label free quantification. Many methods exist for approximating a relative or absolute abundance of a given protein. Peak area can be used in a bottom-up proteomics experiment where the top 3 most abundant peptides by intact MS peak area are averaged to obtain quantitative measurements at the protein level. There are other methods which utilize only unique peptides or other selection criteria for more accurate quantification. Spectral counting has also been used for estimating protein abundance. A spectral count is defined by a
Figure 1.9 Bioinformatics for Bottom-up Proteomic Data
Bioinformatics workflow for processing shotgun proteomic data. In silico
total count of MS/MS spectra which identify a given protein. The assumption here is that the more often a peptide (protein) is selected by data dependent analysis for fragmentation, the more abundant the protein. There are obvious potential biases from this method including: protein length, number of detectable tryptic peptides and where in the chromatogram these peptides elute all effect the total spectral counts of a given protein. There are many existing methods which attempt to account for these biases such as exponentially modified protein abundance index (empai)45 which normalizes spectral counts to the number of detectable tryptic peptides possible in a given protein (Eq 1.1) where N observed is the number of experimentally observed peptides with scores above a specified threshold and N observable is the calculated number of observable peptides for the protein given the search constraints.
Another method which is less cumbersome to implement is normalized spectral abundance factor or NSAF.46 This normalizes the number of spectral counts to the number of amino acids in a protein (Eq 1.2) where SN is the number of peptide spectra matched to the protein, LN is
the length of protein N and n is the total number of proteins in the input database. In this way the NSAF value reflects the relative abundance of a protein with respect to all other proteins in a given sample.
1.5 Post translational modifications
It is well known that post translational modification (PTM) of proteins provide an essential role in the biological function of proteins. Over 300 post translational modifications are currently known and the number continues to grow. This means that for a given genome of 20-25 thousand protein coding genes that there are over 1 million possible proteoforms. This greatly increases the complexity of the proteome and requires a technique with greater specificity to elucidate these modified forms.
Phosphorylation and glycosylation are two PTMs in particular that have been widely studied due to the great biological significance of these modifications. These modifications present many analytical hurdles which preclude their detection including: low occupancy, lability, complex structure (glycosylation), poor ionization capability and site localization. Here we present MS-based methodologies which have been impactful in enhancing our ability to further understand these modifications from an analytical and biological perspective.
Figure 1.10 Deamidation of Asparagine
1.5.1 Accurate Identification of Deamidated Peptides for Glycosylation Site Profiling
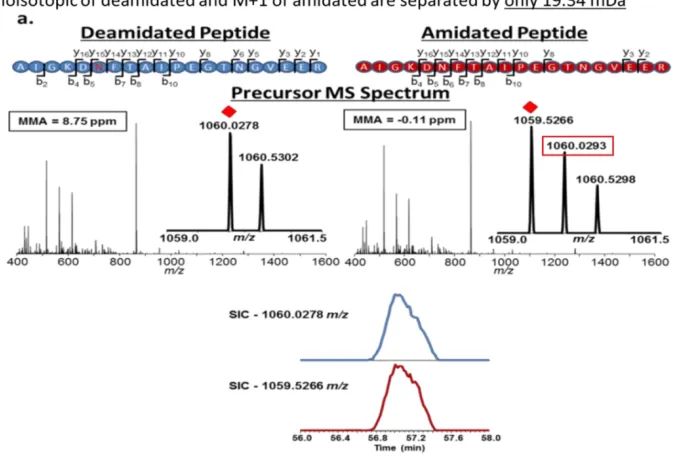
Deamidation is a variable modification of +0.984 Da often searched for during shotgun proteomics experiments. Chemical deamidation can occur, particularly under basic pH conditions during sample preparation. This consists in a conversion of Asparagine to Aspartic acid via loss of NH3 (Figure 1.10). Deamidation can also occur in vivo as a post-translational modification. In addition enzymatic deamidation can occur during PNGase F treatment which removes glycans from Asparagine residues. With the proper controls for background deamidation, deamidation site profiling can be used to determine the site of glycosylation which is known to occur at NXS/T motifs where X is any amino acid except for proline.
Figure 1.11 False Identification of Deamidated Peptides
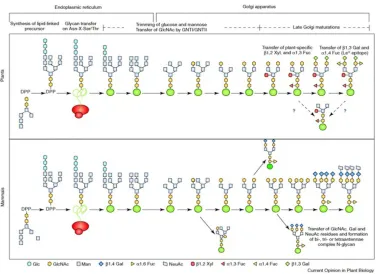
1.5.2 N-linked Glycosylation in Plants
Glycosylation is a covalent linkage of an oligosaccharide to a protein. In N-linked glycosylation, this sugar is attached to the amide nitrogen of an asparagine (Asn) residue. N-linked glycosylation has been shown to be a important post translational modification capable of altering the biological function, stability, activity and structure of a protein. Similarly to eukaryotic N-linked glycosylation, in plants N-linked glycosylation begins during co-translation in the endoplasmic reticulum with the addition of an oligosaccharide precursor (Glc3Man9N-acetylglucosamine2
Figure 1.12 Resolving Power and Accurate Identification of Deamidated Peptides
[Glc3Man9GlcNAc]2) to an Asp residue (Figure 1.13). As the glycoprotein is transported, the glycan undergoes modification in the ER and Golgi apparatus which involves the addition and removal of sugar residues. Plants differ specifically in the late Golgi apparatus where core α(1,6)-linked fucose and terminal sialic acid residues are formed in mammals, while bisecting β(1,2)-xylose and core α(1,3)-fucose residues are formed in plants.
PNGase F is an enzyme often utilized to cleave N-linked glycans from proteins. While PNGase F is able to cleave glycans with core α(1,6)-l fucose containing glycans, it is unable to extensively cleave core α(1,3)-fucose containing glycans in plants (Figure 1.14). Glycosidase A, isolated from
Figure 1.13 N-linked Glycan Biosynthesis
almonds, is an enzyme which has the ability to cleave core α(1,6)-l fucose containing glycans.
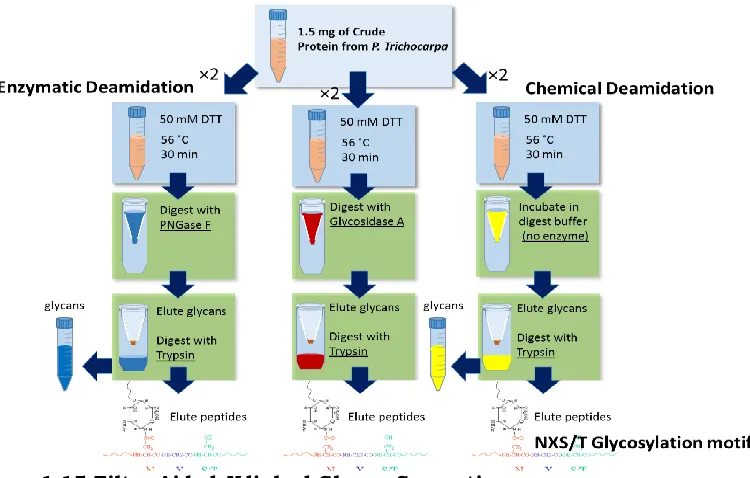
1.5.3 FANGS-INLIGHT: A Methodology for Glycan Derivitization and Identification
Filter-aided N-linked glycan separation utilizes enzymatic removal of glycans and a molecular weight cut-off filter to obtain free glycans from complex biological samples (Figure 1.15). This method is robust, reproducible and allows removal of contaminants prior to digestion. FANGS
Figure 1.14 Enzymatic Cleavage of Glycans From Asparagine
PNGase F is able to cleave at core α(1,6)-linked containing glycans found in mammals; however, it is unable to extensively cleave core α(1,3)-fucose containing glycans in plants. Glycosidase A has the ability to cleave core α(1,3)-fucose containing glycans.
Adopted from Gomord and Faye Curr. Opin. Plant Biol. 2004, 2:171-81.
PNGase F
Glycosidase A
PNGase F
also allows for higher throughput and results in comparable recovery to solid phase extraction method.49,50 Further this method can be utilized to obtain glycosite information by digesting PNGase F treated protein with trypsin to obtain deglycosylated peptides. When done in parallel with control samples (no PNGase F) treatment, one can distinguish background chemical deamidation from enzymatic deamidation in order to obtain glycosite information.
The hydrophilic nature of glycans precludes their detection by electrospray ionization mass spectrometry. Individuality normalization when labeling with hydrazide tags utilizes a reactive hydrazine reagent is introduced at the reducing terminus of a glycan51 (Figure 1.17). Hydrophobic tagging of glycans makes them amenable to reverse phase
Figure 1.15 Filter Aided N-linked Glycan Separation
Filter aided N-linked glycan separation (FANGS) involves reducing the protein with DTT on a molecular weight cut-off filter followed by clean-up and PNGase F or Glycosidase A digestion. Glycans are then collected and use for labeling by INLIGHT for reverse phase LC-MS.
separations and provides on average, a 4-fold increase in abundance by nanoLC-MS.50 Differentially labeling glycans using native and stable-isotope labeled reagents allow for glycans to be identified by peak pairs (light and heavy), separated by 6.0201 Da (Figure 1.18). Further, differential labeling of samples can be used to provide very precise relative quantification of glycans under different treatments/conditions.
Figure 1.17 INLIGHT Hydrazone Formation With Free Glycans
The hydrazone formation derivatization reaction. The reducing terminus of a free glycan reacts under acidic conditions, providing increased hydrophobicity. This allows one to perform reverse phase separation on glycans and provides a lower limit of detection by electrospray ionization.
Figure 1.16 INLIGHT Hydrazide Gkycan Tag
INLIGHT tag contains a hydrazide group which reacts with the reducing terminus of the glycan, a hydrophobic extension region and a 13C6
1.6 Immobilzed Metal Affinity Chromatography (IMAC) for Phosphopeptide Enrichment and LC-MS/MS
Phosphorylation is a widely studied and important post-translational modification for controlling protein localization, activtiy, stability and other cellular functions. It is estimated that 30% of all proteins are phosphorylated.52 Phosphorylation presents an analytical challenge in mass spectrometry due to its low occupancy (often ~1% of total proteoforms), poor ionization in positive electrospray ionization as well as the instability of the phospho moiety which hinders the ability to determine the site of phosphorylation during fragmentation.53 This makes enrichment prior to LC-MS analysis necessary for in-depth phosphproteome analysis.
Currently, IMAC is one of the widely used and reproducible
Figure 1.18 Identification of Tagged Glycans by Peak Pairs
INLIGHT tagged glycans can be identified by a precise 6.0201 Da shift with matching isotopic distributions. Accounting for the additional mass imparted by the tag (254.14191, 260.16204), the accurate intact mass within 5ppm is sufficient to identify the composition of the glycan.
affinity of positive metal ions (Fe3+, Ga3+, Al3+, Zr4+ for negatively charged phosphate groups (Figure 1.19) and chelates to a nitrilotriacetic acid (NTA) agarose stationary phase. This can be used to create a resin which can then be packed into stagetip containing a filter to support the stationary phase. Optimizing this technique has been explored in recent years to improve the specificity by fine tuning acidic loading conditions to reduce acidic peptide binding as well as washing with acetonitrile and NaCl to reduce the non-specific binding of neutrals and hydrophobic peptides.
1.7 Absolute Quantification
1.7.1 Protein Cleavage - Isotope Dilution Mass Spectrometry
Protein quantification exists in two forms: relative quantification and absolute quantification.57 In relative quantification, the abundances of analytes are compared between two samples or experimental conditions without knowing the absolute concentration. In comparison, absolute quantification measures and defines the exact concentration a specific protein in a single sample.
Figure 1.19 Immobilized Metal Affinity
Chromatography
Immobilized metal affinity chromatography for phosphopeptide enrichment utilizes the low pKa of the phospho moiety to selectively enrich for phosphorylated peptides. Nitrilotriacetic acid agarose resin chelates with Fe3+ which interacts with the negatively charged
Isotope dilution mass spectrometry (IDMS) has recently been demonstrated as an appropriate alternative for absolute protein quantification.58-61 IDMS has been well established for quantifying small molecules and metabolites.62 This technique involves spiking in a known amount of a stable isotope-labeled (SIL) internal standard into a sample and then comparing the relative signal intensities of the native analyte and internal standard which can be separated in m/z space. In 1996, IDMS was implemented as a method to quantify proteolytic peptides using a stable isotope-labeled synthetic peptides as an internal standards.58 The known amount of peptide can then be used to calculate the absolute quantity of protein present (Figure 1.20).
Figure 1.20 Protein Cleavage-Isotope Dilution Mass Spectrometry
Given the inherent difficulties with detecting and resolving large intact
proteins by MS, the majority of IDMS schemes have focused on the use of
PC-IDMS methodologies. One PC-IDMS strategy for differentially quantifying proteins and their post translational modified (PTM) forms was developed by Gygi and co-workers.60 This method, coined the absolute quantification (AQUA) method, utilizes SIL synthetic peptides, with and without post-translational modifications (PTMs), and selective reaction monitoring (SRM) to quantify the individual protein forms.
1.7.2 Proteolysis and Peptide Decay
Another recent study discovered a quantitative discrepancy when adding SIL peptides concurrent with digestion versus post digestion64. A mathematical model based on pseudo-first order kinetics was developed to simulate the differential production and decay of native tryptic peptides and
Figure 1.21 Investigating Tryptic Digestion Parameters by Design of Experiments
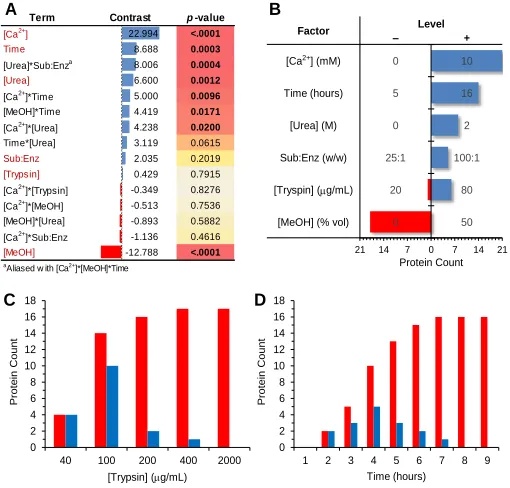
(A) Shown are the statistical results obtained when using the median protein concentration as the metric (i.e., response factor) for digestion efficiency during FracFD experiments. The terms are the 6 main factors and 9 second-order interactions assessed using this experimental design listed in order of their contrast value. The contrast represents the magnitude of the influence each term has on the experimental outcome, and the sign designates which level (+ or –) was favored. The individual p-values indicate the significance of each term. (B) The bar graphs shows the number of proteins determined to be significantly impacted by each main factor (p-value < 0.05). (C) The minimum concentration of trypsin required to achieve complete digestion in 16 hours was determined experimentally. (D) The minimum time required to obtain complete digestion when using 400 µg/mL trypsin was determined. (C and D) The red graphs show the cumulative number of proteins having achieved complete digestion by the specified point and the blue graphs show the specific number of proteins achieving complete digestion at the specified point.
Term Contrast p-value
[Ca2+] 22.994 <.0001 Time 8.688 0.0003 [Urea]*Sub:Enza 8.006 0.0004
[Urea] 6.600 0.0012
[Ca2+]*Time 5.000 0.0096 [MeOH]*Time 4.419 0.0171 [Ca2+]*[Urea] 4.238 0.0200 Time*[Urea] 3.119 0.0615
Sub:Enz 2.035 0.2019
[Trypsin] 0.429 0.7915
[Ca2+]*[Trypsin] -0.349 0.8276 [Ca2+]*[MeOH] -0.513 0.7536 [MeOH]*[Urea] -0.893 0.5882 [Ca2+]*Sub:Enz -1.136 0.4616
[MeOH] -12.788 <.0001
aAliased w ith [Ca2+]*[MeOH]*Time
21 14 7 0 7 14 21 Protein Count
B A
Factor – Level
+
[Ca2+] (mM) 0 10
Time (hours) 5 16
[Urea] (M) 0 2
Sub:Enz (w/w) 25:1 100:1
[Tryspin] (mg/mL) 20 80
[MeOH] (% vol) 0 50
0 2 4 6 8 10 12 14 16 18
40 100 200 400 2000
P rote in Coun t [Trypsin] (mg/mL) 0 2 4 6 8 10 12 14 16 18
1 2 3 4 5 6 7 8 9
SIL peptides (Figure 1.22). Time course digestion experiments confirmed these modeled production/decay kinetics, concluding that post digestion addition of SIL peptides results in a significant underestimation of the true value and that concurrent addition of SIL peptides is most appropriate. However, concurrent addition of SIL peptides resulted in a slight overestimation of the true value with half of the peptides investigated having quantitative errors greater than 10%. This indicated a remaining influence due to the differential production/decay of native and SIL peptides. Native peptides must be produced from the protein while SIL peptides are already in their tryptic form when added to the digestion. The source of this decay has remained elusive however, it was hypothesized that this was likely due to peptide stability but also could be attributed to the non-specific activity of trypsin.
Figure 1.22 Theoretical Models for Peptide Production and Decay
Theoretical models for peptide production and decay during AQUA workflows. Here, t0 is
the time point when digestion begins and is set to 0 hours in this frame of reference such that the length of the digestion period is defined by t. The time point at which the SIL peptide is introduced to the sample is called ti and the time difference, Dt, between
the start of the digestion (t0) and the introduction of the SIL peptide (ti) is defined by the
equation shown. Depicted are the modeled results when the SIL is introduced into the sample concurrently with the enzyme (Dt = 0), or post-digestion (Dt = -t). The blue and red lines in each plot indicates [PNAT] and [PSIL], respectively. The light purple line
indicates the correct ratio of [PNAT] and [PSIL] under ideal conditions, while the dark
purple line shows the “measured” ratio.
0 4 8 12 16 20 24
Time (hours)
Concurrent (ti= t0)
0.0 0.5 1.0 1.5 2.0
0 4 8 12 16 20 24
Time (hours)
Post-digest (ti= t)
The structure, specificity, and kinetics of trypsin have been widely studied in great detail. Many sources and types of trypsin are currently manufactured and used by researchers in proteomics.64-67 While non-specific cleavage activity of unmodified trypsin due to autolysis during enzymatic digestion has previously been reported,68,69 the cleavage specificity of various trypsin types and the extent to which it influences a proteomic data set have been understudied. With the introduction of modified trypsin through dimethylation of lysine residues, kinetic studies have suggested that the enzyme is capable of greater cleavage specificity of tryptic sites as well as having the ability to maintain optimal activity under more basic conditions and at higher temperatures.70 Other forms of modified trypsin include trypsin with acetylated lysine residues and immobilized trypsin, which is chemically linked to a hydrophilic polymer. Additionally, the source of trypsin varies as well; typically either bovine or porcine. Other digestion parameters such as pH and the enzyme-to-substrate ratio used in processing protein samples vary widely depending on the lab. Enzyme-to-protein ratios typically used in discovery-based and absolute quantitative proteomics experiments range from 1:100 to as high as 1:2.5.71-75 While previous research has shown there to be no significant difference between a 1:20 or a 1:100 enzyme-to-substrate ratio on global proteomic data (Muddiman unpublished), investigation of higher enzyme-to-substrate ratios for global proteomics has not been reported.63 Additionally, examination of the effect of enzyme-to-substrate ratio on measurements made for absolute quantification has been lacking.