Predictive Efficiency of Technical Indicator
Komal Vartak, Rashmi Thakur, Sheetal Rathi
M.E. Student, Dept. of Computer Science, Thakur College of Engineering and Technology, Mumbai, India
Assistant Professor, Dept. of Computer Science, Thakur College of Engineering and Technology, Mumbai, India
Assistant Professor, Dept. of Computer Science, Thakur College of Engineering and Technology, Mumbai, India
ABSTRACT: Technical indicators are helpful for the traders while doing trade business. The analysis for the trading is done by using Technical Indicators. The successful prediction of particular stock’s future value gives us more profit. Technical indicators allow to get future stock price information based on the different formulas. It plays a vital role to make a right investment at right time. Here, we represent research on different technical indicators by considering stock price of different companies and shows the effectiveness of technical indicators while generating results to either sell or buy particular stock value of particular company. This report is covering the brief description about following technical indicators as Simple Moving average (SMA),Exponential Moving average (EMA),Rate of change (ROC),Moving average convergence Divergence (MACD). All above indicators gives us information about when to buy and sell stocks so that we get more profits. By using all of the above technical indicators it is beneficial for novice trader to take right decision at right time with less human intervention. As it requires very less human intervention all major trading firms and banks used this technical indicators.
KEYWORDS: Simple Moving Average (SMA), Exponential Moving Average (EMA), Rate Of Change (ROC), Moving Average Convergence Divergence (MACD).
I. INTRODUCTION
Data mining is one of process of capturing the historic data that holds the essential information and then predicting the future direction of stock market value. This analysing process is designed to help investors to find out the hidden patterns from the historic data that have predictive capability to find out the information and took right investment decisions at right time. In Stock Market, People are used to buy and sell stock of particular company. This information can be used to make maximum profit and at same time right investment at right time. Because of wide applicability of data mining in many areas, it has attracted tremendous amount of attention in database research. Most of the research studies have been focused on predicting future trends and stock patterns. Mining of stock either Buy, sell or hold the particular stock. Technical Indicators provide result that are based on the historical data and it provides satisfactory result when particular traders takes the help of technical results .The main objective of using technical indicators are to forecast the future trends & provides suitable suggestion to invest and to represent the trends price of stock values. The analysis of the result obtained will be trying to find out more accurate decision either to buy or sell the stock done by measuring accuracy of sentiments variation in terms of precision. Here we are considering stock values of the different companies and then applied that value to technical indicators for predicting the future value of stock. The analysis of the result obtained will be trying to find out more accurate decision either to buy or sell or super buy or super sell the stock done by measuring accuracy of sentiments variation in terms of precision. A proper analysis helps in reducing the risk on investment in the share markets and in choosing a less risky and highly rewarding investment avenue
II. RELATED WORK
stock patterns. Different technical indicators were combined to predict if the day’s closing price would increase or decrease depending upon technical variables. There were some methods such as Moving Average (MA), rate of change (ROC), momentum (MOM), Simple Moving Average (SMA). A method named as the Multi-objective Quantum-inspired Tabu Search (MOQTS) algorithm, which can be applied to a stock data in particular system [3]. In order to find out the correct trading points, this trading system uses different technical indicators as trading rules in order to cope with different stock situations. And the algorithm was used to identify the optimal and the best combination of trading rules with the help of technical indicators and financial statement to find out trading strategy. In addition to this sliding window technique is used to overcome the Over-fitting problem [4].
In Automated Framework, is used for combination of considering news factor into Stock Trading System, they also taken into consideration of technical indicators and sentiment analysis for deriving the correct prediction patterns. The strategies take the form of rules with the combination of technical trading indicators with a news variable, and after that genetic programming algorithm used on the extracted data [5]. In this paper, an evolving least squares support vector machine (LSSVM) learning algorithm is used with a mixed kernel is used to predict the stock market patterns. In the proposed learning paradigm, a genetic algorithm (GA) is used for optimization of parameter in LSSVM, i.e., evolution of algorithmic parameters. Finally, the evolving LSSVM algorithm is used with best feature subset extracted, in addition to this optimal parameters values taken into consideration, and a mixed kernel is used to predict stock market trends in terms of historical data [6]. In this paper, it present an trading system for Nifty for deciding the buying and selling stock value for every day trading that uses different technical indicators for the prediction of buying and selling stocks values automatically. Historical data has been undergo through the various technical indicators and also to apply the Neural Network that predicts stock patterns for intraday Nifty [7]. An intelligent model for stock market signal prediction of stock market trend takes help of Multi-Layer Perceptron (MLP) and Artificial Neural Networks (ANN) [8].Blind source separation technique, from signal processing, was combine with baseline for MLP and ANN to overcome the problems of prediction accuracy and lack of generalization[8]. In this paper, we introduce a hybrid neuro genetic system for stock trading. Similar work related to NN was also introduced as A recurrent neural network (NN) used for the prediction model [9]. It was very interesting to predict the future value of stock values but it very complicated to find out the future stock values. For example, only one day return of the closing price and the moving average, highest and lowest prices of stock used in additional to prices series, volume of transaction, macroeconomic data and market indicators that were considered as input variables [8].In summary the prediction process is complicated due to its uncertainty of stock values. Therefore with the help of technical indicators: It gives trade direction to the trader either to “buy”, “sell” or “hold” the particular stock values Trends are easily found. Helpful to understand the price movement. With the help of Chart it is very helpful to get valuable information in the forms of charts and patterns.
III.PROPOSED ALGORITHM
Step 1:Select the historical data from BSE or NSE. Step 2:Extract the sensitive attribute from dataset.
Step 3:Perform the technical analysis on the extracted data with the following technical indicator 1. Simple Moving Average (SMA)
2. Exponential Moving Average (EMA) 3.Rate of Change (ROC)
4. Moving Average Convergence Divergence (MACD)
Step 4:Considered all possible predictions based on above technical indicator 1. Apply the splitting rules to data at a node
2. Apply the stopping rules for deciding when a branch is terminate and then it can’t be split any more 3. Finally predict the target variable in each terminal node
4. Once the prediction is done, apply the liner regression to predict the final value
Step 5:Predict the stock value
Aim of the proposed algorithm is tryto predict the perfect investment decision of the stock data depending upon market at right timeto get maximize profit to investors by minimizing the risks. As we considered select the historical data from www.nseindia.com site for the period of 31st October 2015 to 30th September 2016.
IV.TECHNICAL INDICATORS
Simple Moving Average (SMA)
A simple moving average is calculated by taking into consideration of average of most recent closing prices of n time period [9]. Most moving averages are based on the closing prices. SMA is one of the lagging indicator. Lagging indicator means those indicators which follow price action and are commonly referred to as trends following indicators. Formula used for SMA- SMA={Pm+Pm-1+...+Pm-(n-1)}/n
Where, Pi = price of the share and n = time period used for computing the moving average stock value. Below example shows how prediction can be done using SMA formula for new users as
SMA= (48.10+45.20+…47.10)/5 which gives 47.10.
From the above example, we can conclude that stock value is 47.10 for the last 5 days. Here we calculating the average stock value of last 5 days and then accordingly calculated predictive stock value for the next day.
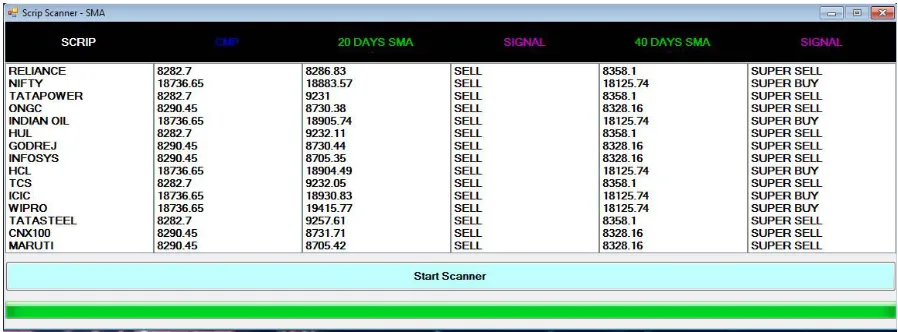
Fig 1. Simple Moving Average (SMA)
From the above attached image of SMA, shows that when the trader is to decide when is to buy and Sell stock and if he is considering for the long term then it shows the when we got maximum profit Either choosing super sell or super buy signals. SMA is one of the lagging indicator. Lagging indicator means those indicators which follow price action and are commonly referred to as trends following indicators. SMA is the one which is most common and widely use technical indicator and it is very easy to understand for the new traders. They smooth data series and makes it easier for trading and mostly used in volatile market. It plays a significant role to identify for support and resistance level. SMA can used as support in an uptrend and resistance in a down trends. It is best suited for short term and long term trending.
EMA (Exponential Moving Average)
It is calculated by applying weight to recent price changes. The exponential moving average is used to find out to stock market trends by using a short and a long term average [10]. This is one of the best technical indicator to find out the prediction of stock trends [1].There are 3 steps to calculate EMA as mentioned below:
•Step1 -Calculate the SMA.
Formula used for EMA: {Close - EMA (previous day)} multiplier+ EMA (previous day) Where, Multiplier: 2/ (Time periods+1) = (2 / (10+1)) = 0:1818(18:18%)
Below example shows how prediction can be done using EMA formula for new traders as A 10-period exponential moving average applies an 18.18% weighting to the most recent price. For 10-period EMA we can also be used an 18.18% EMA. For 20-period EMA applies a 9.52% weighing to the most recent price (2/ (20+1) = .0952).
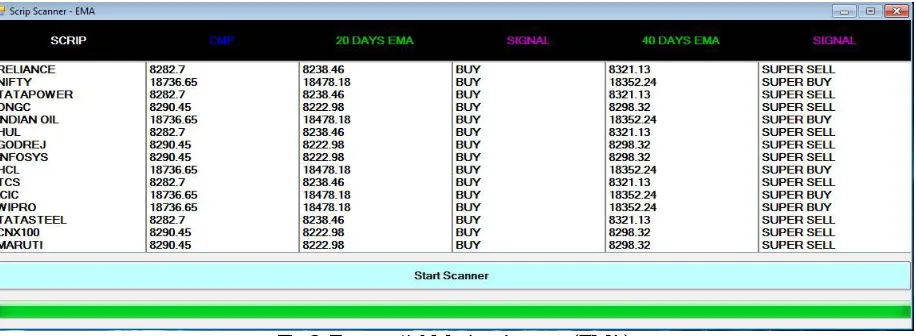
Fig 2. Exponential Moving Average (EMA)
The attached image shows the results when to buy or sell particular stock of specific company and Also shows when trader gets maximum benefit that is super buy or super sell for at the time of long Time period. EMA is one of the lagging indicator. To identify the direction of trend or define potential support & resistance level. It is faster than SMA because it is less sensitive to recent prices longer moving average more than lag. EMA can used as support in an uptrend and resistance in a down trends. It is best suited for short term and long term trending.
Rate of Change (ROC):
To calculate ROC, a set of period is used to compare with today's price2. The rate of change is one of the technical indicator that calculate the difference between the closing price Pi of the current day i and the closing price Pi_10 of 10 days earlier.
Formula of ROC:Ci = Pi – Pi - 10 Pi – 10
Fig 3. Rate of Change (ROC)
The image shows that the ROC indicator, in this signals are mostly indicating with the Positive and negative values. When the indicator shows positive value trader must buy and Gets maximum profit and for the negative signal trader must sell the stock with profit. ROC is one of the leading indicator. Leading indicators are those which are designed to lead price movement. Mostly used to measure the speed at which prices are changing. An upward surge in ROC reflects share price in advance or else steep price decline.
Moving Average Convergence Divergence (MACD):
MACD is one of the best technical indicator that subtracts two stock values of two exponential averages from each other [12].
Formula of MACD: (N1 days EMA – N2 days EMA)
Below example shows how prediction can be done using MACD formula for new traders as For example, the moving averages of 20 days and the 40 days respectively. The mathematical formula for the MACD is: Di =E [20]i– E[40]i .A buy signal is generated when the MACD arrives at the zero level in an upward direction. A sell signal is generated when the MACD cut the zero level in a downward direction.
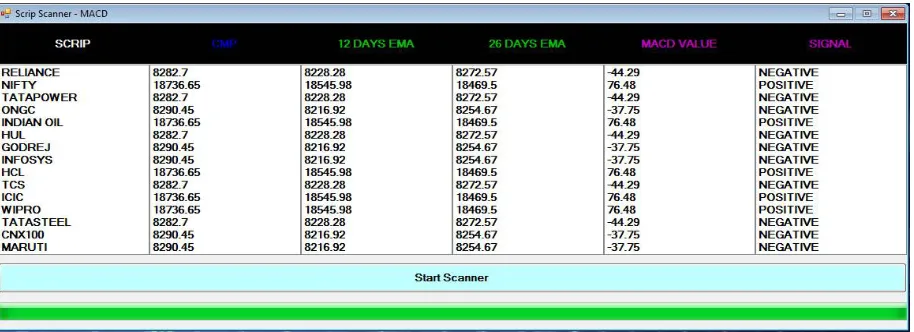
Fig 4. Moving Average Convergence Divergence (MACD)
.EMA is above the 40-day EMA i.e. when the MACD histogram is positive. This means upside momentum is increasing. On the other hand, negative MACD indicates that the 20-day EMA is below the 40-day EMA i.e. when the MACD histogram is negative. This means down side momentum is increasing. To gauge the strength or momentum of the market's price movement up or down.
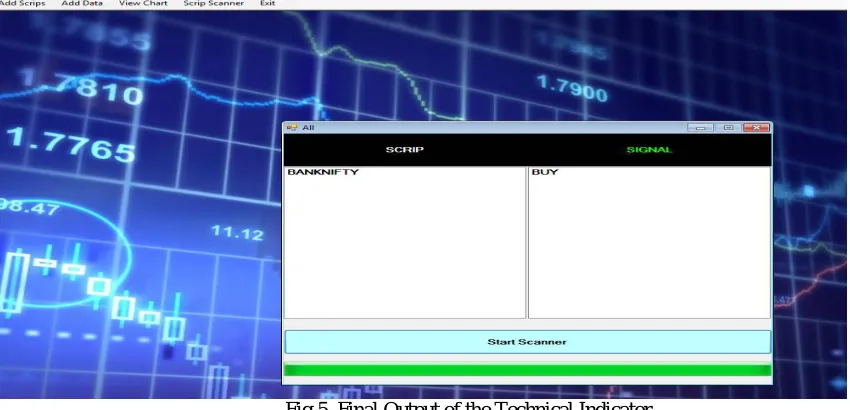
Fig 5. Final Output of the Technical Indicator
From the above fig, It is very easy to take the right decision for user with the efficiency of Technical Indicators. The above fig is captured by applying described advance CART algorithm. From the above algorithm it shows if user invest or buy for BANKNIFTY then User gets maximum profit
V. COMPARISONTABLE
VI.CONCLUSIONANDFUTUREWORK
Technical Analysis is based on the different technical indicators which gives the information about the future stock value. Based on the historical knowledge and information one can predict the perfect investment decision of the stock market at right time. The investment decision can be taken by proper technical analysis. By using the technical indicators the future market of securities would be known in which we are going to invest.
REFERENCES
1. Mansoor Ahmed, AnirudhSriram, Sanjay Singh “Towards a Generic Framework for Short TermFirm-Specific Stock Forecasting”2014 International Conference on Advances in Computing,Communications and Informatics (ICACCI)
2. K. Senthamarai Kannan, P. SailapathiSekar, M.MohamedSathik and P. Arumugam “Financial Stock Market Forecast using DataMining Techniques”procededing of the International MultiConference of Engineere and Computer Scientists 2010 VOL I,IMECS 2010,March 17-19,2010, Hong Kong
3. .KainazBomiSherdiwala “Data Mining Techniques in Stock Market” INDIAN JOURNAL OF APPLIED RESEARCH Volume :4,issue 8, August 2014sss-Yu Kuo and Chun Kuo “A Dynamic Stock Trading System based on a Multi-objectiveQuantum-Inspired Tabu Search Algorithm” 2014 IEEE International Conference on Systems, Man, and CyberneticsOctober 5-8, 2014, San Diego, CA, USA
4. WijnandNuij, ViorelMilea, Frederik Hogenboom, Flavius Frasincar, and UzayKaymak “An Automated Framework for IncorporatingNews into Stock Trading Strategies” IEEE TRANSACTIONS ON KNOWLEDGE AND DATA ENGINEERING, VOL. 26, NO. 4, APRIL 2014 5. Lean Yu, Huanhuan Chen, Shouyang Wang, and Kin Keung Lai “Evolving Least Squares Support Vector Machinesfor Stock Market Trend
Mining” IEEE TRANSACTIONS ON EVOLUTIONARY COMPUTATION, VOL. 13, NO. 1, FEBRUARY 2009
6. Aparna Anant Bhat,Sowmya Kamath S. “Automated Stock Price Prediction and TradingFramework for Nifty Intraday Trading” 4th ICCCNT – 2013July 4-6, 2013, Tiruchengode, India
7. Ibrahim M. HamedAshraf S. Hussein Mohamed F. TaIba “An Intelligent Model for Stock Market Prediction” ©2011 IEEE
8. Yung-Keun Kwon and Byung-Ro Moon, Member, IEEE” A Hybrid Neurogenetic Approachfor Stock Forecasting” IEEE TRANSACTIONS ON NEURAL NETWORKS, VOL. 18, NO. 3, MAY 2007
9. Pei-Chann Chang, Chin-Yuan Fan, and Chen-Hao Liu “Integrating a Piecewise Linear RepresentationMethod and a Neural Network Model forStock Trading Points Prediction” IEEE TRANSACTIONS ON SYSTEMS, MAN, AND CYBERNETICS—PART C: APPLICATIONS AND REVIEWS, VOL. 39, NO. 1, JANUARY 2009
10. J. Borsje, F. Hogenboom, and F. Frasincar, “Semi-AutomaticFinancial Events Discovery Based on Lexico-SemanticPatterns,” Int’l J. Web Eng. and Technology, vol. 6, no. 2,pp. 115-140, 2010.
11. Ibrahim M.Hamed , Ashraf S. Hussian ,Mohamed F. Tolba,, “An Intelligent Model For Stock Market Prediction”, IEEEE 2011
Book