Big Data Problems
Ismail B. Mustapha1,2,3, Shafaatunnur Hasan1,2,3, Siti Mariyam Shamsuddin1,2,3, Noel Lopes,4, Wong Yee Leng 1,2,3
1UTM Big Data Centre,
Ibnu Sina Institute for Scientific and Industrial Research Universiti Teknologi Malaysia 81310 Johor Malaysia.
2GPU Research Centre,
Universiti Teknologi Malaysia 81310 Johor Malaysia.
3Faculty of Computing,
Universiti Teknologi Malaysia, 81310 Johor Malaysia e-mail: [email protected], [email protected],
[email protected], [email protected]
4
Polytechnic of Guarda, Portugal e-mail: [email protected]
Abstract
The big data era has become known for its abundance in rapidly generated data of varying formats and sizes. With this awareness, interest in data analytics and more specifically predictive analytics has received increased attention lately. However, the massive sample sizes and high dimensionality peculiar with these datasets has challenged the overall performance of one of the most important components of predictive analytics of our present time, Machine Learning. Given that dimensionality reduction has been heavily applied to the problems of high dimensionality, this work presents an improved scheme of GPU based Multiple Back Propagation (MBP) with feature selection for big high dimensional data problems. Elastic Net was used for automatic feature selection of high dimensional biomedical datasets before classification with GPU based MBP and experimental results show an improved performance over the previous scheme with MBP.
Ismail et al. 83
1 Introduction
The drop in the cost of hardware/software tools coupled with the rapid advancement of the Internet and Information Technology have led to an explosive growth in generated data globally. Thus, 27% of the present world population which is in excess of 7.2 billion [1] are reported to be among the increasing internet users worldwide [2]. This has consequently revolutionized data generation in the likes of YouTube, Twitter, Weibo and other players in the social media industry. Similar trend in massive data generation has been reported in the fields of Particle Physics [3], Astronomy, genomics [4] and other fields of sciences. The increased digitalization of almost all daily activities in almost all spheres of human endeavour as it relates to business, commerce, medicine, public health and academics have further contributed to this data revolution. Thus, the term Big Data has become well known and often used to describe large datasets, structured or unstructured, that traditional data management /analytics systems struggle to process in a realistic time frame[5].
Fig. 1: Worldwide interest in big data, predictive analytics and machine learning based on web search on Google between 2004 to November 2015
outcomes based on historical data [8], has not only yielded dividends for companies who now improve their business through insights from their large transactional database but also attracted research interest from the research community due to need for more robust, stable and scalable predictive tools in the big data era. Fig 1 is a reflection of this salient fact. It shows the worldwide interest in the terms big data, predictive analytics and machine learning based on web search on Google between 2004 to November 2015. The pattern in the web search count for all the three variables in the graph shows an increasing trend in the last couple of years.
Nature inspired machine learning algorithms, like the feed forward Neural Networks (NN) variants have witnessed a shift from latency oriented implementation (Central Processing Unit) to throughput oriented implementation, like Graphics Processing Unit (GPU), in recent years [9]; notably to take full advantage of the parallel processing capability of the latter for speedy training of big data. Here, the performance of one of such GPU implementations, a variant of the Back Propagation Neural Network (NN), called Multiple Back Propagation (MBP) [9] on a big data platform is examined in the light of its performance on high dimensional datasets. An improved scheme of GPU based Multiple Back Propagation (MBP) with feature selection for big high dimensional data problems is proposed and evaluated with known evaluation metrics.
The organization of this paper is as follows; Section 2 outlines the previous related works on MBP. Section 3 presents the proposed improved scheme while the dataset and methods of the research are discussed in Section 4. Finally, the experimental results and conclusions are presented in Section 5 and 6 respectively.
2 Related Work
Ismail et al. 85
in feature/dimensionality reduction as a solution to datasets with high dimensionality [19] has formed the motivation for this work.
3 The Improved Scheme
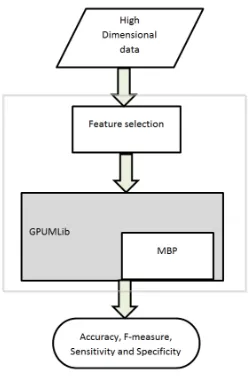
The improved scheme of high dimensional data classification proposed in this work is illustrated pictorially in Fig. 2 and described in details here.
Fig. 2: An improved scheme of high dimensional data classification
Feature Selection. For any given high dimensional dataset, the scheme performs feature selection after which the selected predictors are passed on to the GPU based classifier. In this work we perform automatic feature selection by leveraging the built in feature selection capability of elastic net(enet) model [20] in the fscaret package [21]. The choice of enet as the feature selection method has been carefully made due to its good performance on high dimensional datasets with low sample sizes. The feature ranking process is summarized as follows;
• Provide input dataset and a few settings. For this study, the setting are;
75% of dataset was used for training and the rest as testing set Time limiting function was set to 100000s
Preprocess data function set to TRUE Feature selection was done with enet Model
• Models are built
• Variable rankings are drawn out of the models • Generalization error is calculated for each model
GPUMLib.
GPUMLib is an open source GPU based Machine Learning Library. This library which was developed using NVidia CUDA C++ provides range of machine learning tools for researchers and practitioners who wish to take advantage of the extreme parallelism offered by the GPU on compute-intensive tasks. A number of Machine learning algorithms have been implemented on the GPUMLib, notably of which are Back propagation NN, MBP, SOM and SVM amongst others. Its source code and other relevant details can be obtained at http://gpumlib.sourceforge.net/.Fig. 3:A graphical representation Multiple feed forward network with the space and main networks.[22]
Multiple Back Propagation (MBP).
The MBP is a generalization the BPsince it combines two Feed Forward networks (Fig 3); the space network and the main network. Both networks whose topology might not necessarily be the same receive the same input pattern. Neurons of the main network are assigned actuations and the space network calculates the importance, importance factor (mpj ), of each actuation neuron for each pattern fed to the network (Equation (1)).
Hence, the actuation neurons of the main network respond differently to different input pattern. More details on MBP can be found in [22].
xpj =m gjp jp(apj) (1)
Ismail et al. 87
result found so far. This comparison is used as a basis for the adjustment of the hidden neurons of the next NN. The process is repeated until the stopping criteria are met (Lopes & Ribeiro, 2015).
For this work, we initially classify each benchmark dataset without feature selection after which feature selection is performed and the selected features were classified using MBP; starting from the highest ranked 200 features, a stepwise increment of 200 features followed in descending order of importance. This process was repeated for all benchmark datasets. In addition, only 2 layered MBP networks with maximum of 10000 iterations were trained 100 times and the reported results reflects the average of the 100 trained networks with their corresponding time. Also worthy of mention is that the hidden neuron, J, for all networks was initially set to 100 after which the ATS is allowed to search for the best during the course of training.
4 Dataset
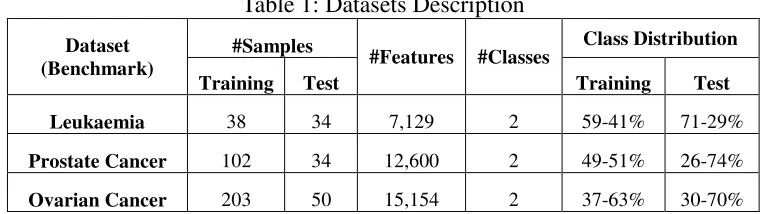
In a bid to ensure comparability of the Improved scheme classification scheme with the previous scheme, three high dimensional datasets used by [16] have been chosen and described in Table 1. These Leukemia, Prostate cancer and ovarian cancer datasets can be obtained from http://datam.i2r.a-star.edu.sg/datasets/krbd/. Fig 3 depicts a heatmap of each dataset after hierarchically clustering the features with Pearson distance function.
The Leukemia dataset consist a total of 72 bone marrow samples each of which represents 7129 probes of 6817 human genes. The classification task it presents is to differentiate between an Acute Lymphocytic Leukemia (ALL) and Acute Myeloid Leukemia (AML). As shown in Table 1, 38 of these samples represent the training set (27 AML and 11 ALL) while the remaining 34 samples (14 AML and 20 ALL) are the testing set. The Prostate cancer dataset presents a normal versus tumor classification problem with 12600 features. The training set consists of 102 samples of which 50 are normal while 52 are prostate tumor samples. The test dataset was extracted from an entirely different experiment, thus a microarray intensity difference of over 10 times difference from the training set has been recorded. This disparity can be seen in heat map in Fig 4(b). The classification
Table 1:Datasets Description
Dataset (Benchmark)
#Samples
#Features #Classes Class Distribution
Training Test Training Test
Leukaemia 38 34 7,129 2 59-41% 71-29%
Prostate Cancer 102 34 12,600 2 49-51% 26-74%
task brought by the Ovarian cancer dataset has to do with the identification proteomic patterns in serum that distinguishes a cancerous ovarian from a non-cancerous one. From the 253 mass spectroscopy generated samples, 203 samples (70 normal and 132 cancerous) have been chosen as training set and 50 samples (15 normal and 35 cancerous) held out as testing set in this experiment.
Fig. 4: Images of different intensity in training set
5 Experimental Results and Discussions
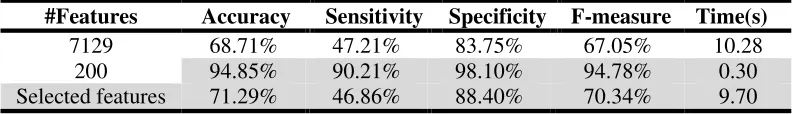
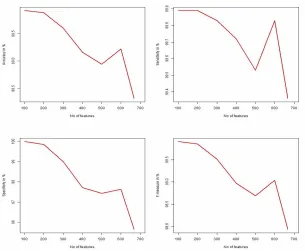
For the leukemia dataset, an ordered ranking, from highest to lowest, of 6936 most relevant features were selected from the total 7129 features. Table 2 shows the results obtained on the entire feature space (first on the table), all selected features and the best subset of the leukemia dataset. The performance of MBP on the leukemia benchmark with varying feature sizes is also depicted in Fig 5. While the performance of the model steadily drop as we vary the selected features in descending order of their importance, a sharp drop in performance is observed across all evaluation metrics on the 1200 highly ranked features. This is indicated by the steep similar position in Fig 5. That the model sharply recovers on the 1400 most relevant features might indicate that a group of correlated features were separated on the 1200 features. The improved scheme shows some performance improvement as the features reduce to the most important ones with peak accuracy and specificity of 94.85% and 98.10% respectively.
Table 2: Experimental results of Leukemia Dataset
#Features Accuracy Sensitivity Specificity F-measure Time(s)
Ismail et al. 89
Fig. 5:Evolution of Accuracy, Sensitivity, Specificity and F-measure for Leukemia dataset
In the case of the prostate cancer dataset, a total number of 6757 features of the total 12600 feature were select and ranked in a descending order of importance after feature selection with enet. Table 3 shows the results obtained on the entire dataset without feature selection, all the selected features and the best subsets of the selected features. From the table, MBP shows better performance with selected features over the whole dataset in terms of Specificity (81.38%) and F-measure (64.31%). However, by narrowing the selected features to the most relevant 200 and 400 features respectively, the improved scheme generally performs better on all evaluation metrics and shorter time interval. Fig 6 shows the performance of the various metrics as we increase the selected features in descending order of their importance. The trend reveals general performance improvement as the feature size reduces to the most relevant.
Table 3: Experimental result of Prostate Cancer Dataset
#Features Accuracy Sensitivity Specificity F-measure Time(s)
Fig. 6:Evolution of Accuracy, Sensitivity, Specificity and F-measure for Prostate Cancer
Only a total of 667 out of a total of 15154 features were selected and ranked in descending order of importance on applying enet feature selection on the ovarian benchmark. Due to the size of the selected features and to further study the performance of the proposed scheme with varying number features, we split the selected features into multiples of 100 in a decreasing order of importance as ranked by the feature selection technique. Table 4 shows the result of the evaluation entire feature space (first on the table), all selected features and the best subset of the benchmark. An improvement in classification performance is observed on the selected features and a peak performance is recorded on the most relevant 100 features by enet standard. The trend in Model performance as the number of feature changes is shown in Fig 7.
Table 1: Experimental result of Ovarian Cancer Dataset
#Features Accuracy Sensitivity Specificity F-measure Time
Ismail et al. 91
Fig. 7:Evolution of Accuracy, Sensitivity, Specificity and F-measure for Ovarian Cancer dataset
In comparison to the previous scheme, specifically the work of [16], the proposed scheme with feature selection generally performs better across all evaluation metrics especially when the feature space is narrowed down to the most highly ranked ones.
6 Conclusion
ACKNOWLEDGEMENTS
The authors would like to thank the Universiti Teknologi Malaysia (UTM) for their support in Research and Development, UTM Big Data Centre and the Soft Computing Research Group (SCRG) for the inspiration in making this study a success. This work is supported by Ministry of Higher Education (MOHE) under Fundamental Research Grant Scheme (FRGS 4F802 and FRGS 4F786).
References
[1] worldometers. World Population Clock: 7 Billion People (2015). 2015 [cited 2015 02-May]; Available from: http://www.worldometers.info/world-population/.
[2] Internet live stats. Internet Users in the World. 2015 [cited 2015 02-Oct]; Available from: http://www.internetlivestats.com/internet-users/.
[3] Cian O'Luanaigh. Animation shows LHC data processing. 2015 [cited 2015
03-Oct]; Available from:
http://home.web.cern.ch/about/updates/2013/04/animation-shows-lhc-data-processing.
[4] Stephens, Z.D., et al., Big Data: Astronomical or Genomical? PLoS Biol, 2015. 13(7): p. e1002195.
[5] Chen, M., S. Mao, and Y. Liu, Big data: A survey. Mobile Networks and Applications, 2014. 19(2): p. 171-209.
[6] Joshua Chambers. Malaysia launches Big Data Lab, national analytics
network. 2015 [cited 2015 29 Apr]; Available from:
http://www.futuregov.asia/articles/6096-malaysia-launches-big-data-lab-national-analytics-network.
[7] House, W., Fact Sheet: Big Data Across the Federal Government. 2012, Mar.
[8] sas. Predictive Analytics: What it is and why it matters. 2015 [cited 2015 1-Dec]; Available from: http://www.sas.com/en_us/insights/analytics/predictive-analytics.html.
[9] Lopes, N. and B. Ribeiro, GPU implementation of the multiple back-propagation algorithm, in Intelligent Data Engineering and Automated Learning-IDEAL 2009. 2009, Springer. p. 449-456.
[10]Lopes, N. and B. Ribeiro, An evaluation of multiple feed-forward networks on GPUs. International journal of neural systems, 2011. 21(01): p. 31-47.
Ismail et al. 93
[12]Scanzio, S., et al., Parallel implementation of Artificial Neural Network training for speech recognition. Pattern Recognition Letters, 2010. 31(11): p. 1302-1309.
[13]Roberto, B., et al., A Feed Forward Neural Network in CUDA for a Financial Application. Blucher Mechanical Engineering Proceedings, 2014. 1(1): p. 4471-4482.
[14]Nabiyouni, M. and D. Aghamirzaie. A highly parallel multi-class pattern classification on gpu. in Proceedings of the 2012 12th IEEE/ACM International Symposium on Cluster, Cloud and Grid Computing (ccgrid 2012). 2012. IEEE Computer Society.
[15]Lopes, N. and B. Ribeiro, Fast pattern classification of ventricular arrhythmias using graphics processing units, in Progress in Pattern Recognition, Image Analysis, Computer Vision, and Applications. 2009, Springer. p. 603-610.
[16]Hasan, S., S.M. Shamsuddin, and N. Lopes, Soft Computing Methods for Big Data Problems, in GPU Computing and Applications. 2015, Springer. p. 235-247.
[17]Lopes, N., B. Ribeiro, and R. Quintas. GPUMLib: a new library to combine machine learning algorithms with graphics processing units. in Hybrid Intelligent Systems (HIS), 2010 10th International Conference on. 2010. IEEE.
[18]Bolón-Canedo, V., N. Sánchez-Maroño, and A. Alonso-Betanzos, Recent advances and emerging challenges of feature selection in the context of big data. Knowledge-Based Systems, 2015.
[19]Fokoue, E., A Taxonomy of Big Data for Optimal Predictive Machine Learning and Data Mining. arXiv preprint arXiv:1501.00604, 2015.
[20]Zou, H. and T. Hastie, Regularization and variable selection via the elastic net. Journal of the Royal Statistical Society: Series B (Statistical Methodology), 2005. 67(2): p. 301-320.
[21]Szlek, J., A short fscaret package introduction with examples. 2015.
![Fig. 3: A graphical representation Multiple feed forward network with the space and main networks.[22]](https://thumb-us.123doks.com/thumbv2/123dok_us/1339298.1166877/5.595.204.379.235.363/fig-graphical-representation-multiple-forward-network-space-networks.webp)