University of Windsor University of Windsor
Scholarship at UWindsor
Scholarship at UWindsor
Electronic Theses and Dissertations Theses, Dissertations, and Major Papers
1-1-1980
Hydraulics of floating boundaries.
Hydraulics of floating boundaries.
Mohamed Reda Ibrahim Haggag University of Windsor
Follow this and additional works at: https://scholar.uwindsor.ca/etd
Recommended Citation Recommended Citation
Haggag, Mohamed Reda Ibrahim, "Hydraulics of floating boundaries." (1980). Electronic Theses and Dissertations. 6121.
https://scholar.uwindsor.ca/etd/6121
This online database contains the full-text of PhD dissertations and Masters’ theses of University of Windsor students from 1954 forward. These documents are made available for personal study and research purposes only, in accordance with the Canadian Copyright Act and the Creative Commons license—CC BY-NC-ND (Attribution, Non-Commercial, No Derivative Works). Under this license, works must always be attributed to the copyright holder (original author), cannot be used for any commercial purposes, and may not be altered. Any other use would require the permission of the copyright holder. Students may inquire about withdrawing their dissertation and/or thesis from this database. For additional inquiries, please contact the repository administrator via email
HYDRAULTCS OF FLOATING BOUNDARIES
A D is s e rta tio n
Submitted to the Faculty o f Graduate Studies through the Department o f C iv il Engineering in P a r tia l F u lfilm e n t
o f the Requirements fo r the Degree o f Doctor o f Philosophy a t the
U n iv e rs ity o f Windsor
by
Mohamed Reda Ibrahim Haggag
B.Sc. (Honour), M.A.Sc, P. Eng.
Windsor, O n ta rio , Canada 1980
UMI Number: DC53214
INFORMATION TO USERS
The quality of this reproduction is dependent upon the quality of the copy submitted. Broken or indistinct print, colored or poor quality illustrations and photographs, print bleed-through, substandard margins, and improper alignment can adversely affect reproduction.
In the unlikely event that the author did not send a complete manuscript and there are missing pages, these will be noted. Also, if unauthorized copyright material had to be removed, a note will indicate the deletion.
UMI Microform DC53214 Copyright 2009 by ProQuest LLC
All rights reserved. This microform edition is protected against unauthorized copying under Title 17, United States Code.
ProQuest LLC
789 East Eisenhower Parkway P.O. Box 1346
Ann Arbor, Ml 48106-1346
( c ) Mohamed Reda Ibrahim Haggag 1980
7 5 3 0 3 6
ABSTRACT
The problems associated w ith the hydraulics o f flo a tin g bound
a rie s as w ell as the flow in covered channels were in v e s tig a te d theo
r e t i c a l l y and experim entaly.
A mathematical model was developed to p re d ic t the v e lo c ity and
shear p r o file s in two and th ree dimensional channels. An em pirical
f r i c t i o n fa c to r fo r the cover underside th a t accounts f o r both the skin
and form resistances was introduced. To aid in solving these models, a
method f o r estim ating the composite roughness was also presented.
A g en eralized non-uniform flow equation was developed to p re d ic t
the sedimentary p a tte rn in channels w ith loose flo a tin g covers. A study o f
the behavior o f an arrested block a t the leading edge o f the cover was
also presented. The d if f e r e n t forces and the s t a b i l i t y conditions were
in v e s tig a te d fo r a general block s t a b i l i t y case.
A comprehensive experimental program was c a rrie d out to v e r if y
the developed mathematical models and to aid in o btaining the necessary
em pirical c o e ffic ie n ts . Based on these experim ents, an em pirical r e la tio n
f o r the block s t a b i l i t y problem, was also obtained. Good agreement was
found between the theory and the experimental data w ith in the tested
lim it s .
i i
To my w ife ,
w ith a l l my lo v e , THANK YOU
ACKNOWLEDGEMENTS
I wish to express my appreciation and g ra titu d e to my advisor
Dr. S. P. Chee fo r his continuous and p a tie n t guidance throughout
the course o f my study. My adm iration and thanks to him go f a r beyond words.
The encouragement and support o f Dr. C. M aclnnis, Dean o f
Engineering, and Dr. J . McCorquodale are s in c e re ly appreciated.
I also wish to thank the C iv il Engineering Department technicians Mr. G. Michalczuk and Mr. P. Feimer fo r t h e ir help during the
experimental in v e s tig a tio n .
The fin a n c ia l support o f the National Research Council and the
C iv il Engineering Department o f the U n iv e rs ity o f Windsor is
appreciated.
The encouragement o f my parents and my m other-in-law is g re a tly
appreciated.
F in a lly , I am deeply g ra te fu l to my w ife fo r her assistance,
Patience and understanding. I am very thankful fo r her e f f o r t in typing
th is th e s is , and I t r u ly appreciate her constant support.
TABLE OF CONTENTS
PAGE
ABSTRACT i i
ACKNOWLEDGEMENTS i i i
TABLE OF CONTENTS iv
LIST OF FIGURES ix
LIST OF TABLES x i i i
CHAPTER I : INTRODUCTION 1
1.1 D efinition of the Problem 1
CHAPTER I I : LITERATURE SURVEY 4
2.1 Definitions and Basic Assumptions 4
2.2 Velocity P rofiles in Covered Channels 6 2.3 Underside Configuration and Friction Factor 9
2.4 In s ta b ility of Cover Blocks 15
2 .4 .1 Generalized Formula 19
CHAPTER H I : THEORETICAL INVESTIGATION 24
3.2 Flow Pattern 26
3 .2 .1 General Approach 26
3 .2 .2 Two Dimensional Determination of
Velocity P ro file 29
3 .2 .3 General Solution 35
3.3 Cover Underside Friction Factor 37
3 .3 .1 The Friction Factor Expression 39
iv
Table o f Contents Continued: PAGE
3 .4 Underside C o n fig uration o f Loose Cover 42
3 .4 .1 D e riv a tio n o f General Equation 42
3 .4 .2 The Energy Slope 45
3 .4 .3 Determ ination o f the Boundary F r ic tio n 47
3 .4 .3 .1 The Cover Subsection 47
3 .4 .3 .2 The Bed Subsection 50
3 .4 .4 The General S o lu tio n 52
3 .5 The Growth o f the Cover and I t s Mechanism 52
3 .5 .1 Modes o f I n s t a b i l i t y 54
3 .5 .2 General P o s itio n o f the Block 59
3 .5 .3 Forces A cting on the Block 61
3 .5 .4 S t a b i l i t y C r it e r ia 61
3 .5 .5 Numerical S o lu tion 64
CHAPTER IV : EXPERIMENTAL INVESTIGATION 67
4 .1 In tro d u c tio n 67
4 .2 The Test Equipment 67
4 .2 .1 Laboratory F a c il i t ie s 67
4 .2 .1 .1 The 18 Inch Flume 67
4 .2 .1 .2 The 6 Inch Flume 69
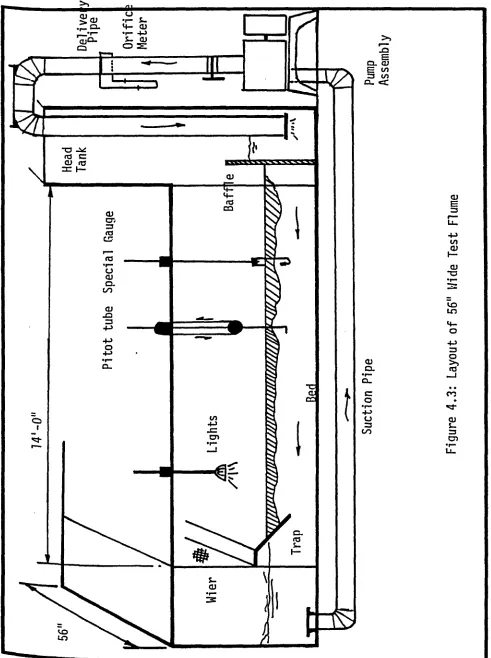
4 .2 .1 .3 The 56 Inch Flume 69
4 .3 The Measuring Equipment 72
4 .3 .1 P oint Gauges 72
4 .3 .2 P ito t-tu b e 72
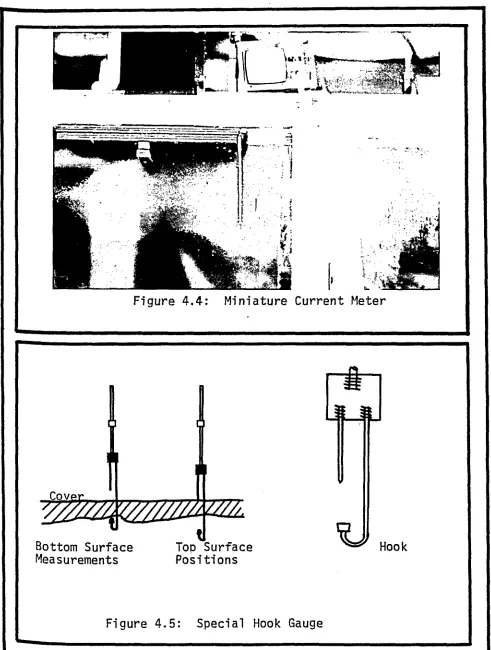
4 .3 .3 M in ia tu re Current Meter 72
v
Table o f Contents Continued: PAGE
4 .3 .4 Loose Cover Underside C o n fig uration 72
4 .3 .5 The Shear Apparatus 72
4 .4 Experimental Program 72
4 .4 .1 Study o f the V e lo c ity P r o file s 75
4 .4 .2 Study o f the Cover Underside Roughness 75
4 .4 .3 Study o f the Cover Underside C o n fig u ratio n 77
4 .4 .4 Study o f Block S t a b i l i t y 80
4 .5 Experimental Results 82
4 .6 Experimental E rrors 82
CHAPTER V: DISCUSSION OF THEORITICAL AND EXPERIMENTAL RESULTS 83
5 .1 Flow P atterns 83
5 .1 .1 Two Dimensional S o lu tion s 83
5 .1 .2 General Flow P attern s 88
5 .1 .2 .1 E ffe c t o f Channel Roughness 89
5 .1 .2 .2 E ffe c t o f Channel S ize 93
5 .1 .2 .3 E ffe c t o f Channel Geometry 93
5 .1 .3 Comparison w ith Measured Results 102
5 .2 F r ic tio n F actor f o r the Cover Underside 102
5 .2 .1 Determ ination o f the Constants 102
5 .2 .2 Behavior o f the F r ic tio n Factor Equation 107
5 .3 Underside C o n fig u ratio n 108
5 .3 .1 D ire c t In te g r a tio n Method 109
5 .3 .2 D ire c t Step Method 110
vi
Table o f Contents Continued: PAGE
5 .3 .3 General Remarks on P red icted C o n fig u ratio n 116
5 .3 .4 Three-Dimensional Underside C o n fig uration 119
5 .4 E q u ilib riu m Thickness and Extension Mechanism 122
5 .4 .1 Behavior o f the Model 122
5 .4 .2 Modes o f I n s t a b i l i t y 123
5 .4 .3 Numerical S o lu tio n 126
5 .4 .4 Comparison w ith Experimental Data 128
5 .5 Remarks on Discussion o f T h e o r itic a l and
Experimental Data 139
CHAPTER V I: EMPIRICAL RELATIONS 142
6 .1 A nalysis o f Block S t a b i l i t y 142
6 .1 .1 Uniform Submergence Analysis 142
6 .1 .2 Submergence w ith R otation 145
6 .2 Results 145
6 .2 .1 Modes o f I n s t a b i l i t y 145
6 .2 .2 Blocks w ith Rectangular Edge 146
6 .2 .3 Blocks w ith C ir c u la r Edge 146
6 .2 .4 Blocks w ith 1:1 Edge 146
6 .2 .5 Blocks w ith 2:1 Edge 150
6 .2 .6 Upturning I n s t a b i l i t y Mode 150
6 .3 Behavior o f th e Equations 152
CHAPTER V I I : CONCLUSIONS AND RESEARCH REMARKS 161
7 .1 Conclusions 161
v i i
Table o f Contents Continued; PAGE
7 .2 Remarks on Further In v e s tig a tio n s 162
APPENDIX A; METHODS OF COMPUTING THE SEPARATION LINE
AND COMPOSITE ROUGHNESS 164
APPENDIX B: FORCES AND MOMENTA ACTING ON BLOCKS ARRESTED
AT THE LEADING EDGE OF THE COVER 169
APPENDIX C: LIST OF NUMERICAL PROGRAMS 180
APPENDIX D: EXPERIMENTAL ERRORS: THEIR SOURCES AND
EVALUATION 190
APPENDIX E: EXPERIMENTAL RESULTS 193
APPENDIX F: NOMENCLATURE 216
APPENDIX G: REFERENCES 221
vi i i
1 TST OF FIGURES
figure
1.1 D e fin itio n o f the Problem
2.1 D e fin itio n Sketch
2 .2 Uniform Flow in Channels
2.3 Behavior o f Generalized Function A
2 .4 Behavior o f Generalized Function B
3.1 D e fin itio n Sketch
3 .2 General Technique fo r V e lo c ity P r o file Determination
3.3 Two-Dimensional Shear D is trib u tio n
3.4 V e lo c ity P r o file Functions
3.5 Flow-Chart fo r Flow Patterns
3.6 General Cross-Section
3 .7 Cover Underside F ric tio n Factor
3 .8 Cover Underside Configuration
3.9 Average and Actual Energy Lines
3.10 Forces on Each Subsection
3.11 D e fin itio n s and O rigin al Position
3.12 Basic Step Displacements o f Block
3.13 Modes o f In s t a b ilit y
3.14 Edge Breaking
5.15 Point o f Rotation
PAGE 2 5 11 22 23 25 27 31 34 37 38 41 43 46 48 53 55 57 58 58 ix
Figure (Continued)
3.16 General Position o f a Point
3.17 Forces on Block
3.18 S t a b ilit y C r ite r ia and Range
4.1 Layout o f 18" Wide Test Flume
4.2 Layout o f 6" Wide Test Flume
4.3 Layout o f 56" Wide Test Flume
4.4 M iniature Current Meter
4.5 Special Hook Gauge
4.6 Shear Apparatus
4 .7 Determination o f ng
4.8 Loose Cover Traps
4.9 Typical Dimensions o f Dune Bed-form
4.10 D iffe r e n t Edges Used in In s t a b ilit y Study
5.1 E ffe c t o f Boundary Roughness
5.2 E ffe c t o f R e la tive Roughness
5.3 V e lo c ity Comparison,with Experimental Data
5.4 V e lo c ity Comparison w ith L ite ra tu re
5.5 V e lo c ity P r o file in Channel
5.6 V e lo c ity P r o file in Covered Channel
5.7 Rectangular Covered Channel V e lo c ity P r o file
5.8 E ffe c t o f Cover Roughness on V e lo c ity P r o file
5.9 E ffe c t o f Side Roughness on V e lo c ity P r o file
5.10 E ffe c t o f Channel Size and Roughness on V e lo c ity
PAGE 60 62 65 68 70 71 73 73 74 76 78 79 81 85 85 86 87 90 91 91 92 94
P r o file 95
x
Figure (Continued)
5.11 E ffect of Size and Roughness on Velocity P ro file 96
5.12 E ffect of Channel Size on Velocity P ro file 97 5.13 Trapezoidal Channel Velocity P ro file 98 5.14 Compound Trapezoidal Channel Velocity P ro file 99
5.15 Triangular Channel Velocity P ro file 1°0
5.16 Compound Triangular Channel Velocity P ro file 101
5.17 Velocity Comparison fo r Trapezoidal Channel 103
5.18 Velocity Comparison fo r Compound Trapezoidal Channel 103 5.19 Velocity Comparison fo r Triangular Channel 104 5.20 Velocity Comparison fo r Compound Triangular Channel 104
3.21 Form Resistance Function 103
5.22 Underside Configuration, F la t Bed 111
5.23 Underside Configuration, Triangular Bed-form 115
5.24 Underside Configuration fo r Dune Bed-form 117
5.25 Underside Waves fo r Dune Bed-form 117
5.26 Underside Configuration, Dune Bed-form Example 110 5.27 Underside Configuration, Dune Bed-form 120
3.28 Three-Dimensional Configuration 121
3.29 Underturning In s ta b ility 124
5.30 Upturning In s ta b ility 124
5.31 Second Thickenning Process 125
5.32 Group In s ta b ility 127
xi
Figures (Continued) £A£i.
5.33 Edge Forces 129
5.34 Shear on Block Underside 151
5.35 Horizontal Reaction on the Cover 132
5.36 Undercover Pressure 133
5.37 Length Effect on S ta b ility 135
5.38 Length Effect on S ta b ility 136
5.39 Thickness to Depth Ratio Effect 137
5.40 Variation of A 138
5.41 Rating Curves 140
5*1 Definitions and Notations 143
6.2 M-Function For Rectangular Edge 147
6.3 M**Function For Circular Edge 148
6.4 M-Function fo r 1:1 Edge 149
6.5 Results for 2:1 Edge 151
6.6 M-Function for Upturn Mode 153
5*7 Comparison Between Literature and Experimental
Results for Rectangular Edge 156
8.8 Comparison Between Literature and Experimental
Results for Circular Edge 157
8»9 Comparison Between Literature and Experimental
Results .'for 1:1 Edge ’ 158
6.10 Comparison Between Literature and Experimental
Results for 2:1 Edge 159
5.11 S ta b ility Comparison for the Theory and Literature 160
x ii
LIST OF TABLES
TABLE PAGE
2-1 Generalized S ta b ility Equations 20
5.1 Details of Direct Step Method Calculations 112
5.2 Calculations with Rectangular Bed-form 114 5.1 General Expression fo r Underturning Mode 154
5.1 Friction Factor Data 195
5.2 Underside Friction Factor Data 196
5.3 Underside Configuration, Triangular Bed-form 197 5.4 Three-Dimensional Underside Configuration 200
5.5 Pressure Distribution Under Cover 205
5.6 Maximum Block S ta b ility Conditions 207
x i i i
CHAPTER I
INTRODUCTION
INTRODUCTION
Much o f the e a r th 's surface experiences an n ually re c u rrin g
Periods o f low temperatures which r e s u lt in p a r t ia l o r t o t a l fre e z in g o f
a g re a t number o f n a tu ra l bodies o f w a te r, and in the form ation o f a
flo a tin g boundary on i t s surface c a lle d ic e cover.
Ice covers are not the only known types o f f lo a tin g boundaries.
F lo atin g p la n ts such as the N ile Rose or tr e e logs tra n s p o rte d by r iv e r s
are o th e r types o f f lo a tin g covers. This work is an in v e s tig a tio n o f the
Problems o f f lo a tin g boundaries w ith d ir e c t a p p lic a tio n to ic e covers.
D e fin itio n o f the Problem
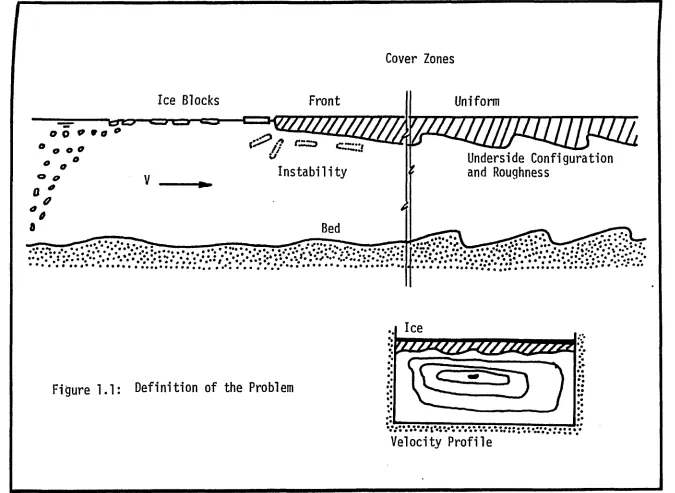
In an open channel, Figure 1 .1 , when th e tem perature drops to
° r below a c e rta in p o in t w ater s ta r ts to fr e e z e , forming ic e . The ice
accumulates, forming ic e flo e s which tr a v e l downstream u n til they s t r ik e
an obstacle th a t stops them and the form ation o f an ic e cover begins.
The form ation o f ic e covers is always associated w ith many
h y d ra u lic problems. One o f the key problems is the flow p a tte rn ; th a t
i s , the v e lo c ity and shear p r o f ile s . These p r o f il e s , in tu r n , depend
°n the sedimentary p a tte rn in the channel as w e ll as the f r i c t i o n fa c to rs
o f the d if f e r e n t boundaries.
On the o th e r hand, when an ic e block reaches an e x is tin g cover,
i t e ith e r remains s ta b le and extends the cover o r rid e s above o r turns
under the cover to thicken i t . This depends on i t s p ro p e rtie s and the flow
co nditions.
1
Re pr od uc ed w ith pe rm is si o n of th e co py ri gh t o w ne r. Fu rthe r rep roduction p ro h ib it e d wi th ou t p e rm is s io n .
(---Cover Zones
Ice Blocks
1 ,Mly—
O
o
9 9 0 °o o o
O
o o
- *
Front
V IlnHprsiHp rnnfinnratinn
In s ta b ility
0
fl Bed
.*. *•*.*•* - f c S ...*.*•
... .. ... . . » . . v • • • • • • • • • • • • » • • • • • • • • •
Uniform
Underside Configuration and Roughness
+ T y /, v \ _ • • •• . w
r.'T.v, •• ••
... •* • ••••••• o
Figure 1.1: Definition of the Problem
J jc e
• • •• ••♦*-*••• • • • • • • • • • • • • • • • • •
Velocity P ro file
3
Although the ice cover problem has many other aspects, these
Problems are among the more basic ones that warrant further investigation. This thesis deals only with these aspects of the problem.
The thesis w ill proceed with the development of the theoretical
model, which is presented in Chapter I I I , a fte r reviewing the lite ra tu re in Chapter I I . Then the experimental investigation w ill be described in Chapter IV , followed by the analysis of the model and its results in Chapter V. An empirical relatio n to predict the leading edge s ta b ility
condition is presented separately in Chapter VI.
The necessary mathematical details and computer program lis tin g s along with the analysis of the s ig n ifica n t error lim its o f the experimental
results are presented in separate appendices in order not to disturb the
fluency of the subject presentation.
CHAPTER I I
LITERATURE SURVEY
I I LITERATURE SURVEY
This chapter reviews some o f the l i t e r a t u r e th a t deals w ith those
ice cover problems mentioned in Chapter I . For the sake o f s im p lic ity the
notations used in the d if f e r e n t l i t e r a t u r e re p o rts were m odified to agree
with those adopted in th is th e s is .
2,1 D e fin itio n s and Basic Assumptions
In a l l the l i t e r a t u r e surveyed c e rta in basic assumptions w ith
regard to ice-co vered channel flo w were, g e n e ra lly agreed upon. These
assumptions can be summarized as fo llo w s :
The flo w in an ice-co vered channel is g r a v ity open channel flow w ith
a f lo a t in g boundary. Only g r a v ity fo rces can e x is t and no pressure
g ra d ie n t w il l be found.
2- The channel c ro s s-s ec tio n can be d iv id e d in to two subsections, Figure
2 .1 . Subsection (1 ) flow s under the e f f e c t o f the bottom and s id e s ,
w hile subsection (2 ) is dominated by the cover.
3 * The separation surface between the two subsections is the locus o f no
shear. With referen ce to a v e r t ic a l lin e i t is also the locus o f the
points o f maximum v e lo c ity .
4- The equations o f c o n tin u ity , momentum and energy can be ap p lie d to the
channel c ro s s -s e c tio n in t o t a l and to each subsection on i t s own.
In a d d itio n some common assumptions are ap p lie d to each s p e c ific
Pr oblem associated w ith the cover. These s p e c ific assumptions w i l l be
4
5
Presented a t the a p p ro p ria te p o in t.
The d if f e r e n t v a ria b le s used in th is work and the notatio ns
given to them are shown in Figure 2 .1 and lis t e d in Appendix F. In
ad d itio n an exp lanatio n o f each n o ta tio n w il l be presented when i t
f i r s t appears.
2-2 V e lo c ity P r o file s in Covered Channels
As e a r ly as 1938, B e lo k o n (.a fte r(3 9 )) adopted a power-1 aw v e lo c ity
d is tr ib u tio n w ith an exponent o f 1 .5 f o r each subsection. He also
suggested th a t the mean v e lo c itie s o f each subsection are equal and
also equal to th a t o f the t o ta l channel, i . e . = Vg = V, an assumption
which became very popular l a t e r in s p ite o f i t s inaccuracy.
In 1948, Levi ( a f t e r ( 3 9 ) ) , considering the case o f a wide
channel, a p p lie d a lo g a rith m ic v e lo c ity p r o f il e in the form
u.j (y i ) = ( V * . / / 2 k ) Ln y . / k . , i = 1 ,2 2 .1
where, k = Von Karman's c o n sta n t,
k. = roughness h e ig h t,
V *i = shear v e lo c it y ,
u.j = v e lo c ity a t p o in t y^ away from the boundary,
and i = 1 o r 2 , and re fe rs to the bed and cover subsections
re s p e c tiv e ly .
This equation was used to p re d ic t the mean v e lo c ity and hence
to develop an expression f o r the composite roughness.
In 1959, Barrows e t a T ( a f t e r ( 2 ) p re s e n te d some f i e l d measurements
7
o f the v e lo c ity p r o file s a t Chemung R iv e r, N .Y ., during d if f e r e n t stages
o f ice fo rm a tio n . They gave only d e s c rip tiv e analyses o f t h e ir data and
suggested the use o f a p a ra b o lic v e lo c ity p r o f il e . Also in 1964, Devik
(2) reported f i e l d measurmenets o f v e lo c ity p r o file s in r iv e r s .
Synotin (32) in 1965 suggested th a t the v e lo c ity s tru c tu re o f the
flow under the ic e cover can be described by th e r e la tio n
V . / V ^ = 6 .4 5 Log Yi / k i + 5 .6 + 2 .8 (1 - ^ / Y . ) , i = 1 ,2 2 .2
which was developed using Russian data obtained by N i k i t i n .
In 1966, Carey (4 ) a ffirm e d once more the suggestion th a t the
mean v e lo c itie s o f each subsection are equal and equal to th a t o f the
to ta l channel. He also suggested the use o f the Karaman-Prandtl lo g ra ith m ic
v e lo c ity p r o f ile and re s is ta n c e equation.
Hancu ( a f t e r (3 9 )) in 1937., suggested the a p p lic a tio n o f the
v e lo c ity d e fe c t law to each subsection as fo llo w s
Vmax " “ 1 ^ 1 * = ( V*i/K } Ln V Yi * 1 = 1 »2 2 ‘ 3
He also presented some graphs which can be used to estim ate
Yl * ^2* Yi anc* ^2 anc* to e s ta b lis h the v e lo c ity p r o f il e .
In 1968, Yu, G ra f and Levine (45) suggested the use o f a m odified
Manning r e la t io n to determine the mean v e lo c ity f o r each subsection in the form
1 d.Q ^ 7
Vi =
s
( A ./ p / ) , 1 = 1 ,2 2 .41 /6
where Z equals (n2/ n 1) and r = 1/6 on the average but should be
determined e x p e rim e n ta lly .
In 1969, Larsen (18) suggested the use o f the lo g a rith m ic
v e lo c ity p r o f ile f o r each subsection in the form
u.j (y i ) = 2 .5 V *. Ln 30 Y . /k . , i = 1 ,2 2 .5
which he used to determine Y^, Yg and the composite roughness.
Ohashi e t a l ( a f t e r ( 2 5 ) )in 1970, gave the measurements o f the
v e lo c ity p r o file s both under ir r e g u la r ic e covers and in the open sections
fo r the Hokaido R iv e r. In the same y e a r Tsang (38) showed th a t the
Presence o f f r a z i l ic e under the cover a lt e r s the v e r t ic a l v e lo c ity
P r o file to a g re a t e x te n t. Also he reported increases in the head loss
and the v e lo c ity between the f r a z i l la y e r and the bed.
In 1970, Tesaker (37) suggested the use o f the Prandtl type
lo g a rith m ic v e lo c ity p r o f ile to p re d ic t the average subsection v e lo c ity ,
w hile the measurements o f the slope can be used to estim ate the channel
average v e lo c ity .
Z h id k ik h , S in o tin and Guenkin (46 ) in 1974 pointed out the
importance o f the absolute values o f the boundary roughness in determ ining
the p o s itio n o f the maximum v e lo c ity ra th e r than t h e i r r e la t iv e magnitude.
In 1975, Kanavin (14) presented some e m p iric a l r e la tio n s f o r the
v e lo c itie s in ice-covered as w ell as open channels. He also presented some
f i e l d data f o r ic e form ation in R iv e r Daugava a t Koknese, Norway.
Drage and Carlson (11) suggested in 1977, the a p p lic a tio n o f the
Regime theory to ice-co vered r iv e r s . They proposed a flo w equation in the form
V = K Qm 2 .6
9
where K and m are constants th a t should be determined experim entally.
Is m a il, Abd EL-Hadi and Davar (13) in the same year adopted a
logarithm ic v e lo c ity p r o file in the form
u. / V*i = <*, + ^ Ln y . / Y i , i = 1,2 2.7
where * and ^ were given g ra p h ic a lly as a function o f the spacing
ar>d height o f the roughness elements and were determined experim entally
1n a wind tunnel sim ulating the ice cover by steel angles fix e d to it s top surface.
In 1978, Burgi (3) presented a d e s c rip tiv e analysis o f the flow
in Gunnison River while Hirayama (25) reported some v e lo c ity measurements
and a method fo r computing the flo w -ra te in ice-covered channels.
^ Underside Configuration and F ric tio n Factor
The importance o f the determination o f the underside configu ration o f an ice cover lie s in i t s e ffe c t on the sedimentary pattern
and it s control o f the flow carrying capacity o f the channel. The pre
d ictio n o f the underside configuration o f the cover requires the study
°i: the behavior o f the cover as a loose boundary s im ila r to th a t o f
sediment transport in open channels.
On the other hand, the f r ic t io n fa c to r plays a s ig n ific a n t ro le
in the establishment o f the v e lo c ity p r o f ile , the determination o f the
energy losses and th e ir mutual dependence on the underside co n figuration.
The to ta l carrying capacity o f an ice-covered channel is usually
°btained using the flow equation. This requires the determination of a
10
total frictio n factor, usually referred to as the composite roughness, that represents the different effects of each boundary involved. Reviews ° f the different methods of the composite roughness estimation were given by Haggag (12) and Uzuner (39).
In 1759 Brahms ( 9 ) suggested the application of the momentum e9uation to uniform flow in open channels. He then applied the equation to the prism shown in Figure 2.2 and i t resulted in
Total Shear = y. A.L.S 2.8
Chezy (9) in 1769 proceeded with Brahms' assumption and suggested the use of an average shear (t ) for the channel boundary delated to the mean velocity of the flow in the form
t = K. V2 2.9
which Chezy combined with Equation 2.8 to obtain
V = C / U S 2.10
where R is the hydraulic radius and equals A/P, and C is a factor that Matter became known as Chezy's coefficient. This equation is widely deferred to as Chezy's equation.
Since Chezy introduced his equation some 200 years ago many Tnvestigators introduced different relations to evaluate Chezy's C. These relations are readily available in the literatu re and w ill not be repeated here (9 ), (33), (44).
The investigation of the cover underside configuration started
Water Surface
12
in 1963, when W illia m s ( a f t e r ( 2 ) ) presented some p r o b a b ility ch arts f o r the
p re d ic tio n o f the average ic e th ic kn es s. In his a n a ly s is he assumed a
constant thickness jam p r o f ile w ith no underside c o n fig u ra tio n .
In 1966, Carey ( 4 , 5 , 6 ) , presented some f i e l d measurements o f the
S t. Croix R iv e r, Wis, U .S .A ., taken during the two succeeding w in ters o f
1965 and 1966 as the f i r s t attem pt to study the underside c o n fig u ra tio n
° f an ic e cover. His observations can be surrcnarized as fo llo w s :
A n o n -s im ila r sh arp -crested dune form ation was observed accompanied
w ith some rip p le s o rie n te d transverse to the flo w d ir e c tio n .
2. The dunes had no standard p r o f il e . T h e ir wave lengths ranged from
0 .5 to 1 .0 f t w ith heights ranging from 0 .0 3 to 0 .1 4 f t . The
g re a te s t amplitudes d id not n e c e s s a rily occur w ith the g re a te s t
wave len g th s. A lso , the upstream face slopes were steep er than the
downstream ones.
As a r e s u lt Carey introduced the hypothesis th a t the v a r ia tio n
in the in te n s ity o f turbulence from p o in t to p o in t w ith in the flow
Results in a d if f e r e n t i a l tem perature g ra d ie n t. This causes in te r m itte n t
fre e z in g o r m elting o f the ic e thereby determ ining i t s underside
c o n fig u ra tio n .
In 1966, Larsen ( 1 7 ) , presented some f i e l d measurements fo r the
cover underside. His experiments involved successive measurements o f under
side c o n fig u ra tio n o f re a l ic e a f t e r exposure to actu al flo w c o n d itio n s .
Ohashi e t a X ( a f t e r ( 2 5 ) ) ,in 1970, proposed an es tim atio n tech
nique f o r n^ by using the actual measurements o f v e lo c ity p r o file s and
the p o s itio n o f the maximum v e lo c ity in the form
13
Y 3/4
n2 = nl (T2 " 1 ^ 2A 1
which is in fact Pavlovskiy's relation for composite roughness determi nati on.
In the same yearTesaker (37) reported his observations of three Norwegian rivers. He measured the head losses and velocity Profiles and suggested the use of the Nikuradse equation to express the fric tio n coefficient as
l / / f 7 = 2 Log ( 14.8 l y k . ) , i = 1,2 2.12
Ashton and Kennedy (1) introduced a mathematical model in 1972, based on Carey's hypothesis, to relate the local heat flux to the normal component of the turbulent velocity near the boundary. They also presented experimental results for a study of a bed formed °T ice in addition to some fie ld data.
In 1973, Larsen (18), obtained fie ld data from both the Kilforsen and G ailjaur channels in Sweden. He introduced the bed effe c t as a factor in the heat transfer process and showed that the cover is thicker near the banks than at the mid-channel with a gradual variation in between. He observed wave steepnesses of n° t m°re than 0.1 with wave lengths of up to 1.2 f t and heights of UP to .12 f t f 0r f | 0W depths and velocities ranging from 3.0 -34.0 f t . and 1.6-4.0 fps respectively. He noticed a proportional
relation-between the wave steepness and the fric tio n factor fo r which he reported an n value of up to 0.03.
14
Cowley and Hyden , ( a f t e r ( 2 5 ) ) , in 1977, described a model
study o f S t. M ary's R iver ic e in which they studied the n a v ig a tio n a l
f e a s i b i l i t i e s and jam fo rm a tio n . In t h e i r experim ents, s p e c ia lly tre a te d
P la s tic blocks were used to sim u late the cover as w ell as i t s s tic k in g
and crushing p ro p e rtie s .
In 1977, T a tin c la u x (35) reported an experim ental in v e s tig a tio n
0-f the jam p r o f ile using 3" x 2 .5 " blocks made o f both re a l ice and
P la s tic . The jam produced in th is manner was sh ort in len gth which made
i t d i f f i c u l t to judge i t s p r o f i l e . He repo rted some wavy fo rm a tio n ,.b u t
his main aim was to determine an average e q u ilib riu m th ic kn es s.
Is m a il, Abd EL-Hadi and Davar ( 1 3 ) , in 1977, suggested the use o f
Darcy's equation and presented experim ental re s u lts f o r the underside o f
the sim ulated cover g r a p h ic a lly , w h ile Mercer and Cooper (21) presented
an a n a ly sis o f a major ic e jam. Petryk ( 2 9 ) , in 1978, suggested a method
to estim ate jam p r o file s based on a m odified backwater curve a n a ly s is
along w ith the c r i t e r i a f o r the s t a b i l i t y o f flo a t in g flo e s .
In the same y e a r Osterkamp (26) presented some concepts lim ite d
to f r a z i l ic e fo rm a tio n . He did not r e la t e any o f his a n a ly s is to the jam
P ro file s o r f r i c t i o n fa c to r s , w h ile Z s ila k (47) presented some analyses
the c o n fig u ra tio n o f jams in which he u t il i z e d the c o n tin u ity r e la t io n
as w ell as the fo rc e -b a la n c e concept.
The N ational Research Council Working Group on Hydraulics o f Ic e
-Covered Rivers ( 2 5 ) , in 1979, presented a summary o f the work on the
re sistance to the flow in ice-covered r iv e r s . In th is study P ra tte s ta ted
th a t a v a r ia tio n in the n value coincided w ith the v a r ia tio n o f the cover
15
thickness in the c ro s s -s e c tio n a l d ir e c tio n as w ell as the lo n g itu d in a l
one. He reported th a t the cover is always th ic k e r near the banks and
suggested a value o f th a t equals Y ^ Y g .
2*4 I n s t a b i l i t y o f Cover Blocks
The f i r s t re p o rt about ic e f lo e s t a b i l i t y was made by Mclachlan
l u - 1 9 2 6 -( a f t e r (4 0 )) based on bis observations o f the S t. Lawrence R iver ic e . he concluded th a t a very re g u la r ic e cover is formed in riv e rs a t w ater
v e lo c itie s not exceeding 1.25 fp s . He also noted th a t ice -co ve rs may
thicken and progress a t v e lo c itie s up to 2 .2 5 fps w ith o u t flo e s passing
underneath.
E s tiv e e f in 1 9 5 8 ( a f t e r ( 2 ) ) gave the c r i t i c a l v e lo c ity value as 2 .3
t ° 2 .6 fps a f t e r his observations in Russian r iv e r s . While K iv is ild
(1 6 ), i n i95g s pointed out th a t the Froude number o f the flo w in fr o n t ° f the cover should be the c r it e r io n f o r the f lo e s t a b i l i t y and
suggested th a t i t s lim it in g value should be Fnc = .0 8 .
Pari s e t and Hausser's work in the same y e a r (27) showed th a t
the cover w i l l not progress a t v e lo c itie s g re a te r than 0.109 / “"ZgR.
This r e s u lt was v e r if ie d in C a r t ie r 's Flume but f a ile d to hold in the
S t. Lawrence R iv e r; so they proposed another c r i t i c a l v e lo c ity in the form
( Vc/C ) 2 = 0.00375 d + 0.005 qi 2 / 3 2 .1 3
where Vc = c r i t i c a l v e lo c ity f o r s t a b i l i t y conditions
C = Chezy's c o e ff ic ie n t
16
d = mean eq uivalent diameter o f ice blocks
q . = ic e discharge
They also reported some v a ria tio n in V , due to the existence
adjacent blocks to the flo e s .
C a rtie r in 1956 ( a f t e r ( 2 ) ) reported v e lo c itie s o f 2 .0 -1 .2 fps
to lim it the cover advancing and 1 .6 -3 .2 fps fo r overturning o f the
blocks; the v a ria tio n depends upon the block shape and dimensions. He
also found experim entally th a t i t was impossible to obtain upstream
progression o f an ice cover fed w ith big ice flo e s a t v e lo c itie s higher than 2 .3 fp s.
In the same y e a r Michel (23) introduced an a n a ly tic a l solution
to the problem. His analysis was based on the moment eq u ilib riu m o f a
single block arrested in fro n t o f an obstru ction . He also introduced a
■form c o e ffe c ie n t to describe the block geometry and determined i t s value
exPerim entally using r ig h t p ara lle le p p ip e d blocks.
P a ris e t and Hausser (2 8 ), in 1961, based t h e ir analysis on the
co n tin uity p rin c ip le and the conservation o f energy between the sections
with and w ithout a cover. They introduced the n o -s p ill co n d ition , when the
upper leading edge o f the block is a t the same e le va tio n as the water
surface, as the s t a b i l i t y c r ite r io n . They suggested the use o f Equation
5 Table 2 .1 to estim ate the c r i t i c a l Froude number.
Devik (1 0 ), in 1964, reported a lim itin g v e lo c ity fo r diving
blocks o f 2 .0 fps fo r Norwegian r iv e r s . In the same year Cousineau ( a f t e r (4 0 ))
confirmed Mclachlan's VQ = 2.25 fps observation adding th a t in fa c t th is
v e lo c ity was an upper l im it which can be reached only under ideal conditions.
17
Michel ( 2 2 ) , in 1966, presented a more e la b o ra te a n a ly s is based
°n the same assumptions o f P a ris s e t el: al_ . I n a d d itio n he introduced
the e f f e c t o f the p o ro s ity in to the problem and suggested the value o f
the c r i t i c a l Froude number as given by Equation 6 Table 2 .1 .
In 1967, Mathieu ( 2 0 ) , reported th a t the c r i t i c a l Froude number
should be 0 .1 1 , w h ile Oudshoorn ( 4 0 ) , in 1970, repo rted a f t e r his
observations o f the Rhine R ive r th a t Fnc should be in the range o f 0.06
to 0 .0 9 . Also in 1970, Synotin e t - a l ( a f t e r ( 4 0 ) ) , obtained an em p iric al
exPression f o r the c r i t i c a l v e lo c ity V , using p a r a ffin blocks,as
Vc = ( 0.035 g L )** 2 .1 4
where L is the block le n g th .
Uzuner and Kennedy ( 4 1 ) , in 1972, analyzed the e q u ilib riu m o f
the forces and moments a c tin g on the b lo ck. They used the n o -s p ill
con dition as the s t a b i l i t y c r it e r io n and ended w ith Eqution 7 o f Table
2 * 1 .T h e ir a n a ly s is was extended by Ashton (1 ) , in 1974, where he
introduced Equation 8 o f Table 2 .1 to p re d ic t the c r i t i c a l s t a b i l i t y co n d itio n .
In 1974, Uzuner and Kennedy ( 4 2 ) , suggested the adoption o f a
0am c o lla p se mechanism ra th e r than a tra n s p o rt one in in v e s tig a tin g the
s t a b i l i t y problem. In the same y e a r , Osterkamp (2 5 ) re p o rte d , a f t e r his
observation o f the Tanana R iv e r, th a t a t a v e lo c ity and a w ater depth o f
^•5 fps and 18 f t re s p e c tiv e ly the flo e s were observed to rid e on the
uPstream edge o f the jam.
Michel and Abdelnour ( 2 4 ) , in 1974, reported an experim ental
18
in v e s tig a tio n using wax blocks to sim ulate re a l ic e flo e s . They
expressed t h e i r fin d in g s as
i/pTo" (V - /2g Sg l H ) = 0.055 (Y /B )3 *816 2.1 5
where a and p. are the modulus o f fle x u r a l s tren g th and the u n it mass
R esp ectively. This equation can be solved to o b ta in the c r i t i c a l -V e lo c ity .
In 1977, Mercer and Cooper ( 2 1 ) , based on S h ie ld 's r e la t io n ,
gave the value o f the c r i t i c a l v e lo c ity as
Vc = 0 .4 6 /g H1/6 L1 /3 2 .1 6
w hile Petryk (29) in the fo llo w in g y e a r suggested another r e la tio n
to express Mq as
VQ = 2.2 7 S5 (1 - d/H) 2.17
where d is the cover s iz e in f t . He also repo rted th a t w h ile thermal
cover s t a b i l i t y is maximum during the c e n tra l period o f w in te r , i t is
Minimum during the cover form ation or break-up.
T a tin c la u x and Chung(36), in 1978, presented the fo llo w in g
R elation to estim ate the c r i t i c a l v e lo c ity o f i n s t a b i l i t y
V* / V = 5 .4 8 t / L + 1.5 3 2 .1 8
which is lim ite d to t h e i r experim ental d a ta . In the same y e a r T a tin c la u x
ar|d tee (3 5 ) , based on an e a r l i e r in v e s tig a tio n by T a tin c la u x (34)
suggested the use o f Equation 11 o f Table 2 .1 to ev a lu a te the s t a b i l i t y
conditions o f ic e flo e s .
2.4.1 Generalized Formula
The lite ra tu re equations reported in the previous a rtic le can t>e expressed in the general form
F = F m nc / /2 Sn1 t/H = A + B (1 - t/H ) gi 2.19
where F = a modified Froude numberm
Sgl = the specific gravity difference = 1 - Sg and f = the c r itic a l Froude number = V / / g l L
nc u
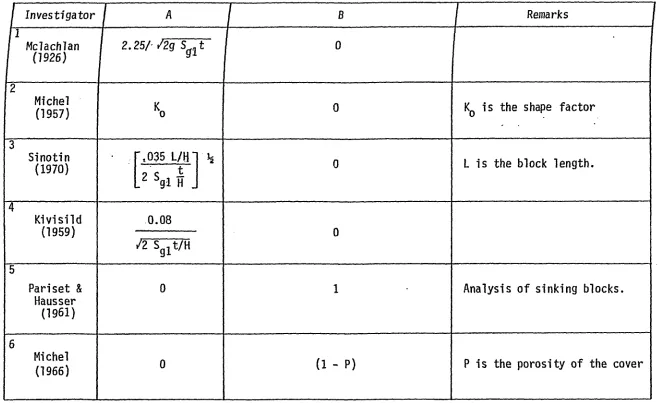
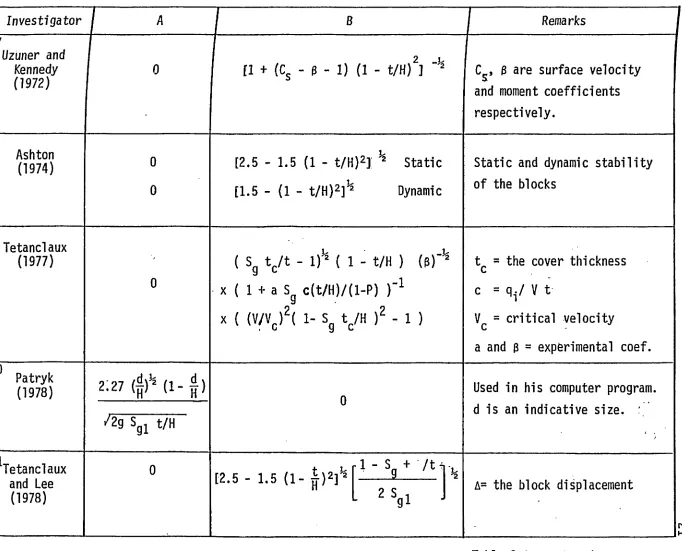
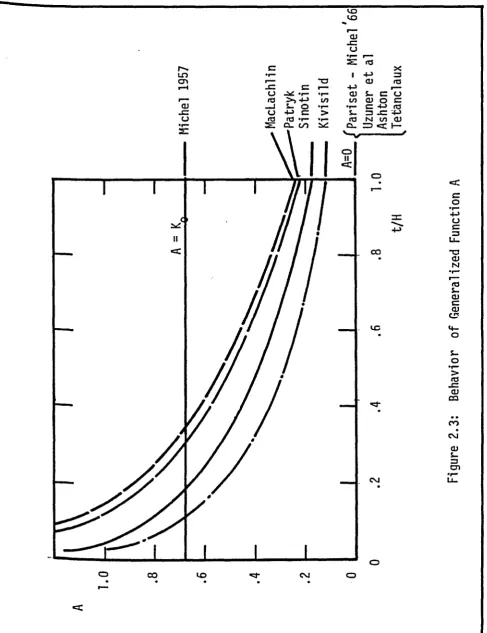
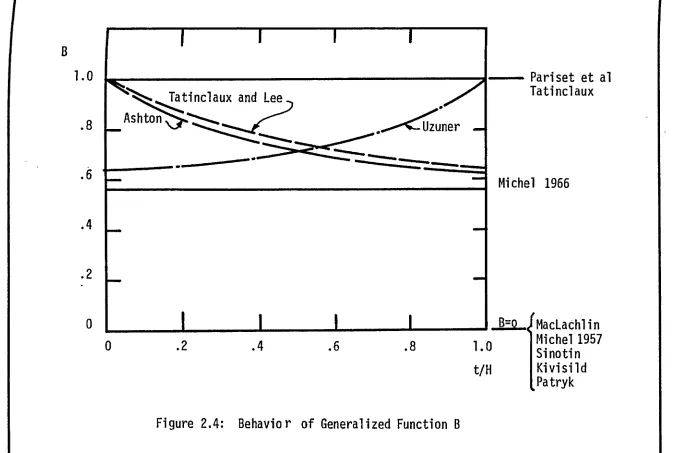
The d iffe ren t lite ra tu re equations, modified to the general f Ottn, are given in Table 2.1. The behavior of the coeffecients A and B, as given by these equations, is shown in Figures 2.3 and 2.4 respectively. From these figures i t can be seen that the lite ra tu re equations are divided into two groups, one that considered Fm as
constant (B=0) and the second relates i t to t/H variation (A=0). Further discussions of the lite ra tu re equations are given in Chapter VI.
ep ro du ced w ith pe rm is si o n of the co p yr ig h t o w n e r. Fu rthe r rep roduction p ro h ib it e d wit hou t p e rm is s io n
/ Investigator
A
B I Remarks
Mclachlan (1926)
2.25/-/2g Sg lt 0
2
Michel
(1957) Ko 0 Kq is the shape factor
3
Sinotin (1970)
T .035 L/H~1 %
} s g i H J
0 L is the block length.
4
Kivisild (1959)
0.08
/2 Sg lt/H
0
5
Pari set & Hausser
(1961)
0 1 Analysis of sinking blocks.
6
Michel
(1966) 0 (1 - P) P is the porosity of the cover
Table 2.1 Generalized S tability Equations
Re pr od uc ed w ith pe rm is si o n of th e co py ri gh t o w ne r. Fu rthe r rep roduction p ro h ib it e d wi th ou t p e rm is s io n .
I n v e s t i g a t o r A B Remarks
7
Uzuner and Kennedy (1972)
0 f l + (Cs - 3 - 1) (1 - t/H )2] * Cs, 3 are surface velocity and moment coefficients respectively.
8
Ashton
(1974) 0
0
[2.5 - 1.5 (1 - t/H )2! H Static
[1.5 - (1 - t/H) 2] 55 Dynamic
Static and dynamic s ta b ility of the blocks
9
Tetanclaux (1977)
0
( Sg t c/ t - l ) h ( 1 - t/H ) (3r h
x ( 1 + a Sg c ( t /H ) /( l- P ) T 1
x ( (V/Vc)2( 1- Sg t c/H ) 2 - 1 )
t = the cover thickness c
c = q^/ V t
Vc = c r itic a l velocity
a and 3 = experimental coef.
Patryk
(1978) 2:27 (j})* (1- 4 )
-/ 2g Sg l t/H
0
Used in his computer program, d is an indicative size. :
^Tetanclaux and Lee
(1978)
0
[2.5 - 1.5 ( 1 - [ - — ^ ---
fl)
h2V J
A= the block displacement*
22 vo VO LO crt OJ -C u •I— S ITS
E •— +J cu
X
o 03
O -X •(“ T
-«o > > +-> to s_ <U O E e o E ■+■> 03
rd 03 *r— »r—
s: o_ co ;*c
o
o
C I
CO
o 00 VO CM o
Reproduced with permission o f the copyright owner. Further reproduction prohibited without permission.
.0 Pari set et al Tatinclaux Tatinclaux and Lee
Ashton
.8 Uzuner
. 6
Michel 1966
4
. 2
B=0 /Marl arhlin Michel 1957 Si notin K ivisild Patryk 0
t/H
Figure 2.4: Behavior of Generalized Function B
CHAPTER I I I
THEORETICAL INVESTIGATION
I I I . THEORETICAL INVESTIGATION
In th is chapter the th e o re tic a l models fo r the problems men
tioned in Chaper I are developed. The an alysis proceeds by f i r s t
developing the equations th a t describe the v e lo c ity d is tr ib u tio n in
a c°vered channel. Then the r e la tio n between the cover underside con
fig u ra tio n and the bed-form is presented fo llo w in g an em pirical ex
pression fo r the cover underside f r i c t i o n fa c to r . F in a lly , the block
s t a b ilit y a t the cover leading edge is in v e s tig a te d .
Basic Assumptions
The fo llo w in g assumptions were made throughout the course o f
the th e o re tic a l a n a ly s is :
The flow is quasi-stead y.
The channel cross-section is divided in to two d is t in c t subsections,
Figure 3 .1 ; subsection (1 ) is governed by the bottom and sides w hile
subsection (2 ) is c o n tro lle d by the cover.
• The separation lin e between the two subsections is the locus o f the
Points o f maximum v e lo c ity which in tu rn are the points o f no shear.
4* The wetted perim eters r a t i o , a , and the h yd raulic r a d ii r a t i o , X; ,
are defined as
* s Pi/P >
* a R2/Ri 3 .1
and ^ = Aj / Pt »i = 1. 2
24
25
CM
-a
to
ca <a
a .
CJ
>
o
CJ
cvl
c CO
<a
CVl
>>
CVJ
CM
o£
Reproduced with permission of the copyright owner. Further reproduction prohibited without permission.
F
ig
u
re
3
.1
:
D
e
fin
it
io
n
S
k
e
tc
26
where P^, p^ and P are the wetted perim eters o f the bed and cover
subsections and the to ta l channel re s p e c tiv e ly , and A^, k ^ and A
are the corresponding flow areas.
2*2 Flow P attern
The problem under in v e s tig a tio n can be phrased in the fo llo w in g
manner: fo r a covered channel o f a known cross-sectio n and boundary
r °ughnesses, what is the flow p a tte rn a t a given flo w -r a te o r energy
slope? The reason f o r using the term "given flo w -ra te or energy slope"
arises from the fa c t th a t they are re la te d by the flow equation.
2 *2 .1 General approach
The d i f f i c u l t y o f solving the general equation o f motion,
Reynolds1 equation, aris e s from the existence o f a d if f e r e n t ia l shear
on the opposite faces o f any flow element p a r a lle l to the d ire c tio n along which the equation is in te g ra te d .
- I f th is d if f e r e n t ia l shear vanishes, the equation can be
m te g ra te d ; th is is the case o f two dimensional flo w . This concept w ill
be used to develop the v e lo c ity p r o f ile in a p ris m a tic channel in the
absence o f any cross-currents.
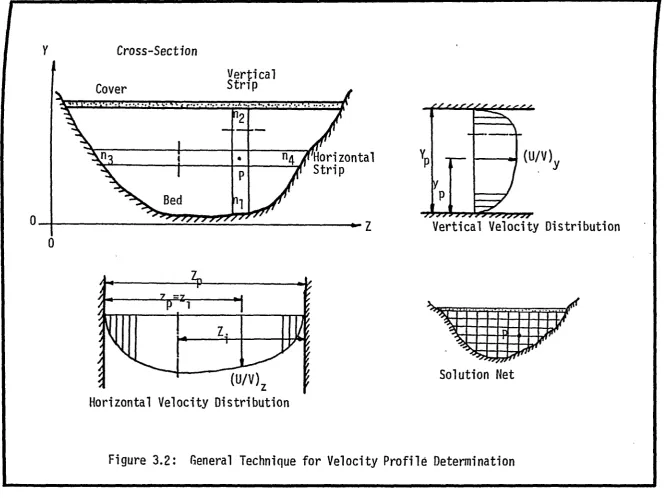
In the channel shown in Figure 3 .2 , v e r tic a l and h orizo n tal s trip s o f a uni-t are drawn around an a r b it r a r y p o in t P. A
two-dimensional so lu tio n w il l be c a rrie d out f o r the v e r tic a l s t r i p , as i f
1s a portion o f a wide channel, n eg lecting the h o rizo n ta l d if f e r e n t ia l
shear and u t il i z in g the lo c a l depth Yp and lo c a l roughnesses n^ and ng
to y ie ld the v e r tic a l shape fu nctio n o f the lo c a l r e la t iv e v e lo c ity
ep ro du ced w ith pe rm is si o n of th e co py ri gh t o w ne r. Furth er re production p ro h ib it e d w it ho ut p e rm is s io n . 1---Y Cross-Section Cover
nF7T Hori zontal
jA Strip
Bed 0
0
Horizontal Velocity Distribution
(u/v)
Vertical Velocity Distribution
A t p
-Solution Net
Figure 3.2: General Technique fo r Velocity ProfilO Determination
28
(U/V) A s im ila r solution w ill be carried out fo r the horizontal
s trip using i t s local width Z a n d roughnesses n^ and n^ to y ie ld
the transverse shape function o f the local r e la tiv e v e lo c ity (U /V )z ,
where (U/V) is the r a tio between the v e lo c ity a t point P and the mean
velocity o f each s tr ip .
I f these two solutions are used as c o e ffic ie n ts o f each o ther,
through a c o e ffic ie n t equation, the r e la tiv e v e lo c ity a t the point P
can be estimated. The successive ap p lication o f the equation a t every
Point w ithin the cross-section w ill re s u lt in the complete determination
°T the v e lo c ity p r o file and boundary shear d is trib u tio n in the channel.
The follow ing form o f the c o e ffic ie n t equation was adopted in this research
EE
U/V = E ( (U/V)y . (U /V )z ) / (Vmax/V ) 3.2
where, Vmax is the maximum v e lo c ity in the channel cross-section, E is
the v e lo c ity c o e ffic e n t, and EE is the v e lo c ity exponent. This form
s a tis fie s the necessary conditions d ictated by the observed v e lo c ity
p ro file s . The (Vm /V ) is the r a tio o f the maximum to the mean v e lo c ity UlaX
°T the channel. This r a tio is constant fo r a given flow condition and
qt depends on the developed v e lo c ity p r o f ile . The v e lo c ity exponent, EE
» ^ e la te s :to and a ffe c ts the v e lo c ity gradient steepness while the
cQ effeetent, ^ re la te s to and a ffe c ts the to ta l flow in the section. The solution o f Equation 3.2 necessitates the evaluation o f
E and EE. This can be achieved by s a tis fy in g the follow ing
conditions;
29
The flo w -r a te should equal the in te g r a tio n o f the v e lo c ity p r o f ile
w ith respect to the c ro s s -s e c tio n a l a re a , i . e .
Q = / U dA 3 .3
A
2* The t o ta l d riv in g fo rc e , the g r a v ity fo rc e h ere, should equal the
to ta l boundary sh ear, i . e .
J x dP = y . A . S 3 .4
P
where x is the lo c a l boundary shear and P is the w etted p e rim e te r.
3* The flo w equation should be s a t is f ie d .
The s a tis fy in g o f these co nditions w i l l r e s u lt in the necessary
parameters needed to d e fin e the v e lo c ity p a tte rn in the channel.
3 *2 .2 Two Dimensional D eterm ination o f V e lo c ity P r o f ile
The general Reynolds’ form o f the Navier-Stokes equation in two
dimensional flow can be w r itte n f o r the v e r t ic a l s t r ip as
U(3U/3x) + V (3U /3y) + 3 U 'U 7 3 x + 3 V 'U 7 3 y =
!=■ ( P /
p+ gh) + £
+ ^
)
3 .5
3X p sxx
ln which U, V , are the average v e lo c itie s in the x and y d ir e c tio n s , U ',
V are the v a ria tio n s in the IT and V v a lu e s , p and y are the f l u i d d en sity
and v is c o s ity , and "P = average pressure. For g r a v ity , as w ell as a steady
and uniform flo w w ith no c ro s s -c u rre n ts , Equation 3 .5 , fo llo w in g Chang e t
( 8 ) , reduces to
30
f y ( - p U 'V ) = -p g S 3 .6
where S is the bed slope and g is the a c c e le ra tio n due to g r a v ity . The
lam inar shear is denoted by the f i r s t term in Equation 3 .6 w h ile the
second q u a n tity represents the tu rb u le n t shear.
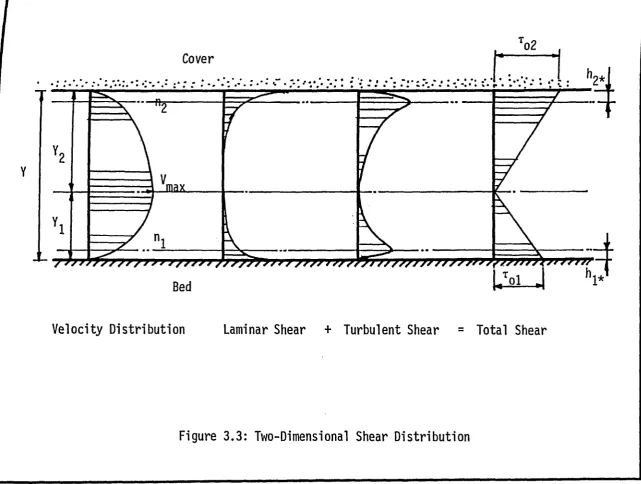
The in te g r a tio n o f Equation 3 .6 f o r each subsection on i t s own,
noting th a t the shear vanishes a t th e sep aration l i n e , y ie ld s the shear
d is t r ib u t io n , Figure 3 .3 , as
t = P g S ( Y.. - y .j) , i - 1*2 3 .7
in which, the tu rb u le n t shear ts denoted by xtl- , the lam inar shear is xL - ,
^i = distance from the bed o r ic e cover to the d iv is io n l i n e , y - is the
distance measured from the bed o r the cover; and the su b s c rip t i =
1>2, re fe rs to the bed and cover subsections re s p e c tiv e ly .
The lam in ar shear is very small outside the lam in ar su b la ye r,
hence, only the tu rb u le n t shear is re ta in e d . W ithin the tu rb u le n t co re,
i-he shear d is tr ib u tio n can be represnted by the eq u ation ,
Tt i = P 9 S ( Y . - - y . ) , i - 1 ,2 3 .8
Using the Prandtl-Karman mixing length th e o ry , the tu rb u le n t shear can be expressed as
Tt i = p V 2 <2 ( d U .j/d y.) | (dll^./dy•) | >i = 1 ,2 3 .9
ep ro du ced w ith pe rm is si o n of th e co py ri gh t o w ne r. Furth er re production p ro h ib it e d w it ho ut p e rm is s io n Cover
max
BedVelocity Distribution Laminar Shear + Turbulent Shear = Total Shear
32
where k is Von Karman's co n s ta n t. Combining the previous equa
noting that- y / Y . . * the r e la t iv e depth, re s u lts in
dU1 / d e i = C V ^ / k ) • ' I - 1 E i , 1 = 1 , 2 3 - 1 0
where V*.. = shear v e lo c ity = /g Y^ SQ.
The in te g r a tio n o f t h is equation y ie ld s
U ^ ) = (V ^ /ic ) F ' ( e i ) + C .
where F1 (e ..) is given as
, i = 1 ,2 3.1 1
1 + / l - ^ T #i = 1 ,2 3 .1 2 F* ( e•) = 2 / I - T 7 - Ln x _ / I - eT
The v e lo c ity p r o f ile should s a t is f y two boundary c o n d itio n s :
1. The computed mean v e lo c it ie s should equal th e e x is tin g one, i . e .
i = 1 2 3.13
( l / A ) / u -C y ^ dy i - v .
hence, the in te g r a tio n constant is
i = 1 2 3 .1 4
Ci = + 2 V *.j/ 3 k ’
o n, „ - i the v e lo c ity is maximum, and
3* At the p o in t o f s e p a ra tio n , e 1, tn
C. should be
, i - 1 ,2 3 .1 5 C. = V
i max
The v e lo c ity p r o f ile can then be d efined by the fo llo w in g two equati ons
33
Vn- - U . ( e i ) = V *i F1(e i ) , i = 1 ,2 3.1 6
and
^max *" ^ i^ Ei^ ~ ^ * i »i = 1*2 3.1 7
where ( e . ) and F2 ( e.j) are given g ra p h ic a lly in Figure 3 .4 and t h e i r
values are re s p e c tiv e ly
Fl (e i>
= I (L n ( ^ e ./( 1 -v^TTT)) - v T T T - 1 /3 )
3 .1 8 a
and 4 _ i o
i 1 + / 1 - e . ____
F2 (e -i) = ^ ( Ln --- - 2 v'T-eT" ) 3 .1 8 b
1 1 - /T IF T 1
and the maximum v e lo c ity is r e la te d to the mean v e lo c itie s in the form
Vi = Vmax - 2 W 3 K ■ .1 - 1 .2 3 .1 9
To use the developed v e lo c ity p r o f i l e , the p o s itio n o f the
maximum v e lo c it y , i . e . Y^ and Y2 , should be es tim ate d. These values
^ePend upon the roughness o f each boundary and the depth, and can be
obtained using the equations developed in Appendix A.
S im ila r r e la tio n s can be developed f o r the h o rizo n ta l s t r ip with the s u b s titu tio n o f
ei = z . / Z. , i = 1 ,2 3 .2 0
where z . ancj are d efined in Figure 3 .2 .