ABSTRACT
MILLER, BRENDAN PAUL. Diffusion of Physisorbed Layers and their Connection to MEMS Effectiveness. (Under the direction of Professor Jacqueline Krim.)
The aim of this work is to connect the physics of surface diffusion of a lubricant to Micro-Electro-Mechanical System (MEMS) lubrication. Some hurdles must be overcome in order to make this connection. One must have a way to experimentally measure surface diffusivity. Length scales must be taken into account since the mechanism of lubrication varies from the macro scale to the micro scale and even to the nano scale. Lastly, a theoretical model of lubrication that can conform to MEMS geometry is needed for an accurate prediction.
In the work presented here, I have used different techniques including a quartz crystal microbalance (QCM), a macroscopic tribometer, a micro tribometer, and an atomic force microscope (AFM) to measure the friction of a lubricant on surfaces relevant to MEMS. The QCM method is different from the others aforementioned since it measures the atomic scale friction of a sliding layer in a contact-free environment directly related to surface mobility. The other three methods are a way to measure lubrication over three different length scales.
drives (MHDDs), MEMS, and macroscopic industrial machines, but will work for any system with a periodic contact relying on surface diffusion as the replenishment mechanism.
Two groups of lubricants were studied in this work. Tricresyl Phosphate (TCP), which is a known high temperature additive to industrial oils, was selected since it possesses a low vapor pressure and has been extensively studied by our group. All of the above mentioned techniques were used to study TCP. The other group of lubricants studied were alcohols, specifically pentanol, ethanol, and trifluoroethanol (TFE). These lubricants were studied exclusively with the QCM technique. Alcohols have been shown to lubricate a MEMS device indefinitely as long as an environment of the alcohol vapor surrounds the contact.
Diffusion of Physisorbed Layers and their Connection to MEMS Effectiveness
by
Brendan Paul Miller
A dissertation submitted to the Graduate Faculty of North Carolina State University
in partial fulfillment of the requirements for the degree of
Doctor of Philosophy
Physics
Raleigh, North Carolina 2009
APPROVED BY:
_______________________________ ______________________________
Prof. Jacqueline Krim Prof. Donald W. Brenner
Chair of Advisory Committee
________________________________ ______________________________
DEDICATION
To all my family and friends, especially my parents, sisters, and Fiancée. I could not have
BIOGRAPHY
Brendan Miller was born in Lancaster, Pennsylvania to Joseph and Stephanie Miller. He was a very inquisitive child and loved to question his parents about anything he may not fully understand. He grew up playing sports and learned valuable life lessons from them. He loves tennis spawning from playing with his father in the street with a makeshift net. This foundation allowed Brendan to play tennis in high school and eventually college. He played saxophone in the high school marching band despite not having a musical bone in his body. Math and physics came easy to Brendan, but he never knew what he wanted to do with that. People would tell him to be an engineer even though he was not exactly sure what that entitled. He switched to a physics major in the first semester at Bloomsburg University in Pennsylvania. Tennis practices for three hours a day gave him structure in college and helped him achieve a 3.7 GPA. He was convinced by some of the physics professors that he should continue his education at a research institution, where, as a complete surprise to Brendan, they would pay for your education and give you a stipend to live off. Not wanting to join the real world he arrived at North Carolina State University as a master’s student. He soon realized his love for physics and wanted to push his education to limit.
ACKNOWLEDGMENTS
Thanks to everyone in the MURI grant. The atomic force microscopy was performed by Matthew Brukman here at NC State, and the microtribometry was performed by Kathryn Wahl at NRL. Nimel Theodore performed the macroscopic tribometry at NRL. Nimel also mentored me in the all important final year of my graduate career, and for that I am truly grateful. The characterization of tricresyl phosphate and the self-assembled monolayer was performed at NRL. Discussions with Don Brenner, Doug Irving, and Mike Dugger proved invaluable.
I wish to thank all the members of the Nanotribology lab. They have provided a great environment for helping me with my issues and vice versa. This comradery led to an understanding of not only my own work, but everyone else’s work as well. Also, I wish to thank my advisor Jacqueline Krim for taking a chance on someone with nominal lab experience but a lot desire for learning.
TABLE OF CONTENTS
LIST OF TABLES... vii
LIST OF FIGURES ... viii
CHAPTER 1: Introduction ...1
1.1 Friction...1
1.2 Diffusion ...4
1.3 Various Diffusion coefficients ...9
1.4 Aims of the Dissertation ...15
CHAPTER 2: MEMS Introduction and Literature Review ...19
2.1 Introduction...19
2.2 Prior studies of Tricresyl Phosphate ...24
2.3 Prior studies of alcohols on MEMS ...26
CHAPTER 3: Experimental Details ...29
3.1 Quartz Crystal Microbalance ...29
3.2 Macroscopic Reciprocating Tribometry ...47
3.3 Microscopic Reciprocating Tribometry...49
3.4 Atomic Force Microscopy ...50
3.5 Vacuum system...52
3.6 QCM electrode preparation...53
3.8 Tricresyl phosphate adsorption ...56
3.9 Characterization of PFTS and TCP...57
3.10 Alcohol Adsorption onto QCMs ...61
3.11 Electronics...62
CHAPTER 4: Alcohol Raw data ...67
4.1 Alcohol uptake ...67
4.2 Alcohol adsorption after pumpout ...76
CHAPTER 5: Discussion of Alcohol Data ...82
5.1 Analyzed Alcohol Data...82
5.2 Discussion of Alcohol Data ...91
5.3 Discussion of Alcohol post-pumpout...94
CHAPTER 6: TCP Results and Discussion...97
6.1 TCP Results of manuscript in preparation ...97
6.2 Discussion of manuscript in preparation...104
6.3 Results of macroscopic reciprocating tribometer of TCP on Si ...109
6.4 Discussion of macroscopic reciprocating tribometer of TCP on Si...113
CHAPTER 7: Conclusions and Future Work ...117
7.1 Conclusion ...117
7.2 Preliminary studies...120
LIST OF TABLES
Table 4.1 List of constants needed for analysis of QCM adsorption...81 Table 5.1 Summary of slip time and diffusion coefficient parameters at one monolayer
coverage obtained from the QCM adsorption isotherm data. ...92 Table 5.2 The values for coverage and dissipation after the vapor has removed and the data
has reached a steady value ...96 Table 6.1 Summary of experimental results of TCP slipping on four different substrates ...100 Table 6.2 Summarizes the length, time, and pressure scales at which the data was recorded
with the result of the addition of TCP to the PFTS layer...109 Table 7.1 Shows the single particle diffusion coefficient of TCP on various substrates...118 Table 7.2 Shows the spreading diffusion coefficient at one monolayer and the island
LIST OF FIGURES
Fig. 1.1 Surface forces apparatus ...3
Fig. 1.2 Surface diffusion illustration ...5
Fig. 1.3 Three different diffusion types ...7
Fig. 1.4 Wetting behavior at vapor pressure and sub vapor pressure ...8
Fig. 1.5 Windshield wiper effect...11
Fig. 2.1 MEMS stiction...20
Fig. 2.2 MEMS friction tester ...22
Fig. 2.3 Bound plus mobile illustration ...23
Fig. 2.4 Chemical makeup of Tricresyl phosphate (TCP) ...25
Fig. 3.1 Top and side view of a QCM...30
Fig. 3.2 Calibration of nitrogen gas ...41
Fig. 3.3 No-slip to slip transition ...43
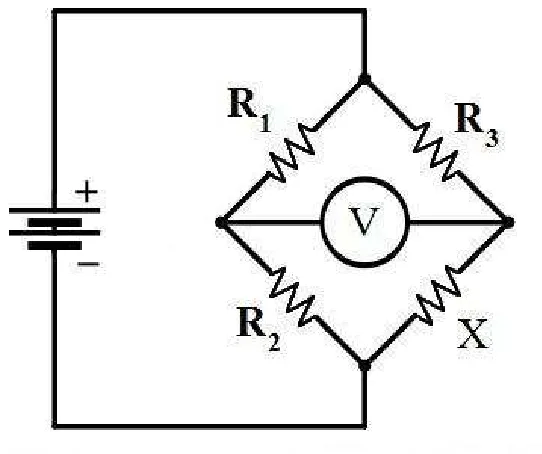
Fig. 3.4 Macroscopic tribometer illustration...47
Fig. 3.5 Wheatstone bridge circuit ...48
Fig. 3.6 Microscopic tribometer illustration ...49
Fig. 3.7 AFM illustration ...50
Fig. 3.8 Vacuum chamber illustration...53
Fig. 3.10 Contact angle of Water ...56
Fig. 3.11 XPS of PFTS ...59
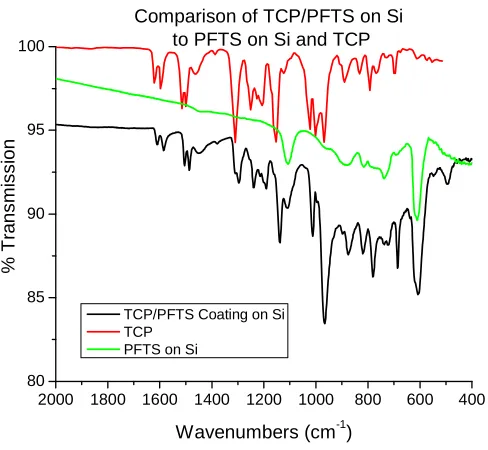
Fig. 3.12 FTIR of TCP...61
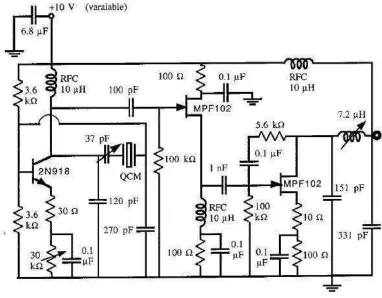
Fig. 3.13 Pierce oscillator circuit ...63
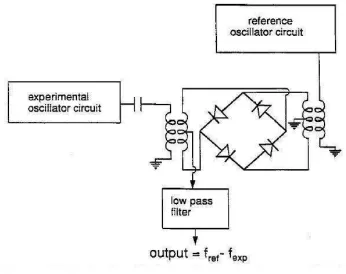
Fig. 3.14 Mixer circuit ...64
Fig. 4.1 Raw data for pentanol on PFTS...68
Fig. 4.2 Raw data for ethanol on PFTS...69
Fig. 4.3 Raw data for TFE on PFTS ...70
Fig. 4.4 Raw data for pentanol on Si ...71
Fig. 4.5 Raw data for ethanol on Si ...72
Fig. 4.6 Raw data for TFE on Si ...73
Fig. 4.7 Raw data for pentanol on Al...74
Fig. 4.8 Raw data for ethanol on Al...75
Fig. 4.9 Raw data for TFE on Al ...76
Fig. 4.10 Hysteresis of coverage vs. pressure of pentanol on Si and PFTS...77
Fig. 4.11 Hysteresis of amplitude shift vs. pressure of pentanol on Si and PFTS ...78
Fig. 4.12 Frequency and amplitude shift vs. time of TFE on PFTS ...79
Fig. 4.13 Frequency and amplitude shift vs. time of ethanol on Si ...80
Fig. 5.1 Total and gas damping of ethanol on Si ...85
Fig. 5.2 Analyzed frequency and quality factor shift for the alcohols on PFTS...86
Fig. 5.4 Analyzed frequency and quality factor shift for the alcohols on Al...88
Fig. 5.5 Slip time vs. coverage for the alcohols on PFTS, Si, and Al ...90
Fig. 5.6 Alcohol contact angles on Si and PFTS ...91
Fig. 6.1 Sample nitrogen calibration...98
Fig. 6.2 Raw data of TCP on Si and PFTS ...98
Fig. 6.3 Raw data of TCP on Al and PFTS...99
Fig. 6.4 Analyzed data of TCP on PFTS, Si, and Al ...100
Fig. 6.5 AFM friction of PFTS with and without the addition of TCP ...101
Fig. 6.6 Friction comparison on the macro-tribometer of PFTS with and without TCP ...103
Fig. 6.7 Varying contact stress on the macro-tribometer...104
Fig. 6.8 TCP on Si for the macro-tribometer ...110
Fig. 6.9 More TCP on Si for the macro-tribometer ...111
Fig. 6.10 Wear track of a failed test...112
Chapter 1: Introduction
1.1 Friction
Nanotribology is an exciting, growing field with uses varying from understanding fundamental friction mechanisms to lubricating smaller and smaller contacts in MEMS. The name tribology comes from “tribos”, which is the Greek word for “to rub”, and is the study of friction and wear. Anytime an object is in motion, there is friction present. Even without motion there is still static friction opposing the onset of motion. The friction that is easily thought of is kinetic friction i.e. the friction occurring when two objects are sliding across each other. This is seen in everyday occurrences from rubbing one’s hands together to brakes working to slow a car down. The well known macroscopic equation:
(1.1)
F =µN
is known as Amonton’s Law1, where F is the force of friction opposing motion, µ is the coefficient of friction, and N is the normal force. (1.1) implies that the force of friction is proportional to the applied load and independent of the area of contact. This works well for many macroscopic systems, but as one goes to smaller and smaller scales Amonton’s law takes a different turn.
since microscopic asperities of most macroscopic contacts are the only parts of the two objects in actual contact. As one increases the normal force the apparent area of contact stays the same, but the true area of contact (which is only a fraction of the apparent area of contact) increases. This new situation can be defined as:
(1.2)
true
F =A σ
If Atrue is the true area of contact and σ is the shear stress.
Fig. 1.1 shows a diagram of a surface forces apparatus (SFA) where two atomically flat mica sheets are rubbed together. Measurement of the normal and shear force is allowed
via springs. Reproduced from Ref. 5.
Another type of friction is apparent for objects moving through a viscous medium, where the viscosity of the fluid opposes the motion. Instances of viscous friction are a skydiver reaching terminal velocity or a submarine traveling through the water. This force equation can be written as:
(1.3)
mv F
τ =
1.2 Diffusion
Diffusion in its simplest form is a net displacement of particles from an area of higher concentration to one of lower concentration by random particle motion and is described by Fick’s law6. Simply stated Fick’s law is defined as
(1.4)
J = − ∇D φ
Fig. 1.2 shows the diffusion of an adsorbate from one site (white oval) to another site (blue oval) on a crystalline surface (red circles).
Many of the major fundamentals of surface diffusion under ideal conditions are now well understood due to experimental and computational efforts in recent decades. Some of these experimental methods include scanning tunneling microscopy and field ion microscopy. However, surface diffusion becomes increasingly complicated when the setup consists of non-equilibrium conditions, impurities, or other defects that are typical under real life situations. Numerous experiments have reported that non-equilibrium measurements can produce different results from equilibrium measurements. Also, experiments have shown that impurities can affect surface diffusion i.e. impurities can adsorb preferentially to step edges7,8, where they may hinder diffusion and initiate non-smooth growth. Surface defects provide preferred adsorption sites for chemi- or physisorbed particles drastically affecting diffusion9.
quantify diffusion is with the diffusion coefficient, D, which is measured in area per unit time. An equation for diffusion can be written as:
0exp (1.5) diff
B E
D D
k T −
=
where kB is Boltzmann’s constant, T is the temperature, and D0 is the diffusion prefactor
which is the value for D at T→∞ or when kBT >>Ediff. Ediff is the diffusion barrier, which is the range in potential energy laterally. At very low temperatures this equation does not accurately describe diffusion since quantum tunneling dominates. However, when kBT is on
the order of Ediff, one obtains for a particle on a 2D plane
2
(1.6) 4
h f d D=
where fh is the hopping frequency between sites and d2 is the mean square site distance. At
higher temperatures kBT >>Ediff, and Brownian motion occurs where the substrate is not seen
by the adsorbates and a 2D gas is observed. Einstein’s relation can be written in 2D from Bird10 as:
(1.7)
B k T D
A
η =
where η is the interfacial coefficient of friction and A is the area of contact with the substrate. The friction coefficient η is defined as η = ρ/τ where ρ is the mass per unit area of a particle, cluster of particles, or a 2D film.
increasing adsorbate coverage that range from treatments of self-diffusion of individual particles11, (Fig. 1.3a) to self-diffusion of island clusters12, (Fig. 1.3b) to spreading diffusion within complete monolayers11,13,14, (Fig. 1.3c) as described next.
Fig. 1.3 shows a depiction of a) single molecule diffusion, b) island cluster diffusion, and c) spreading diffusion.
The diffusion and spreading coefficients referred to so far are two-dimensional quantities that are defined in an entirely distinct manner from the spreading rate of a macroscopic droplet placed on a surface. Such macroscopic droplets may completely wet, incompletely wet, or not wet surfaces that they are in contact with, and it is common to define a “spreading coefficient” K to gauge whether wetting will occur:
A B AB
K =γ −γ −γ (1.8) The term γA is the surface energy or surface tension of the solid, γB is the surface tension of
the liquid in question, and γAB is the interfacial tension15. If K is positive then the liquid will
behavior16. Dash’s correspondence between sub-saturation adsorption behaviors and macroscopic wetting types is depicted in Fig. 1.4 for the cases of (a) “complete”, (b) “incomplete” and (c) “nonwetting” behaviors. With increasing coverage adsorbed films may form (a) ever thickening uniform layers, (b) a uniform two-dimensional layer after which all material goes to form a bulk droplet at the bulk saturation vapor pressure, or (c) only trace amounts may condense in advance of bulk droplet formation. Macroscopic wetting characteristics can thus be probed through recording of adsorption data at sub-saturation vapor pressures where droplet formation is completely inhibited. A quartz crystal microbalance (QCM) is an ideal tool for studies of film adsorption and wetting at these sub-saturation pressures, including sub-monolayer coverages. The focus here on film spreading and diffusive behavior that is restricted to two dimensions.
Fig. 1.4 Three types of wetting behavior at and below the saturated vapor pressure P0,
1.3 Various Diffusion Coefficients
(A) Brownian motion of mobile particles and the windshield wiper effect:
It was recently reported that when a mobile overlayer is present on a metal surface, a MHz transverse oscillation created by a combined quartz crystal microbalance-scanning tunneling microscope (QCM-STM) can produce a clearer tunneling image of the metal surface compared to the same system without oscillation17. This observation was attributed to a “windshield wiper” effect in which rapid oscillation at the tip-surface interface created a region below the tip where at least part of the mobile overlayer was wiped away causing a clear image seen in the lower half of Fig. 1.5a. Noise in the STM image for a non-oscillating QCM was attributed to surface diffusion of adsorbate molecules in and out of the region between the tip and substrate. This phenomenon shown in the upper half of Fig. 1.5a is consistent with the fact that the “windshield wiper” effect is absent for non-mobile adsorbates.
The flow model that Brenner used to describe the QCM-STM dynamics was later extended to an analytic multi-scale expression for effective liquid lubrication of oscillating contacts via surface flow where a fraction of the lubricant is removed from the contact at each cycle14. Using a simplified flow model, a unitless scaling quantity S was identified that provided a multi-scale measure of the effectiveness of a liquid lubricant replenished via surface flow. The unitless scaling parameter S of a reciprocating contact is defined as
(1.9)
c f A S
D =
where f is the repetition frequency that the lubricant is removed, Ac is the contact area
scratched free (or partially free) of the lubricant, and D is the lubricant single molecule diffusion coefficient. The lubricant steady-state center concentration C shown in Fig. 1.5b is defined as
( )
1(1.10)
AS B C S
e + =
For the data presented in Fig. 1.5b, realistic values for the frequency and contact area yield 10-3 cm2/s for the removal rate parameter, (f Ac). A self-diffusion coefficient of 10-3 cm2/s
shown however to be vastly insufficient to refill the area scraped free in one cycle, as might be expected intuitively. The self-diffusion coefficient must be approximately 100 – 1000 times greater in order for this to occur. Such values may not be unrealistic for islands of particles, as discussed next.
Fig. 1.5 shows the “windshield wiper” effect for a) a non-oscillating QCM (noisy region) and an oscillating QCM (clear region). b) The lubricant steady-state center concentration
at the contact for values coinciding to the area of an STM tip and the frequency of a QCM. The red curve corresponds to 10% of the lubricant removed per cycle, and the blue curve corresponds to 0.1% of the lubricant removed per cycle. This was reproduced
(B) Brownian motion of islands.
The diffusive and frictional behavior of clusters of particles is distinct from that of their constituent particles, (Fig. 1.3a, b) and can vary dramatically with size. Sliding friction values may drop for clusters of atoms, for example, because the formation of an island generally requires that some or all of the atoms in the layer becomes incommensurate with the substrate. Gold islands of 250 atoms have been routinely observed to diffuse on graphite substrates with surprisingly large diffusion coefficients18 (D = 1000 cm2/s and Ed = 0.5 eV
compared to single atom values19 of D = 0.002 cm2/s and Ed = 0.08 eV) Similar behavior has
been reported for other metal clusters as well20.
Pisov and coworkers have suggested that the diffusive behavior of such islands can be probed by means of QCM via the fluctuation-dissipation relation12. In particular, they suggest that the cluster drift mobility can be related to an island diffusion coefficient Di
through the Einstein relation, (1.7) written as Diη2Α = kBT, to obtain:
(1.11)
i B D mN
k T
τ =
where τ is a measurable quantity of the QCM described in Ch.3, ρ2 = mN/A is the mass per
that of a spreading film replenishing regions of low density due to internal pressure gradients. An analytic model of the latter phenomenon is described next.
(C) Spreading diffusion of an adsorbed monolayer.
If a small amount of liquid is placed on a surface, then the rate of increase in surface area of the liquid as it spreads into a thin film defines how quickly the area can be replenished. Experimentally obtained values, however, are generally not easy to obtain. Widom and Krim described one such method in 1994, by deriving how the spreading diffusion coefficient Ds can be experimentally determined from slip times and adsorption
isotherm information obtained from QCM measurements at sub-saturation vapor pressures13. Through substitution of Eq. (6) into Eq. (7) in the paper by Widom and Krim the spreading diffusion coefficient, measured in cm2/s, is given by:
2
(1.12)
S
T
D τ ϕ
ρ
∂
= ∂
where φ is the film spreading pressure, or the force per unit length exerted on an arbitrary boundary within the film. The spreading pressure can be obtained from adsorption isotherm data, since it can be written in the form:
( )
' 2( )
0' (1.13)
P
B P
k T
P dP
m P
ρ
ϕ =
∫
to spread back into a contact where it has been scraped off: Simply stated, if Ds= 1 cm2/s,
then a 1 cm2 area brushed free of an adsorbed film will be replenished by sideways flow in a period of 1 s. For this to occur, it is of course necessary that a reservoir of lubricant be present to resupply the emptied area. This reservoir might be a resupply from the gas phase onto an adjacent area of the surface21 or perhaps a nearby high surface area region that acts as a sponge or ballast for the film material to flow into the uncovered region.
In the case reported here, the spreading diffusion coefficient Ds, not to be confused
with the spreading coefficient K from (1.8), is akin to the rates of spreading seen in the literature. The units of Ds of cm2/s are equivalent to the rates of spreading and other
diffusion coefficients mentioned before. Rates of spreading are seen in the literature to be many orders of magnitude greater than the single particle diffusion coefficient22,23,24. These references also show similar measured values of rates of spreading to our experimental results.
significant source of lubricant replenishment, depending on the geometry and vapor pressure of the adsorbed film species, sideways surface flow must always be taken into account in a complete treatment of the topic.
1.4 Aims of the Dissertation
particular case, but in agreement with a larger diffusion coefficient. All of these results were fit to Brenner’s model and showed good agreement but also elucidated some caveats in the model which need to be accounted for when comparing to MEMS. A measurable increase in adhesion with the addition of TCP was witnessed on the nanoscale but not on the macroscale. In addition to the lubrication model, this increase of adhesion and capillary effects in a MEMS contact must be taken into account to ensure lubrication.
The other aspect of this dissertation is the diffusion of various alcohols on these same substrates. Alcohols (specifically propanol and pentanol) have been shown to reduce adhesion in a nanoscale contact28 and indefinitely extend the lifetime of a MEMS device29 so long as an environment of alcohol vapor is present. Diffusion coefficients were calculated for the spreading diffusion coefficient Ds from (1.12) and the island diffusion coefficient Di
from (1.13) at full and half monolayer coverages. At full monolayer coverage it is clear to see why alcohols lubricate a MEMS device according to the spreading diffusion coefficient. At half monolayer coverage the island diffusion coefficient drops and values and lubrication is not as obvious.
witnessed with trifluoroethanol (TFE) on a SAM which was different than pentanol and ethanol on a SAM. It showed no measurable slip time akin to each of the alcohols on aluminum as well. No slippage or slippage immeasurable by the QCM may translate to a lower surface diffusion coefficient and thus poor lubrication. This supports the notion that without a vapor contribution, TFE will not lubricate a device even with a SAM acting as a reservoir since surface diffusion will be limited.
1
G. Amontons, Mem. Acad. Roy. Sci. 206 (1699).
2 F.P.D. Bowden and D. Tabor, Friction and Lubrication of Solids, Part I, Oxford University Press, Oxford
(1954).
3
J. N. Israelachvili and D. Tabor, Proc. R. Soc. Lond. A 331, 19 (1972).
4 J. N. Israelachvili and D. Tabor, Prog. Surf. Membr. Sci. 7, 1 (1973).
5 B. Bhushan, J. N. Israelachvili, and U. Landman. Nanotribology: friction, wear and lubrication at the atomic
scale. Nature, 374:607, (1995).
6 A. Fick, Phil. Mag. 10, 30 (1855).
7
J.V. Barth, “Transport of adsorbates at metal surfaces: from thermal migration to hot precursors” Surf. Sci. Rep. 40, 75 (2000).
8 M. Kalff, G. Comsa, T. Michely, “How Sensitive is Epitaxial Growth to Adsorbates?” Phys. Rev. Lett. 81,
1255 (1998).
9 M. Giesen, “Step and island dynamics at solid/vacuum and solid/liquid interfaces” Prog. Surf. Sci. 68, 1
(2001).
10 Bird, R. B., Stewart, W. E., Lightfoot, E. N., “Transport Phenomena,” Wiley, New York, (1962).
11 M. Abdelmaksoud, S.M. Lee, C.W. Padgett, D.L. Irving, D.W. Brenner, J. Krim. Lang. 22, 9606 (2006).
12 S. Pisov, E. Tosatti, U. Tartaglino and A. Vanossi, Gold Clusters siding on graphite: a possible quartz crystal
microbalance experiment? J. Phys. Condens. Matt. 19, 303015 (2007).
13
A. Widom, J. Krim, Phys. Rev. E. 49, 4154 (1994).
14 D.W. Brenner, D.L. Irving, A.I. Kingon, C.W. Padgett, J. Krim. Lang. 23, 9253 (2007).
16
J.G. Dash, Phys. Rev. B 15, 3136 (1977).
17 B. Borovsky, B.L. Mason, J. Krim, J. Appl. Phys. 88, 4017 (2000).
18 L. Bardotti, P Jensen, A. Hoareau, M. Treilleux, B. Cabaud, A. Perez, Surf. Sci. 367, 276 (1996).
19 C.DeW Van Siclen, Phys. Rev. Lett 75, 1574 (1995).
20 S.C. Wang, G. Erlich, Phys. Rev. Lett 79, 3835 (1999).
21
A.J. Gellman, Trib. Lett. 17, 455 (2004).
22 T. Svitova, H. Hoffmann, R.M. Hill, Langmuir 12, 1712 (1996).
23 A. Chengara, A. Nikolov, D. Wasan, Colloids Surf. A. 206, 31 (2002).
24 S. Zhu, W.G. Miller, L.E. Scriven, H.T. Davis, Colloids Surf. A. 90, 63 (1994).
25 W.G. Sawyer, T.A. Blanchet, J. Tribol. 123, 572 (2001); T.A. Blanchet, J.L. Lauer, Y.F. Liew, S.J. Rhee,
W.G. Sawyer, Surf. Coat. Technol. 68/69, 446 (1994).
26 P.L. Dickrell, W.G. Sawyer, J.A. Heimberg, I.L. Singer, K.J. Wahl, A. Erdemir, J. Tribol. 127, 82 (2005).
27 Eapen, K. C., Patton, S. T., Zabinski, J. S.: Lubrication of MEMS using bound and mobile phases of Fomblin
Zdol. Trib Lett 12, 35-41 (2002).
28 Strawhecker, K., Asay, D. B., McKinney, J., Kim, S. H.: Reduction of adhesion and friction of silicon oxide
surface in the presence of n-propanol vapor in the gas phase. Trib. Lett 19, 17-21 (2005).
29
Chapter 2: MEMS Introduction and Literature Review
2.1 Introduction
Microelectromechanical systems (MEMS) have the potential to revolutionize widespread technologies due to their low manufacturing cost and minute power consumption, but tribological issues have slowed progress immensely30,31,32,33. As these MEMS devices become smaller and smaller, surface effects like van der Waals and capillary forces dominate, and body forces like gravity and inertia become less significant. Currently, devices which are intended for one-time use, like an accelerometer for airbag deployment, work sufficiently well and are used globally. However, there does not exist a single commercially available device which encompasses surfaces in continual sliding contact. Gears and motors which could enable more complicated movements at the microscale have been rendered useless due to friction and other tribological issues. Conventional lubricants cannot be employed even in theory since the viscosity of the liquid would cause extreme power dissipation canceling one of the main qualities of a MEMS device. Adhesion, specifically stiction (irreversible failure resulting from adhesion) has been shown to be an integral contribution to failure.
overcome the adhesive force. In-use stiction occurs when parts come into contact during operation either unintentionally or by design. To eliminate failures from stiction surface modifications are needed. The surface must be made hydrophobic to remove capillary forces, resistive to tribological wear, and stable at high temperatures. Some different proposed solutions to the problem include surface roughening to decrease the area of contact, chemisorbing a solid lubricant to the desired contacts, and utilizing a self-assembled monolayer (SAM) for obtaining a low-surface energy end group.
Fig. 2.1 shows an example of release related stiction. a) shows the device as the water evaporates and b) shows the device irreversibly stuck after evaporation.
are a promising suggestion, but they have many different issues to work out. Firstly, they do not work well in different environments i.e. graphite works well in air but not vacuum and MoS2 works well in vacuum but not humid environments. Secondly, solid lubricants
Fig. 2.2 A MEMS friction tester showing a) the comb drive setup and b) the contact used for optically measuring friction coefficients. Reproduced from Ref. 34.
Fig. 2.3 shows the concept of a mobile lubricant (red wavy lines) replenishing the mechanically worn away SAM keeping the device operable for longer periods of time.
Various combinations of dual layer films emerged after the suggestion by Eapen et al35. The first was Ren et al. who used steric acid onto a SAM, specifically aminopropyltriethoxysilane (APS)36. They witnessed a larger load before failure in a macroscopic tribometry test compared to APS and other SAMs. Perfluoropolyeither (PFPE) was used as the second layer in another dual layer study on APS37. These and other comparison studies of dual- and single-layer films were performed, which showed superior wear resistance for the dual layer films using tribometry techniques from the nanoscale to the macroscale38,39,40. These layers were all dip-coated and were chemisorbed to one another inhibiting mobility and surface diffusion. Since capillary forces are detrimental to MEMS by causing increased adhesion leading to stiction, this deposition process will not be viable for a wide range of MEMS devices.
199841. The benefit of a vapor phase lubricant is that the coverage is uniform even with high occluded portions of MEMS devices42. In the results presented here a liquid layer is adsorbed to the surface via the vapor phase. Capillary forces are still a concern, however, as the layer can traverse the surface and congregate at contacts. Therefore the amount of adsorbed lubricant was kept to a minimum, and this amount will be further discussed later. Following a deposition of a thin layer of lubricant onto the surface, an appropriate surface diffusion lubricant model was used for different situations regarding the various experimentally determined coefficients discussed previously in chapter 1.
2.2 Prior studies of Tricresyl Phosphate
attributed to decreasing wear. The three TCP isomers (o-TCP, m-TCP, p-TCP) were shown to break down similarly in a tribological contact46.
Fig. 2.4 shows the chemical makeup of TCP.
QCM studies using TCP as a vapor phase lubricant on Fe and Cr with and without the presence of O2 showed a measurable slip time on Fe with O2 and not with Cr in any
more traditional tribometers. The value of the slip time of TCP on a SAM was correlated to the computed value of the diffusion coefficient D of TCP on a SAM. The value of D on Si was inferred from the slip time to fit to Brenner’s surface diffusion model to predict the effectiveness of TCP on MEMS.
2.3 Prior studies of alcohols on MEMS
The use of alcohols as a lubricant in the liquid phase stemmed from work showing good lubrication and low wear for silicon oxide and silicon nitride50. The idea to reduce adhesion thus increasing tribological properties on the nanoscale originated from atomic force microscope (AFM) studies of n-propanol on silicon oxide51 and studies of n-alcohols (n=1-12) on SAM treated surfaces52. These promising results prompted studies of MEMS friction tester lifetimes using pentanol films at 15% and 95% partial pressure delivered to the surface from the vapor phase53. Pentanol allowed the friction tester to run for longer than one billion cycles (compared to a bare silicon device, which fails around six thousand cycles in a pentanol free environment) at both partial pressures without failure so long as the device remained exposed to pentanol vapor. The mechanism for lubrication was proposed to be a formation of a high-molecular weight tribo-induced film containing large chains of carbon.
engineering and commercialization of MEMS. In addition, some devices must be open to the surrounding environment to perform their intended task54. In the study reported here, the surface diffusion of alcohols was probed to quantify lubricant replenishment and to investigate the possibility of removing the alcohol vapor while still achieving lubrication. The slip time of three different alcohols including pentanol, ethanol, and trifluoroethanol were measured with a QCM on Si, Al, and a SAM-coated surface. The values were measured during an adsorption isotherm and were measured after the vapor was removed. Values for the spreading diffusion coefficient Ds and island diffusion coefficient Di were
inferred from the slip time.
30
Kim, S. H., Asay, D. B., Dugger, M. T.: Nanotribology and MEMS. Nanotoday 2, 22-29 (2007).
31 Komvopoulos, K.: Adhesion and Friction Forces in Microelectromechanical Systems: Mechanisms,
Measurement, Surface Modification Techniques, and Adhesion Theory. J Adhesion Sci Technol 17, 477-517 (2003).
32 Maboudian, R. Self-assembled monolayers as anti-stiction coatings for MEMS: characteristics and recent
developments. Sensors and Actuators A 82, 219–223 (2000).
33
Mastrangelo, C. H.: Adhesion Related Failure Mechanisms in Micromechanical Devices. Trib Lett 3, 223-238 (1997).
34 Hook, D. A., Dugger, M. T., Krim. J.: Monolayer Degradation in MEMS friction devices. J App Phys
104, 034303 (2008).
35 Eapen, K. C., Patton, S. T., Zabinski, J. S.: Lubrication of MEMS using bound and mobile phases of
Fomblin Zdol. Trib Lett 12, 35-41 (2002).
36 S. Ren, S. Yang, Y. Zhao, Micro- and Macro-Tribological Study on a Self-Assembled Dual-Layer Film.
Langmuir 19, 2763 (2003).
37 N. Satyanarayana S.K. Sinha, Tribology of PFPE overcoated self-assembled monolayers deposited
on Si surface. J. Phys. D. Appl. Phys. 38, 3512 (2005).
38 N. Satyanarayana, S.K. Sinha, B.H. Ong, Tribology of a novel UHMWPE/PFPE dual-film coated onto Si
39 Y. Mo, M. Zhu, M. Bai, Preparation and nano/microtribological properties of perfluorododecanoic acid
(PFDA)–3-aminopropyltriethoxysilane (APS) self-assembled dual-layer film deposited on silicon. Coll. and Surf. A: Physicochem. Eng. Aspects 322, 170 (2008).
40 B. Yu, L. Qian, J. Yu, Z. Zhou, Effects of Tail Group and Chain Length on the Tribological Behaviors
of Self-Assembled Dual-Layer Films in Atmosphere and in Vacuum. Trib. Lett. 34, 1 (2009).
41 Krim, J., Abdelmaksoud, M.: Nanotribology of Vapor-Phase Lubricants. in Tribology Issues and
Opportunities in MEMS, B. Bhushan, ed. 273-284 (Kluwer Academic, Dordrecht, 1998), invited.
42 Gellman, A. J.: Vapor lubricant transport in MEMS devices. Trib Lett 17, 455-461 (2004).
43 Forster, N.H., Trivedi, H.K.: Rolling Contact Testing of Vapor Phase Lubricants--Part I: Material
Evaluation. Trib. Trans. 40, 421 (1997).
44 Sung, D., Kim, D., Gellman, A.J.: The surface chemistry of vapor phase lubricants: tricresylphosphate on
Ni(100). Trib. Inter. 38, 151 (2005).
45 Weimin, L., Klaus, E.E., Duda, J.L.: Wear behavior of steel-on-Si
3N4 and Si3N4-on- Si3N4 systems with vapor phase lubrication of oleic acid and TCP. Wear 214, 207 (1998).
46 Sung, D., Gellman, A.J., Thermal decomposition of tricresylphosphate isomers on Fe. Trib. Lett. 13, 9
(2002).
47 Abdelmaksoud, M., Bender, J., Krim, J.: Bridging the Gap between Macro- and Nanotribology: A Quartz
Crystal Microbalance Study of Tricresylphosphate Uptake on Metal and Oxide Surfaces. Phys Rev Lett 92, art. no 176101 (2004).
48 Abdelmaksoud, M., Bender, J., Krim, J.: Nanotribology of a Vapor-Phase Lubricant: A Quartz Crystal
Microbalance Study of Tricresylphosphate (TCP) Uptake on Iron and Chromium. Trib Lett 13, 179-186 (2002).
49 Neeyakorn, W., Varma, M., Jaye, C., Burnette, J. E., Lee, S. M., Nemanich, R. J., Grant, C. S., Krim, J.:
Dynamics of Vapor-Phase Organophosphates on Silicon and OTS. Trib Lett 27, 269-276 (2007).
50 Gates, R.S., Hsu, S.M.: Silicon Nitride Boundary Lubrication: Lubrication Mechanism of Alcohols. Trib.
Trans. 38, 607 (1995).
51 Strawhecker, K., Asay, D. B., McKinney, J., Kim, S. H.: Reduction of adhesion and friction of silicon
oxide surface in the presence of n-propanol vapor in the gas phase. Trib. Lett 19, 17-21 (2005).
52
Clear, S.C., Nealey, P.F.: Lateral Force Microscopy Study of the Frictional Behavior of Self-Assembled Monolayers of Octadecyltrichlorosilane on Silicon/Silicon Dioxide Immersed in n-Alcohols. Langmuir 17, 720 (2001).
53
Asay, D. B., Dugger, M. T., Kim, S. H.: In-situ Vapor-Phase Lubrication of MEMS. Trib Lett 29, 67-74 (2008).
54 McComas, D. J., Miller, G. P., Mitchell, J. N., Pope, S. E., Valek, P. W.: Space applications of
Chapter 3: Experimental Details
3.1 Quartz Crystal Microbalance studies of sliding friction and diffusion55.
Many different experimental techniques were used in this study. QCM data and all sample preparation of Si wafers were performed by myself at NC State. In addition, the macroscopic reciprocating tribometry measurements of tricresyl phosphate (TCP) on Si were performed by myself at the Naval Research Laboratory (NRL). The remaining TCP data reported herein were recorded by MURI team collaborators on samples prepared by myself at NCSU.
coefficient at room temperature. Fig. 3.1 shows a diagram of a QCM and a side view of the oscillation. The resonant frequency depends on the thickness of the quartz and can range from 5-10 MHz. This technique assumes a thin, uniformly covered layer which is rigidly attached for a direct proportionality between the negative change in resonant frequency of the QCM to the mass per unit area of the adsorbed film.
Fig. 3.1 a) top and b) side view of a QCM oscillating in shear mode. Taken from Ref. 57. 3.1.1 Mass Uptake Relationship
the half wavelength of the induced wave. Then, the fundamental frequency f is given 0
by:
q q
0 v v (3.1) 2
f
t
λ
= =
where v is the speed of wave propagation in quartz, q λ is the wavelength and t is the thickness of the quartz. Differentiating the logarithm of both sides and using mq = ρq At one can obtain the change in frequency due to the adsorbed mass per unit area on one side of the crystal:
f 2
q (m / A)
2 (3.2)
v o
q
f f
ρ
∆ = −
where ρq is mass density of quartz and mf is the mass of the film substituted for the
differential dmq as long as mf is much smaller than mq. The equation is valid as long as
the attached film is non-dissipative. An interesting situation arises when the adsorbed film is not rigidly attached.
3.1.2 The Quality Factor
While measuring the change in amplitude of the oscillating signal one can
the layer will slip enough to be detectable by the QCM through frequency and amplitude measurements. This dissipation is related to the quality factor Q mentioned before which is defined as
Total Energy in one cycle
2 (3.3) Energy lost in one cycle
Q = π
It is clear that the dissipation is related to the inverse quality factor Q−1. There is inherent dissipation from the quartz, and any additional dissipation from an adsorbed film can be added directly
1 1 1
(3.4)
q f
Q = Q + Q
What follows is a derivation of the acoustic impedance of the situations arising from an adsorbed film and how it can be related to the interfacial slippage, or sliding friction.
3.1.3 Acoustic Impedance of a Viscous Film
Consider a flat surface oscillating in plane with velocity u =u0 e−iwt with an
( )
2( )
x x
3 3 2
, ,
(3.5)
f f
z t z t
t z
υ υ
ρ ∂ = η ∂
∂ ∂
where the x-direction is in line with the motion of the substrate. The subscript “f” refers to the film (“v” will refer to the vapor), and the subscript “3” refers to the 3D, or bulk values (“2” will refer to the 2D, or surface values). The solution to (3.5) for a frequency f
under the assumption that the film does not slip at the interface is given by
( )
x
cos ( )
, ( ) (3.6) cos( )
k d z
z t u t
kx
υ = −
where k=(1+i)(ωρ / 2η)1/2 is the dispersion relation. The acoustic impedance, Z = σzy / v,
can be obtained from the stress tensor component σzy = η(δv/δz)z=0 written as
3 2
3
3
tan( ), f (3.7)
f f f f
f
Z R iX η k kd where k iωρ
η
= − = =
The real (resistive) component of Z relates to the energy dissipation, while the f
imaginary (reactive) component relates to the inertia of the oscillator.
It has been shown58 that the total impedance is related to the frequency and quality factor shifts of the QCM by
2 1
, (3.8)
tot tot
q q q q
R X
Q t t
δ δω ωρ ρ = =
limit, where kd 〈〈1, tan(kd reduces to kd and the real part of Z) f vanishes reducing the
acoustic impedance to
3 2 (3.9)
f f f f
Z = − iX = −iωρ d = −iωρ
Substituting (3.9) into (3.8) produces the Sauerbrey result for the mass-frequency relationship given by (3.2).
3.1.4 Acoustic Impedance of a 3-Dimensional Gas
When the QCM is exposed to a gaseous environment, the acoustic impedance introduced to the oscillator results from the shear impedance of the gas. If adsorption from the vapor phase occurs, then the acoustic impedance introduced has an additional component from the mass uptake. Consider the case when there is only gas damping and no adsorption. The acoustic impedance to shear wave propagation is given by
3 3
(1 ) (3.10)
v v v v v
Z = R − i X = −i πρ η f
Substituting (3.10) into (3.8) one can calculate frequency shifts and δ
( )
1 Q . However, at low pressures, τr (time for excess particle momentum to relax after collision with thevibrating crystal) of the gas particles becomes similar to the period of oscillation. The gas cannot be regarded as a simple viscous fluid but must be looked upon as viscoelastic. Its viscosity now becomes a function of frequency where
* 3
3 (3.11) 1
v v
r i
η η
ωτ =
The resistance and reactance of Z of the viscoelastic gas are v*
( )
( )
( )
( )
*
3 3 2 2
*
3 3 2 2
1
1 1 (3.12) 1
1
1 1 1
r
v v v
r r
r
v v v
r r R f X f ωτ πρ η ωτ ωτ ωτ πρ η ωτ ωτ = + + + = + − +
For pressures higher than 300 Torr, ωτr 〈〈1, the gas does not behave viscoelastically, so the gas can be regarded as a simple viscous fluid.
3.1.5 Separation of Film and Vapor contributions
Now consider the case of adsorption occurring from the vapor phase. The shear waves produced by the QCM will diffuse through the film and into the surrounding gas. The acoustic impedance in this environment will now have contributions from both the adsorbed film and the vapor. Assuming a no-slip (no energy dissipation) condition at the film-substrate boundary, the acoustic impedance is given by
(
)
( )
( )
( )
( )
3 3 33 3 3
3 3 3
3 3 3 tanh , tanh
1 (3.13) 1 1 2 fv f v f
v v v
f f f
f v
f
Z Z d
where
Z Z
Z i f
Z i f
Again, assuming a thin film limit of kd 〈〈1, then the acoustic impedance simplifies to 2 3 2 3 3
1 v , 1. (3.14)
fv f v
f Z
Z i Z kd
Z
ωρ
= − − + 〈〈
Since the acoustic mismatch factor
− 2 3 3 1 f v Z Z
is close to unity in many cases, (3.14)
can be additionally simplified to
2 3 (3.15)
fv f v f v
Z = −iωρ + Z = Z + Z
The damping effects of both the film and the gas vapor on the QCM can now be broken apart and one can write the frequency and quality factor shifts separately as
( )
( )
( )
(3.16)1 1 1
0
f v
f v
q q q q
v q q f v X X t t R
Q Q Q t
δ ω δ ω δ ω ρ ρ δ δ δ ωρ = + = + = + = +
3.1.6 Damping from Interfacial Slippage of an Adsorbed Layer
2
1 1 1
(3.17)
tot fv
Z = η + Z
Solving for the dissipative and reactive terms gives
(
)
(
)
2
2
2 2 2
2
2
2 2 2
2 2
(3.18) 1
tot v
tot tot v v
tot v
tot tot v v
X X
R X R X
R R
R X R X
ωρ ωρ η ωρ + = + + + = + + + +
This approach is a small modification to the original derivation by Krim and Widom, where 2 2 (3.19) f tot v f Z Z Z Z η η = + +
was used in place of (3.17). In the low vapor density limit, the two approaches give identical results. However, as the vapor density increases, the Bruschi and Mistura approach gives a 10% - 15% correction to the Krim and Widom approach.
To calculate the slip time, τ, one can solve for η2 from (3.18) and use the relation
2 2 (3.20) f ρ τ η =
where τ is the time that the total film momentum takes to fall to 1/e of its original value if the substrate were to stop abruptly. It is to be noted that τ is an average value over the entire film, since not all of the particles are sliding the same amount at any given time.
interfacial slippage. For a sliding adsorbed film without the surrounding vapor, the determination of τ becomes simpler. The resistive and reactive components of Z2 are
2 2
2 2 2
2
2 2 2
(3.21) 1 1 R X ρ ω τ ω τ ρ ω ω τ = + = +
Plugging in (3.21) into (3.8) and dividing one can obtain 1
2 (3.22)
Q
δ = τδω
It is clear to see that in order to determine interfacial slippage, one must measure the quality factor shifts and resonance frequency shifts simultaneously. To accomplish this task the quality factor shifts must be quantified. What follows is an analysis of how the amplitude of oscillation can be used to measure the change in quality factor.
3.1.7 Experimentally Observing Quality Factor
The equation of motion for a damped driven harmonic oscillator, and its analogous electrical equation are
( )
( )
2 0 2 2 0 2cos (3.23) 1
cos
d x dx
m b kx F t
dt dt
d q dq
L R q V t
dt dt C
ω
ω
+ + =
+ + =
series with an alternating emf. Substituting the solution of x = Acos
(
ωt−φ)
into (3.23) one obtains( )
(
)
0 22 2 2
(3.24)
F A
k m c
ω
ω ω
=
− +
with the phase angle as
2
arctan c (3.25)
k m ω φ ω = −
where A(ω) is a mechanical amplitude (in meters) of oscillation. Using ω0 = k m
and m 0
Q c
ω
= , (3.24) can be rewritten as
( )
(
)
0
2 2
2 2 0
0 (3.26) F m A Q ω ω ω ω ω = − +
A simplification occurs when the QCM is driven at its resonance frequency. Therefore, (3.26) becomes
( )
00 2 0 (3.27) F Q A m ω ω ≅
The change in the amplitude with frequency and the change in amplitude with quality factor are shown to be
2 0 0 0 0 1 1 (3.28) 1 m m A A and
F F Q
Substituting the experimental values,ω ≈108 Hz and Q ≈105, one can obtain
( )
13
1 1
10 (3.29) 1
A A
Q
ω
∂ ∂
≅
∂
∂
This illustrates that changes in the mechanical amplitude of vibration are independent of changes in frequency. Since the voltage of the oscillating signal is proportional to the mechanical oscillation at the surface60, amplitude changes in the voltage output may be used to directly measure changes in the quality factor.
Measuring the QCM amplitude and ring down decay curves are two ways to monitor ∆Q−1. Using (3.10) one can use a gas like N2 or He in the high pressure range to
get a proportionality constant between ∂
( )
1 A and ∂( )
1 Q since neither gas will adsorb onto the QCM at room temperature. Fig. 3.2 shows a typical N2 calibration from thisFig. 3.2 shows the raw data for the inverse amplitude vs. pressure and the inverse amplitude vs. the inverse quality factor for the same sample calibration of nitrogen gas.
A clear linear relationship is seen between the inverse quality factor and the inverse amplitude. Data taken from file 9-19-08n2.txt
When power is switched off to the QCM, the voltage at the electrodes decays exponentially as
( ) o t sin( ) (3.30)
A t =A e− τ ω φt+
where Ao is the driven amplitude, τ is the decay time constant, and φ is the phase. The
inverse quality factor is related to τ as
1 2
(3.31)
Q=ωτ
3.1.8 Applications of a QCM
a) Slip time comparison:
Fig. 3.3 shows the slip time τ as a function of amplitude showing a discrete jump in the slip time from a no-slip condition to a slip condition with increasing amplitude.
Reproduced from fig. 2 in Ref. 64.
A comparison to macroscale phenomena was seen with QCM studies of tricresyl phosphate (TCP) adsorbed on Fe and Cr in the presence of oxygen. Two distinct behaviors were seen on the atomic scale showing a slip time value of zero for TCP/Cr and a non-zero value for TCP/Fe. These results were correlated to the macroscale where TCP/Cr contacts exhibit poor tribological properties and TCP/Fe contacts demonstrate very low friction coefficients. A look at these situations has provided a unique perspective on the fundamentals of friction at the atomic scale, but how can a QCM be used to directly measure applicable quantities?
b) Contact replenishment:
lubricant. Clearly, the amount of surface diffusion is critical to determine the time for surface replenishment to occur. The rate of increase in surface area of a drop of liquid in contact with a surface which it can wet depends on the interfacial friction and the film spreading pressure, φ, obtainable from an integration of the vapor pressure isotherm. Defining a spreading diffusion coefficient as
2
(3.32)
S
T
D τ ϕ
ρ
∂
=
∂
which is measured in area per unit time and can be experimentally calculated. The QCM is uniquely suited to probe these conditions. Values of Ds range from 0.2 - 2 cm2/s for
liquid nitrogen and krypton on gold.
A different lubrication model involving the single particle diffusion D which is
not directly measured by the QCM due to island formation at low adsorbent coverages, was developed to span a wide range of cyclical contacting systems from magnetic hard disk drives (MHDD) to micro-electro-mechanical systems (MEMS) to industrial machines. This model incorporated the area and frequency of contact, D, which can have
QCM, and the bottom half shows an image while oscillating. This situation was explained by this model as a non-lubricating regime where the lubricant does not have enough time to diffuse into the contact due to the MHz oscillations of the QCM. A non-lubricating regime is ideal in this case since the mobile lubricant is getting in the way of the STM tip.
c) A QCM in contact:
Microparticles have been utilized with a QCM to determine the force of adhesion and the strength of the bond. Breaking of the bond was witnessed acoustically by increasing the drive voltage and was dependent on the size of the particle and the strength of the bond. Using an optical microscope, latex spheres have been observed to traverse the surface of an oscillating QCM independent of gravity. Static and kinetic friction play an integral role in determining when bonds break and how far these spheres can move.
d) Measurement of electronic friction:
Electronic friction has been theorized to play an integral part of energy dissipation in a conducting contact. The theory is that energy is transmitted to conduction band electrons while in sliding contact before being transferred to the bulk as phonons. The first instance of an experimental measurement of this theorized electronic friction occurred while using a QCM with a superconductive electrode. Krim et al. in 1998 and 2006 used various gases (N2, He, and H2O) adsorbed on liquid He-cooled Pb electrodes
3.2 Macroscopic Reciprocating Tribometry performed at the Naval Research Laboratory:
Fig. 3.4 shows an illustration of the experimental setup for the macroscopic reciprocating tribometer. The calibrated strain gauges measure the normal and lateral force while the
stage oscillates back and forth.
counterface for 100 cycles along a 5 mm track at a rate of 1 mm/s in ambient laboratory conditions. Lateral force data were collected and averaged per sliding cycle and reported as friction coefficient (lateral/normal force). In addition, higher loads of 1 N and 2 N were performed for one specific case only.
Fig. 3.5 shows a schematic of a Wheatstone bridge used for determining mechanical strain.
track were optically imaged using a white light interferometer. Wear scars (or lack thereof) were imaged and recorded for certain characteristic data runs.
3.3 Microscopic Reciprocating Tribometry performed at the Naval Research Laboratory:
Fig. 3.6 shows an illustration of the setup for the micro-tribometer. The sample stage oscillated forward and backward creating a reciprocating contact.
µN load was applied to a parabolic polished diamond counterface, ~8 µm radius, resulting in a mean Hertzian contact stress of ~1.8 GPa. The tip oscillated for 40 cycles along an 8 µm track at a rate of 4 µm/s.
3.4 Atomic Force Microscopy performed at North Carolina State University:
Fig. 3.7 shows an AFM in lateral force mode. The laser deflection in normal and lateral directions is used for frictional force calibration.
Friction behavior was measured with an Atomic Force Microscope (AFM) (Asylum Research, Santa Barbara, CA) illustrated in Fig. 3.7 under ambient conditions at 22°C and 44% relative humidity. Olympus OMCL-RC800 rectangular (20 x 200 micron) SiN levers with pyramid silicon nitride tips (Si3N4, Olympus, Tokyo, Japan) having
setpoint from positive (compressive) to negative (tensile) load until the tip separated from the surface. The adhesive force of the tip-sample junction was defined as the magnitude of the tensile force at pull-off while the lateral friction force was defined as the half-width of the friction force loop at each load. Normal and lateral forces were calibrated according to methods outlined in 68 and 69, respectively. The normal force calibration relies on the resonant frequency, quality factor, and geometry of the cantilever. The lateral force calibration uses a commercially available grating with planar facets simplifying the calibration. Cantilever-tilt compensation was employed to reduce coupling with sample topography70. One SAM coated and one TCP/SAM coated Si wafer were tested at multiple points per wafer. Using 20 nm as the tip radius, a Hertzian contact pressure of 2.0 GPa is calculated at the maximum load (~6 nN including adhesion).
3.5 Vacuum System
The QCM data and the generation of TCP samples were performed in the vacuum chamber illustrated in Fig. 3.8. This chamber was modified from an existing chamber to fit the needs of the present studies. These modifications include a liquid nitrogen-cooled (LN2) trap to condense any errant TCP vapor before contamination of the pump and its
eventual release into the laboratory environment, the addition a leak valve to allow alcohol adsorption, and a transfer arm to manipulate samples inside the chamber. There are three stages of pumps on this system to achieve high vacuum (HV). The first is a roughing sorption pump which was used to go from atmospheric pressure (760 Torr) to a point where the turbomolecular pump (turbo) may be used (mTorr). The sorption pump is a LN2-cooled chamber filled with a high surface area zeolite which acts as an
Fig. 3.8 shows a schematic of the custom modified vacuum system showing pressure gauge, various pumps, and sample manipulators (not to scale).
3.6 QCM electrode preparation
ex situ in a vacuum chamber dedicated for metal deposition. They were fabricated by
thermally evaporating titanium and aluminum layers in vacuo onto both sides of commercially available, blank 8MHz AT-cut quartz crystals, obtained from Colorado Crystal Corp. An additional QCM acting as a rate monitor was placed beside the blank crystals to infer the desired amount of evaporant achieved on the samples. The titanium layer was 20 nm thick and acted as an adhesion layer for the 50 nm thick aluminum coating.
3.7 SAM deposition onto QCMs and Si Wafers
The SAM, perfluorodecyl-trichlorosilane (PFTS) CF3(CF2)7(CH2)2SiCl3, was
min each to remove any unbonded silane chains. The same procedure was used to coat the aluminum and silicon crystals used in QCM measurements.
Fig. 3.9 shows an illustration of PFTS and the schematic for its chemisorption to a silicon oxide surface.
One way to determine the wettability of a liquid droplet on a surface is to measure the angle of the edge of the droplet to the center of the droplet. If the contact angle is low, then the liquid is said to wet the surface. If the contact angle is high, then the liquid is said to not wet the surface. This contact angle is shown in Fig. 3.10 of water on SiO2
(very low ~5°) and on PFTS (very high ~100°). SiO2 is known to be hydrophilic, and
Fig. 3.10 shows the approximate contact angle and wettability of water on a hydrophilic SiO2 surface (left) and a hydrophobic PFTS surface (right).
3.8 Tricresyl phosphate adsorption onto QCMs and Si Wafers
LN2 trap. A LabView program was used to measure the frequency and amplitude shifts
of the QCM during deposition. Prior to QCM friction measurements a high-purity N2
calibration was performed for quality factor conversions. The QCM was used to standardize the amount of TCP uptake for all wafer depositions.
3.9 Characterization of PFTS and TCP adsorption
line shapes after modeling the inelastic electron background with a linear combination of Shirley and polynomial functions.
Both XPS and FTIR confirmed that the deposition procedures produced surfaces containing the bound PFTS and mobile TCP layers, respectively. The XPS survey spectrum shown in Fig. 3.11 of the PFTS coating on silicon and the TCP/PFTS layers on silicon confirmed the presence all the expected surface species (silicon, carbon, oxygen, and fluorine) except for phosphorus from TCP. Although peaks were evident in the P 2p region between 124-144 eV, these could not conclusively be identified as phosphorus since single crystal silicon substrates produce plasmon resonances that directly overlap at the same binding energy. High resolution scans of the C 1s region determined the presence of four peaks in both the PFTS coating and the combination PFTS/TCP layer on silicon. Two of these peaks are characteristic of surface carbon contaminants and the other two are shifted to higher binding energies, typical of two unequivalent carbon-fluorine bonds, -CF2 and -CF3. These latter peaks confirmed the presence of PFTS on the
Fig. 3.11 High-resolution XPS spectra of the C-1s region taken of a) the bound PFTS layer on silicon and b) the combined bound PFTS and mobile TCP coating confirmed the presence of the carbon-fluorine bonding, indicative of the C-F2 and C-F3 bonds present in