An Efficient Approach towards Thunderstorm
Detection Using Saliency Map
Rasika P. Gawande1, Prof. Namrata D. Ghuse2
Department of computer science and engineering, S.G.B.A. University,
Amravati, India.
Abstract
—
Thunderstorm is a sudden electrical expulsionmanifested by a lightening with a particular sound. It is one of the most spectacular weather phenomena in the atmosphere which occurs seasonally. The prediction of thunderstorms is said to be the most complicated task in weather forecasting, due to its spatial and temporal extension either dynamically or physically. Every thunderstorm produce lightening, this kills more people every year than tornadoes and hurricanes. Heavy rain from thunderstorm leads to flooding and causes extensive loss to property and other living organisms. Different scientific, technological researches are been carried on the forecasting of this severe weather feature in advance to reduce damages. In this, many of the researchers proposed various methodologies like TOA Method, DF+TOA method, Interferometry method, and segmentation based method and so on for the detection. The research work adopted clustering and wavelet transform techniques in order to improve the thunderstorm prediction rate. The study carried on the thunderstorm prediction using saliency map, clustering and wavelet techniques resulting with higher accuracy.
Keywords
-
Clustering, Haar wavelet transform, Saliency map, Satellite imagery, Thunderstorm.I. INTRODUCTION
A thunderstorm is a rain shower during which you hear thunder sound and thunder. Since thunder comes from lightning, all thunderstorms have lightning. Three basic ingredients are required for a thunderstorm to form i.e. moisture, unstable air, and a lifting mechanism to provide the “nudge.” The sun heats the surface of the earth and warms the air above the surface of the earth. If this warm surface air is forced to rise—hills or mountains, or areas where warm and cold or wet and dry air bump together can cause rising motion—it will continue to rise as long as it weighs less and stays warmer than the air around it. Then the air rises, it transfers heat from the surface of the earth to the upper levels of the atmosphere. The water vapour starts begins to cooled, releases the heat, condenses and forms the cloud. The cloud grows upward into areas where the temperature is cooled. As a storm rises to the cooled region, different types of ice particles can be created from freezing water drops. The particles can grow by condensing vapour like frost and by collecting smaller liquid drops that haven't frozen yet (a state called "super cooled"). When two cooled particles collide, they collide with each other, but one particle can rip off a little bit of ice from the other one and grab some electric charge. Lots of this collision can build
up big regions of electric charges to cause a lightning, which creates the sound waves hear as thunder.
Thunderstorms have three stages in their life cycle: The developing stage, the maturity stage, and the dissolving stage. In the developing stage of a thunderstorm, it is marked by a cumulus cloud that is being pushed upward by a rising column of air (updraft). The cumulus cloud soon looks like a tower (called towering cumulus) as the updraft continues to develop. There is no rain during this stage but occasional cause lightning. Then thunderstorm enters into the maturity stage. When the updraft continues to feed the storm, but the precipitation begins to fall out of the storm, creating a downdraft (a column of air pushing downward). When the downdraft and the cooled air spread out along the ground it forms a gust front, or a line of gusty winds. The maturity stage is the most likely for heavy rain, lightning, strong winds, and tornadoes. Then a large amount of precipitation is produced and the updraft is overcome by the downdraft beginning in the dissolving stage. At the ground, the gust moves out a long distance from the storm and cuts off the warm and moist air that was feeding the thunderstorm. Then rainfall decreases in intensity, but lightning remains a dangerous.
II. LITERATURE SURVEY
Watson-Watt and Herd [13] in 1920 developed a cathode-ray direction finder (CRDF) that utilized a pair of orthogonal loop antennas tuned to a frequency near 10 kHz, where propagation in the earth- ionosphere waveguide is relatively efficient to detect the horizontal magnetic field produced by lightning. The angle to the discharge was obtained by displaying the north-south and east- west antenna outputs simultaneously on an x-y oscilloscope, so that the resulting vector pointed in the direction of the discharge. Two or more CRDFs at known positions were sufficient to determine the location of a discharge from the intersection of simultaneous direction vectors. Various low frequency CRDF systems were used up to and during World War II in many regions of the world.
E. P. Krider, R. C. Noggle, and M. A. Uman in 1976 an improved magnetic DF system was developed for locating cloud-to-ground lightning within a range of about 500 km. This system operated in the time-domain (i.e., covering the LF and VLF bands from about 1 to 500 kHz) and was designed to respond to field waveforms that were characteristic of the return strokes in CG flashes [6]. When such a field was detected, the magnetic direction was sampled (in both a north-south loop and an east-west loop) just at the time of the initial field peak. The resulting direction vector pointed as closely as possible to the onset of the stroke and to the place where the stroke struck ground.
Hayenga and Warwick [5] in 1981 showed that a radio interferometer could be used to measure the azimuth and elevation angles of lightning sources at VHF frequencies. Rhodes et al. and Shao et al. have developed this technique and have used single-station interferometers to improve our understanding of the development of both IC and CG lightning. These were single station systems that provide a “projection” of lightning onto a plane. Richard et al., and have developed multiple-station networks of interferometers that can locate and map the sources of VHF radiation in two- or three-dimensions with high time resolution.
J.A. Cramer, K.L. Cummins[10] in 1989, they are capable of detecting VLF “spherics” produced by very distant cloud-to- ground lightning. These signals propagate thousands of kilometres by ionospheric reflection. Standard LF/VLF sensors can be simultaneously employed for their conventional use and for this long-range application. For this long-range application, the sensor information is processed in a manner that identifies and employs ionospherically-propagated electromagnetic signals produced by distant lightning, rather than the “normal” ground-wave propagated signals.
Casper and Bent [11] in 1992 have developed a wideband TOA receiver (termed the Lightning Position and Tracking System or LPATS) that is suitable for locating lightning sources at medium and long ranges using the hyperbolic method.
K.L. Cummins, R.O. Burnett, W.L. Hiscox and A.E. Pifer [12] in 1993, Global Atmospherics developed a method for combining direction-finding and time-of-arrival to produce yet another lightning location method which we refer to as the IMPACT method. In this approach, direction finding provides azimuth information and absolute arrival time provides range information. These measurements produce three parameters -- latitude, longitude, and discharge time. Thus, IMPACT method has redundant information which allows for an optimized estimate of location even when only two sensors provide both timing and angle information.
L. Maier, C. Lennon, T. Britt, and S. Schaefer in 1995, the NASA Kennedy Space Center has developed a Lightning Detection and Ranging (LDAR) System that is capable of providing three-dimensional locations of more than a thousand RF pulses within each lightning flash [13], [33]. This system is similar to that of Proctor, but the data acquisition is automatic, and the data displays are generated
in real-time. In order to facilitate the support of this system, which had been the only one of its kind, NASA entered into a technology transfer agreement with GAI to build a COTS version of the system in 1997.
Kishor Kumar Reddy, Anisha P R, Narasimha Prasad L V presented the work in 2014. It uses the segmentation based on clustering. An efficient technique to segment the input image into several clusters based on similarity measure; here Euclidean distance is used as one of the similarity metric. Here, Segmentation is performed to image by based on various color factors because colors possess wavelength values. The image containing relatively similar wavelength values are grouped into different clusters [14].
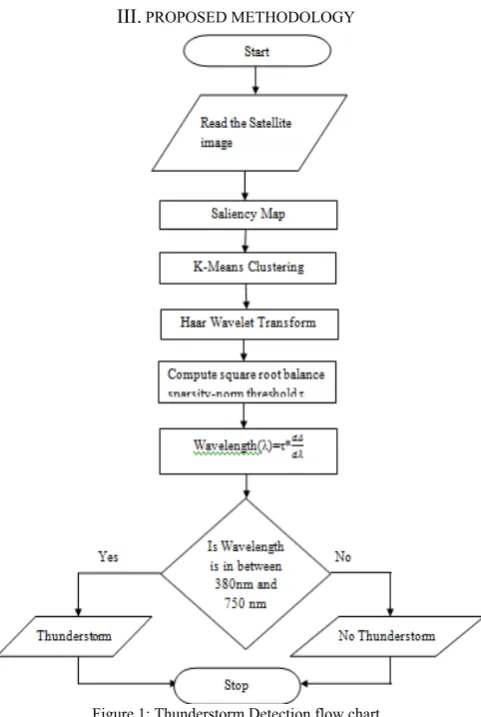
III.PROPOSED METHODOLOGY
Figure 1: Thunderstorm Detection flow chart
The proposed work divided into four parts,
A. Image Collection
The satellite imagery is viewable and the raw data archive can be taken from the US National Oceanic and Atmospheric Administration (NOAA)[16].
B. Saliency Map
portion. The area of image having energy portion can be divided into the two parts i.e. the high energy portion is called foreground and the low energy portion is called background and need to find the foreground energy portion for that different methods can be applied as follows.
On the original image apply the saliency map method. In this saliency map the required data can be extracted on the basis of color, intensity, orientation, size, motion, depth, people and context. The intensity of an image can be calculated with the help of centre and surrounding of an image. Before applying the intensity factor some pre-processing parameters has been calculated and original image with red, green and blue channels Intensity as,
I = (r + g + b)/3
Broadly tuned color channels,
R = r - (g + b)/2
G = g - (r + b)/2
B = b - (r + g)/2
Y = (r + g)/2 - |r – g|/2 – b
The intensity of an image can be calculated with intensity of centre and surrounding and can be formulated as,
I(c, s) = | I(c) Q I(s)|
And then the color feature can be extracted as,
RG(c, s) = | (R(c) - G(c)) Q (G(s) - R(s)) |
BY(c, s) = | (B(c) - Y(c)) Q (Y(s) - B(s)) |
Same c and s as with intensity. Then apply the third feature i.e. orientation feature. In this orientation feature, on the different angle the image can be calculated for that need to create Gabor pyramids for the angles,
For q = {0º, 45º, 90º, 135º}
After getting saliency map image, get the energy part of the image then apply the quaternion method, the quaternion method is the method which is help in getting the energy of the each pixel. The pixel calculation can be done by performing the matrix calculation by comparing a pixel in the 3D space with another pixel. Now, apply the Gaussian filter in a loop of 1 to 8 scale to the Gaussian filter so that after every iteration will get the some more portion of the energy and smooth image. The Gaussian smoothing operator performs a weighted average of surrounding pixels based on the Gaussian distribution. It is used to remove Gaussian noise and is a realistic model of defocused lens.
C. K- Means Clustering
The saliency map image gets from the first part. Now, apply K-means clustering algorithm to the saliency map image. K-means clustering is a well known partitioning method. In this objects are classified as belonging to one of K-groups. The results of partitioning method are a set of K clusters, each object of data set belonging to one cluster. In each cluster there may be a centroid or a cluster representative. In case where we consider real-valued data, the arithmetic mean of the attribute vectors for all objects within a cluster provides an appropriate representative. Algorithm for K-means clustering:-
1. Start
2. Take the saliency map image. 3. Split an Image into multi cluster.
4. Assign each pixel in the image to cluster to minimize distance between pixel and cluster centroid.
5. Re-compute the clusters by averaging all of the pixels in the centroid.
6. Repeat the step 2 and step 3 until no pixel change cluster.
7. Stop
D. Haar Wavelet Transformation
Haar Wavelet compression is an efficient way to perform both lossless and loosely compression. It relies on averaging and differencing values in an image matrix to produce a matrix which is sparse or nearly sparse. After applying the thresholding method, it helps in getting the threshold value of wavelength calculation. Now, will have the detected region and want the values for the calculation of the wavelength for that assign some parameters i.e. a for approximate value ,h for horizontal, v for vertical, d for diagonal values of the image. All these values helps in the calculating the standard deviation (σ) value. The ‘n’ is length, it is calculated from standard deviation i.e. the value of the standard deviation is greater than 0 that is the value of n. Then threshold value is calculated as,
τ =
Fixed threshold value is calculated by,
= )
Now, Wavelength factor value is to be computed as,
Wavelength (λ) = τ *
IV.RESULT ANALYSIS
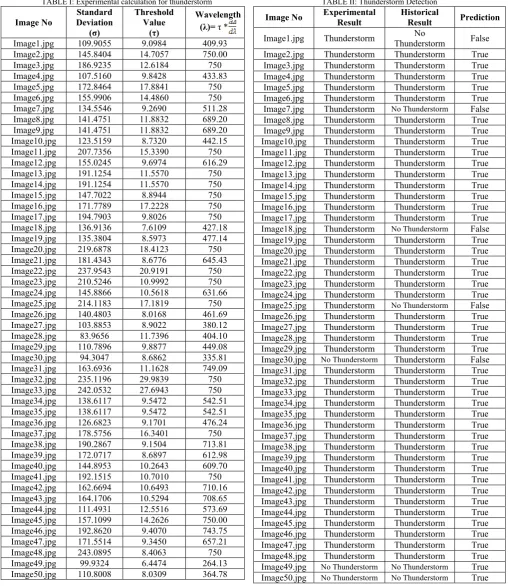
The satellite imagery is publicly viewable and the raw data archive can be requested on the website of US National Oceanic and Atmospheric Administration (NOAA)[16]. It is analysed to identify the presence of thunderstorms within the clouds. On analysis of these satellite images, a threshold value is computed. As satellite image is a visible spectrum, its wavelength value always lies in the range of 380nm-750nm.
) , ( ) , ( ) , ,
(c s O c O s
TABLE I: Experimental calculation for thunderstorm
Image No
Standard Deviation
(σ)
Threshold Value
(τ)
Wavelength (λ)=τ * Image1.jpg 109.9055 9.0984 409.93 Image2.jpg 145.8404 14.7057 750.00 Image3.jpg 186.9235 12.6184 750 Image4.jpg 107.5160 9.8428 433.83 Image5.jpg 172.8464 17.8841 750 Image6.jpg 155.9906 14.4860 750 Image7.jpg 134.5546 9.2690 511.28 Image8.jpg 141.4751 11.8832 689.20 Image9.jpg 141.4751 11.8832 689.20 Image10.jpg 123.5159 8.7320 442.15 Image11.jpg 207.7356 15.3390 750 Image12.jpg 155.0245 9.6974 616.29 Image13.jpg 191.1254 11.5570 750 Image14.jpg 191.1254 11.5570 750 Image15.jpg 147.7022 8.8944 750 Image16.jpg 171.7789 17.2228 750 Image17.jpg 194.7903 9.8026 750 Image18.jpg 136.9136 7.6109 427.18 Image19.jpg 135.3804 8.5973 477.14 Image20.jpg 219.6878 18.4123 750 Image21.jpg 181.4343 8.6776 645.43 Image22.jpg 237.9543 20.9191 750 Image23.jpg 210.5246 10.9992 750 Image24.jpg 145.8866 10.5618 631.66 Image25.jpg 214.1183 17.1819 750 Image26.jpg 140.4803 8.0168 461.69 Image27.jpg 103.8853 8.9022 380.12 Image28.jpg 83.9656 11.7396 404.10 Image29.jpg 110.7896 9.8877 449.08 Image30.jpg 94.3047 8.6862 335.81 Image31.jpg 163.6936 11.1628 749.09 Image32.jpg 235.1196 29.9839 750 Image33.jpg 242.0532 27.6943 750 Image34.jpg 138.6117 9.5472 542.51 Image35.jpg 138.6117 9.5472 542.51 Image36.jpg 126.6823 9.1701 476.24 Image37.jpg 178.5756 16.3401 750 Image38.jpg 190.2867 9.1504 713.81 Image39.jpg 172.0717 8.6897 612.98 Image40.jpg 144.8953 10.2643 609.70 Image41.jpg 192.1515 10.7010 750 Image42.jpg 162.6694 10.6493 710.16 Image43.jpg 164.1706 10.5294 708.65 Image44.jpg 111.4931 12.5516 573.69 Image45.jpg 157.1099 14.2626 750.00 Image46.jpg 192.8620 9.4070 743.75 Image47.jpg 171.5514 9.3450 657.21 Image48.jpg 243.0895 8.4063 750 Image49.jpg 99.9324 6.4474 264.13 Image50.jpg 110.8008 8.0309 364.78
The preliminary results presented in Table I and II shows that the wavelength of the thunderstorm image lies is in the range of 380nm-750nm.
TABLE II: Thunderstorm Detection
Image No Experimental Result Historical Result Prediction
Image1.jpg Thunderstorm Thunderstorm No False Image2.jpg Thunderstorm Thunderstorm True Image3.jpg Thunderstorm Thunderstorm True Image4.jpg Thunderstorm Thunderstorm True Image5.jpg Thunderstorm Thunderstorm True Image6.jpg Thunderstorm Thunderstorm True Image7.jpg Thunderstorm No Thunderstorm False Image8.jpg Thunderstorm Thunderstorm True Image9.jpg Thunderstorm Thunderstorm True Image10.jpg Thunderstorm Thunderstorm True Image11.jpg Thunderstorm Thunderstorm True Image12.jpg Thunderstorm Thunderstorm True Image13.jpg Thunderstorm Thunderstorm True Image14.jpg Thunderstorm Thunderstorm True Image15.jpg Thunderstorm Thunderstorm True Image16.jpg Thunderstorm Thunderstorm True Image17.jpg Thunderstorm Thunderstorm True Image18.jpg Thunderstorm No Thunderstorm False Image19.jpg Thunderstorm Thunderstorm True Image20.jpg Thunderstorm Thunderstorm True Image21.jpg Thunderstorm Thunderstorm True Image22.jpg Thunderstorm Thunderstorm True Image23.jpg Thunderstorm Thunderstorm True Image24.jpg Thunderstorm Thunderstorm True Image25.jpg Thunderstorm No Thunderstorm False Image26.jpg Thunderstorm Thunderstorm True Image27.jpg Thunderstorm Thunderstorm True Image28.jpg Thunderstorm Thunderstorm True Image29.jpg Thunderstorm Thunderstorm True Image30.jpg No Thunderstorm Thunderstorm False Image31.jpg Thunderstorm Thunderstorm True Image32.jpg Thunderstorm Thunderstorm True Image33.jpg Thunderstorm Thunderstorm True Image34.jpg Thunderstorm Thunderstorm True Image35.jpg Thunderstorm Thunderstorm True Image36.jpg Thunderstorm Thunderstorm True Image37.jpg Thunderstorm Thunderstorm True Image38.jpg Thunderstorm Thunderstorm True Image39.jpg Thunderstorm Thunderstorm True Image40.jpg Thunderstorm Thunderstorm True Image41.jpg Thunderstorm Thunderstorm True Image42.jpg Thunderstorm Thunderstorm True Image43.jpg Thunderstorm Thunderstorm True Image44.jpg Thunderstorm Thunderstorm True Image45.jpg Thunderstorm Thunderstorm True Image46.jpg Thunderstorm Thunderstorm True Image47.jpg Thunderstorm Thunderstorm True Image48.jpg Thunderstorm Thunderstorm True Image49.jpg No Thunderstorm No Thunderstorm True Image50.jpg No Thunderstorm No Thunderstorm True
represent thunderstorm and the historical cloud image signifies no thunderstorm, this indicates that the prediction is false. Consider an image 18.jpg; its calculated wavelength is 427.18nm, which lie in the established range for the presence of thunderstorm, even the historical data signifies no thunderstorm; this indicates that the prediction is false.
The main goal of the present research is to detect the thunderstorms as accurate as possible. In order to compute accuracy for the present research TP, TN, FP, FN values are to be computed. The true positive (TP) specifies the positive tuples that were correctly labelled. The true negative (TN) specifies the negative tuples that were correctly labelled. The false positive (FP) specifies the negative tuples that are incorrectly labelled. The false negative (FN) specifies the positive tuples that are incorrectly labelled. The four basic performance measures i.e. sensitivity, specificity, accuracy and precision are computed for the present research in order to test how well the proposed system is working and the computations are done by using equation.
Sensitivity, specificity, Accuracy and Precision as well as prediction are expressed as percentages for ease of interpretation. If the sample sizes in the accuracy and the precision groups do not reflect the real value of the thunderstorm, then the accuracy and precision values cannot be estimated and it should ignore those values. Alternatively, when the prevalence is known then the accuracy and precision values can be calculated using the following formula's based on Bays' theorem:
Sensitivity =
Specificity =
Accuracy =
Precision =
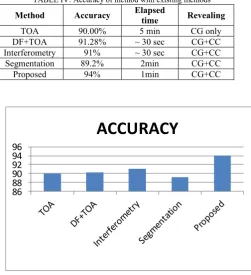
From Table I, II, the performance measures such as sensitivity, specificity, accuracy and precision are calculated using TP, TN, FP and FN and shown in Table III. The proposed method is compared with previous methodologies in the prediction of thunderstorms and is shown in Table IV. The comparison graph is drawn for all the algorithms and is shown in figure 2. The graph clearly shows that the proposed method is outperforming when compared with the previous methodologies
TABLE III: Performance measure for Thunderstorm
Performance Measure Percentage (%)
Sensitivity 95.56 Specificity 80 Accuracy 94 Precision 91.82
TABLE IV: Accuracy of method with existing methods
Method Accuracy Elapsed time Revealing
TOA 90.00% 5 min CG only
DF+TOA 91.28% ~ 30 sec CG+CC Interferometry 91% ~ 30 sec CG+CC
Segmentation 89.2% 2min CG+CC
Proposed 94% 1min CG+CC
86 88 90 92 94 96
ACCURACY
Figure 2: Comparison graph for proposal method
0 2 4 6
Time(Min)
Time(Min)
Figure 3: Elapsed time comparison with existing methods
V. CONCLUSIONS
REFERENCE
[1] Himadri Chakrabarty, Murthy, C. A., Sonia Bhattacharya and Ashis Das Gupta, “Application of Artificial Neural Network to Predict Squall-Thunderstorms Using RAWIND Data,” International Journal of Scientific and Engineering Research, 2013, pp. 1313-1318
[2] Litta, A.J., Sumam Mary Idicula and Naveen Francis C, “Artificial Neural Network Model for the Prediction of Thunderstorms over Kolkata”, International Journal of Computer Applications, 2012, pp. 50-55.
[3] Harvey Stern, “Using A Knowledge based System to predict Thunderstorms,” Bureau of Meteorology, Australia.
[4] Rudolf kaltenbock, Gerhard Diendorfer and Nikolai Dotzek, “Evaluation of Thunderstorm Indices from ECMWF Analyses, Lightning data and Severe Storm reports,” Atmospheric research Journal, Elsevier, 2009, pp. 381-396.
[5] Tajbakhsh, S., Ghafarian, P, and Sahraian, F., “Instability Indicesn and Forecasting Thunderstorms: the case of 30 April 2009,” Natural hazards and Earth System Sciences, 2012, pp. 403-413.
[6] Mahesh Anand, s., Ansupa Dashi, Jagadeesh Kumar, Amit Kesarkar, “Prediction and Classification of Thunderstorms using Artificial Neural Network,” International journal of Engineering Science and Technology, 2011, pp. 4031-4035. [7] D.J. Malan, Physics of Lightning, The English Universities
Press, Ltd., London, (176 pp.), 1963.
[8] E.T. Pierce, Atmospherics and radio noise, in Lightning, vol. 1: Physics of Lightning, R.H. Golde, ed., (pp. 351-384), 1977. [9] M.J. Murphy and K.L. Cummins, 2-D and 3-D cloud discharge
detection, 1998 Intl. Lightning Detection Conf., Tucson, AZ, Global Atmospherics, Inc., 1998.
[10] D.A. Smith, X.M. Shao, D.N. Holden, C.T. Rhodes, M. Brook, P.R. Krehbiel, M. Stanley, W. Rison, and R.J. Thomas, A distinct class of isolated intracloud lightning discharges and their associated radio emissions, J. Geophys. Res., (104), (4189-4212), 1999.
[11] P. Richard and J. Y. Lojou, Lightning and forecast of intense precipitation, in Proc. of Lightning and Mountains 1997, France: Société des Electriciens et des Electroniciens, (pp. 338– 342), 1997.
[12] C. Lennon and L. Maier, Lightning mapping system, in Proc. Int. Aerospace and Ground Conf. on Lightning and Static Electricity, Cocoa Beach, FL,. NASA Conf. Pub. 3106, (II), (pp. 89- 1 – 89-10), 1991.
[13] L. Maier, C. Lennon, T. Britt, and S. Schaefer, Lightning Detection and Ranging (LDAR) system performance analysis, Paper 8.9 in Proc. 6th Conf. on Aviation Weather Systems, Dallas, TX, Amer. Meteorol. Soc., 1995.
[14] http://www.nssl.noaa.gov/education/svrwx101/thunderstorms/t ypes/
[15] http://www.er-emergency.com/technical-bulletin-lightning-damage-assessments-and-consulting-reports