146
Effect of Some Processing Parameters on
Quality of Palm Oil
P
1
P
A. P. Olalusi , P
2
P
I. O. Oni and P
3
P
P. O. Ajewole
P
1
P
Department of Agricultural Engineering, Federal University of Technology, Akure,Ondo State, Nigeria.
P
2, 3
P
Department of Agricultural and Bio-Environmental Engineering, Federal Polytechnic, Ado-Ekiti, Ekiti State.
[email protected], +2348033650296
ABSTRACT
An investigation was carried out on the effect of some processing parameters such as delayed time after harvest, sterilization time and digestion time on quality of palm oil. Some physicochemical properties of the oil such as; free fatty acid taste and odour were determined. The palm fruits were cleaned and divided into five batches A, B, C, D and E, and delayed for 0, 5, 10, 15 and 20 days respectively before being processed. 10 Kg sample of palm fruits were sterilized for; 0, 30, 60 and 90 minutesat temperature range of temperature of 95-110°C. The sterilized palm fruits were then digested for; 3, 6, 9 and 12 min and later pressed with screw press. The free fatty acid content of oils produced is significantly different relative to delayed time after harvest variation at ≤ 0.05 level of significant.This study suggests that, palm fruits processors need to process their fruits early to avoid build up of free fatty acid in the oil. Also, palm fruits that were processed early at higher sterilization time proved to be the best in terms of odour and taste.
KEYWORDS: Palm oil, Processing, Delayed time and Sterilization time
INTRODUCTION
Palm oil is derived from the fleshy mesocarp of the oil palm fruits, Elaeisguineensis. About 80% of palm oil production is destined for human consumption with balance going to animal feed and to various industries. Harvesting, handling and processing methods usedare known to influence the quality of the palm oil extracted. Palm oil serves as the main cooking oil in Nigeria. Palm oil is consumed as margarine, as a base vegetable fat, as industrial frying oil and several special purpose fats (Olowolarafeet al.,2008).
147 processes involves digestion of the fruits and squeezing palm oil out of the digested fruit pulp (Orji and Mbata, 2008). Efforts to mechanize and improve traditional manual procedures have been undertaken by research bodies, development agencies, and private engineering companies, but these activities have been piecemeal and uncoordinated. They have generally concentrated on removing the tedium and drudgery from the mashing or pounding stage (digestion), and improving the efficiency of oil extraction. Palm oil processors of all sizes go through these unit operational stages. They differ in the level of mechanization of each unit operation and the interconnecting materials transfer mechanisms that make the system batch or continuous. The scale of operations differs at the level of process and product quality control that may be achieved by the method of mechanization adopted.
The quality of some imported edible vegetable oils and fat were determined, the final physicochemical properties of the investigated edible oils and fat after sixty days of storage changed significantly depending on storage time and also with the mode of storage (Othman and Ngassapa, 2010). The acceptability of palm oil in the international market is largely dependent on the physiochemical properties of the oil at the time of purchase. Some of the properties or parameters usually considered include free fatty acids (FFA), iodine value (IV) peroxide value (PV), moisture, impurities content, colour, taste, aroma, melting point (Edem, 2002). In Nigeria, palm oil is still being produced principally by farmers who adopt different extraction methods that vary from one locality to another (Orji, 2006).
The crude palm oil produced by the small-scale processors in Nigeria is however of poor quality; (high FFA, high Moisture content and impurities because of the low level of technology used in production(NIFOR, 2010). Within the small-scale processing industry, fruits are processed within a period varying from six to twenty days after fruit harvest. The major limiting factor which affects time to fruit processing is fruit removal from the spikelets or bunches which is mainly done by hand and may vary from 3 days to several days depending on availability of labour and quantity of fruits to be processed. This process is time consuming tedious and labour intensive. Although, short delay or fermentation of bunches improves fruits loosening and reduce time devoted to spikelete processing, they may lead to the production of crude palm oil with high free fatty acid content (Taiwoet al., 2000). Babatundeet al. (1988) reported that processing of fruits without fermentation resulted in the production of high quality crude palm oil of about 2.31% FFA. Poku (2002) reported that, the longer harvested fruits are allowed to stay before they are processed, the higher is the FFA content of the oil extracted from such fruits. The objective of this study was therefore to evaluate the effect of delayed time after harvest on the quality of palm oil produced.
MATERIALS AND METHODS Materials
148 debauched and processed immediately within twenty four hours. Batch B, C, D and E were delayed for five, ten, fifteen and twenty days respectively before being processed. 10 kg sample of freshly harvested fruits were used for the experiment. The unsterilized palm fruits were digested thoroughly in a diesel engine-powered digester (8 Horse power) for 3, 6, 9 and 12 min. The other samples were sterilized at different time of 30, 60 and 90 min at thetemperature range of 95-110°C. The sterilized palm fruits were transferred into a digester and digested for 3, 6, 9 and 12 min. The resulting mash was taken into a vertical screw press and subjected to pressure by turning the handle clock wisely. Whereas the extracted oil was dried, cooled, stored in bottle and properly corked to avoid rancidity. The same procedures were repeated for batches B C, D and E of palm fruits delayed for 5, 10, 15 and 20 days respectively.
The quality of the palm oil produced was determined by analyzing the following; free fatty acid (FFA) content, colour and taste.
Free fatty acid (FFA), content of the palm oil samples were also determined using the AOCS official method of analysis.
SENSORY EVALUATION TEST
The sensory evaluation test for taste and odour of fresh palm oil samples produced were carried out. The Hedonic preference rating test method (Peryam and Plyram, 1957) as adopted by (Orji and Mbata, 2008) was used and ten panelists who are conversant with taste and odour of palm oil were chosen. Each panelist was given a sample of the test oil and asked to comment freely on how much he liked or disliked the sample by rating the samples as very good, good, fair, bad and very bad. The following scores were attached to the rating. Very good = 5 points, good = 4 points, fair = 3 points, bad = 2 points, very bad = 1 point. The scores for the samples were analyzed using analysis of variance (ANOVA) in a Split-Split Design (SSD) and the mean evaluation tests of the samples were carried out.
RESULTS AND DISCUSSION
In this study, none of the palm fruits processed after 5P
th
P
149 produced and this is line with the result obtained by Poku (2002), who reported that, the longer the harvested palm fruits are allowed to stay before they are processed, the higher is the free fatty acid content of the oil.
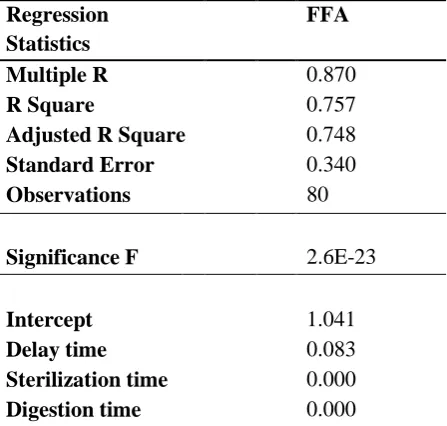
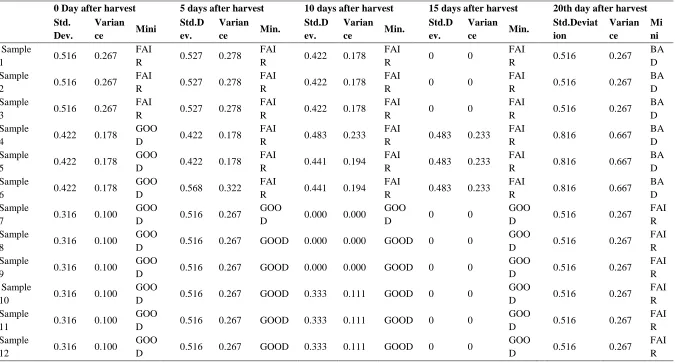
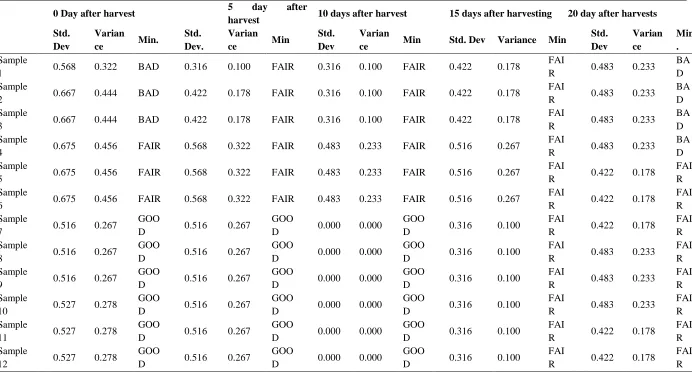
Also, the quality of oil obtained from other treatments in terms of odour and taste increasi ngly deteriorated as shown in tables 1 and 2, while the fruits were left for number of days between 0 and 20 days. It could be observed that, the odour and taste best acceptable was that of the palm fruits delayed between 0 and 5 days after harvest. Oil samples which were charact erized by increased sterilization time proved to be the best in terms of odour and taste characte ristics of the palm oil obtained as indicated in the Tables 3 and 4 respectively.In order to check for the relationship between the delayed times after harvest, the sterilization time and the digestion time in relation to the free fatty acid (FFA) generated, regression model was derived using the Microsoft Excel regression analysis. The regression analysis carried out for the FFA is presented in Table 2,the following relationship were generated from the result. 𝑭𝑭𝑨=𝟏.𝟎𝟒𝟏+𝟎.𝟎𝟖𝟑𝑫𝑻+𝟎𝑻𝒔+𝟎𝑻𝒅……….. (1)
Where DT = Delay Time before processing
TRsR= Sterilization time
TRdR= Digestion time
This leaves the equation as
𝑭𝑭𝑨=𝟏.𝟎𝟒𝟏+𝟎.𝟎𝟖𝟑𝑻𝒅………. (2)
Since the coefficients of the sterilization time and digestion time are zero in the equation The model had a RP
2
P
value of 0.757and standard error of 0.33971. The model indicates that the delayed time after harvest of palm fruit has a direct relationship with the FFA generated as this was accounted for by the positive sign; and that the digestion time and sterilization time have no effect on the FFA level of oil processed
CONCLUSION
The results of the investigation of the effect of processing parameters on the quality of oil produced revealed that, delayed time after harvest has effect on the free fatty acid content of oil produced and that sterilization or digestion time has no effect on free fatty acid of the oil. The study also revealed that, palm fruits processed early at higher sterilization time proved to be the best in terms of odour and taste. The study has suggested that palm fruits processors need to process their fruits early to avoid build up of free fatty acid in the oil. Also, deterioration can set in and when processed, oil might come out with unpleasant taste and odour after a period of time.
REFERENCES
AOAC (2000): Official Methods of Analysis of Official Analytical Chemists15P
th
P
ed, Association of Official Analytical Chemists Washington DC.
Babatunde, O.O, Ajibola, O.O, and Ige, M.T, (1988): A modified process for low cost palm Oil Extraction. J. Food Sci. Technol., 25(2), 67-71.
150 Jimoh, M. O. and Olukunle. O. J. (2011): Microbial Effect on Quality and Efficiency
Depreciation in Palm Oil Production. Journal of Industrial Research and Technology.Vol 3. No 1. 2011
NIFOR. (2010). How to Revive Nigeria Oil Palm Industry. NIFOR News Bulletin, July14, 2010.
Olalusi, A. P., Isa. F. O. and Bolaji. O. T. (2009): Quality Evaluation of Shea Butter from Selected Production Centers in Nigeria. Proceedings of International of WASAE and 9P
th
P
International Conference of NIAE, 25P
th
P
-29P
th
P
January 2009, Ile-Ife, Nigeria.
Orji, M. U. (2006): Microbiological and Chemical Studies on Nigerian palm oil with particar reference to the effect of extraction methods on oil quality. PhD dissertation,
NnamdiAzikiwe University, Awka, Nigeria.
Orji, M. U. and Mbata, T. I. (2008): Effect of Extraction Methods on the Quality and
Spoilage of Nigerian Palm Oil. African Journal of Biochemistry Research Vol.2 (9), pp192-196, September, 2008.
Othman, O. C. and Ngassapa F.N. (2010): Physicochemical Characteristics of Some Imported Edible Vegetable Oils and Fat Marketed in Dar es Salaam. Tanzania Journal of Natural, and Applied Sciences (TaJONAS), December 2010: Volume 1, Issu 2 Owolarafe, O. K., Taiwo, E. A. and Oke. O.O. (2008). Effect of Processing Condition on yield and quality of hydraulically expressed palm oil. Institute of AgroPhysics, 200 8, 22: 349-352.
Poku, K. (2002). Small Scale Palm Oil Processing in Africa. Agriculture and Consumer Protection.FAO Agricultural Services Bulletin.148: 62.
Taiwo, K. A, Owolarafe, O. K, Sanni, L. A, Jeje, J. O, Adeloye, K, Ajibola, O. O (2000). Technological Assessment of Palm Oil Production in Osun and Ondo States of Nigeria. Technol., 20: 215-223.
Zu, K. S. A., AdjeiNsiah. S. and Bani. R. J. (2012): Effect of processing Equipment and duration of storage of palm Fruits on palm oil yield and quality in the Kwaebibrem District, Ghana. Agricultural Research and Reviews Vol. 1(1), pp. 18-25, February 2012.
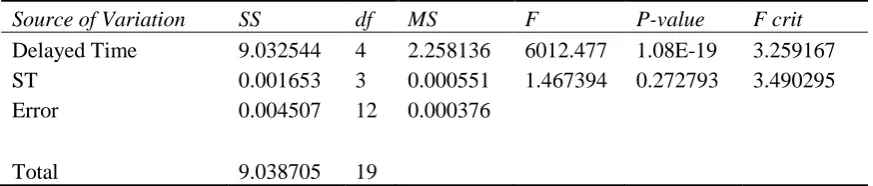
Table 1a: Analysis of variance showing the variation of sterilization and delayed time with free fatty acid of palm fruits digested at 3 minutes.
Source of Variation SS df MS F P-value F crit
Delayed Time 9.032544 4 2.258136 6012.477 1.08E-19 3.259167
ST 0.001653 3 0.000551 1.467394 0.272793 3.490295
Error 0.004507 12 0.000376
151
Table 1b: Analysis of variance showing the variation of sterilization and delayed time with free fatty acid of palm fruits digested at 6 minutes.
Source of Variation SS df MS F P-value F crit
Delayed Time 9.072528 4 2.268132 5723.15 1.45E-19 3.259167
ST 0.002075 3 0.000692 1.744896 0.211066 3.490295
Error 0.004756 12 0.000396
Total 9.079358 19
Table 1c: Analysis of variance showing the variation of sterilization and delayed time with free fatty acid of palm fruits digested at 9 minutes.
Table 1d: Analysis of variance showing the variation of sterilization and delayed time with free fatty acid of palm fruits digested at 12 minutes.
Source of Variation SS df MS F P-value F crit
Delayed Time 8.994985 4 2.248746 229463.9 3.5E-29 3.259167
ST 0.000112 3 3.74E-05 3.814626 0.039455 3.490295
Error 0.000118 12 9.8E-06
Total 8.995215 19
Table 2: Regression Analysis Output Summary for the Effect of Delay time, Sterilization time and Digestion time on Free fatty acid (FFA), Viscosity and Oil yield
Regression Statistics
FFA
Multiple R 0.870
R Square 0.757
Adjusted R Square 0.748
Standard Error 0.340
Observations 80
Significance F 2.6E-23
Intercept 1.041
Delay time 0.083
Sterilization time 0.000
Digestion time 0.000
Source of Variation SS df MS F P-value F crit
Delayed Time 9.043376 4 2.260844 5820.042 1.31E-19 3.259167
ST 0.001716 3 0.000572 1.472273 0.271549 3.490295
Error 0.004661 12 0.000388
152 Table 3: Mean Evaluation of Odour
0 Day after harvest 5 days after harvest 10 days after harvest 15 days after harvest 20th day after harvest Std.
Dev.
Varian
ce Mini
Std.D ev.
Varian ce Min.
Std.D ev.
Varian
ce Min.
Std.D ev.
Varian ce Min.
Std.Deviat ion Varian ce Mi ni Sample
1 0.516 0.267 FAI
R 0.527 0.278 FAI
R 0.422 0.178 FAI
R 0 0
FAI
R 0.516 0.267 BA D Sample
2 0.516 0.267 FAI
R 0.527 0.278 FAI
R 0.422 0.178 FAI
R 0 0
FAI
R 0.516 0.267 BA D Sample
3 0.516 0.267 FAI
R 0.527 0.278 FAI
R 0.422 0.178 FAI
R 0 0
FAI
R 0.516 0.267 BA D Sample
4 0.422 0.178
GOO
D 0.422 0.178 FAI
R 0.483 0.233 FAI
R 0.483 0.233 FAI
R 0.816 0.667 BA D Sample
5 0.422 0.178
GOO
D 0.422 0.178 FAI
R 0.441 0.194 FAI
R 0.483 0.233 FAI
R 0.816 0.667 BA D Sample
6 0.422 0.178
GOO
D 0.568 0.322 FAI
R 0.441 0.194 FAI
R 0.483 0.233 FAI
R 0.816 0.667 BA D Sample
7 0.316 0.100
GOO
D 0.516 0.267
GOO
D 0.000 0.000
GOO
D 0 0
GOO
D 0.516 0.267 FAI R Sample
8 0.316 0.100
GOO
D 0.516 0.267 GOOD 0.000 0.000 GOOD 0 0
GOO
D 0.516 0.267 FAI R Sample
9 0.316 0.100
GOO
D 0.516 0.267 GOOD 0.000 0.000 GOOD 0 0
GOO
D 0.516 0.267 FAI R Sample
10 0.316 0.100
GOO
D 0.516 0.267 GOOD 0.333 0.111 GOOD 0 0
GOO
D 0.516 0.267 FAI R Sample
11 0.316 0.100
GOO
D 0.516 0.267 GOOD 0.333 0.111 GOOD 0 0
GOO
D 0.516 0.267 FAI R Sample
12 0.316 0.100
GOO
D 0.516 0.267 GOOD 0.333 0.111 GOOD 0 0
GOO
153 Table 4: Mean Evaluation of Taste
0 Day after harvest 5 day after
harvest 10 days after harvest 15 days after harvesting 20 day after harvests Std.
Dev
Varian
ce Min.
Std. Dev.
Varian
ce Min
Std. Dev
Varian
ce Min Std. Dev Variance Min
Std. Dev Varian ce Min . Sample
1 0.568 0.322 BAD 0.316 0.100 FAIR 0.316 0.100 FAIR 0.422 0.178
FAI
R 0.483 0.233 BA D Sample
2 0.667 0.444 BAD 0.422 0.178 FAIR 0.316 0.100 FAIR 0.422 0.178
FAI
R 0.483 0.233 BA D Sample
3 0.667 0.444 BAD 0.422 0.178 FAIR 0.316 0.100 FAIR 0.422 0.178
FAI
R 0.483 0.233 BA D Sample
4 0.675 0.456 FAIR 0.568 0.322 FAIR 0.483 0.233 FAIR 0.516 0.267
FAI
R 0.483 0.233 BA D Sample
5 0.675 0.456 FAIR 0.568 0.322 FAIR 0.483 0.233 FAIR 0.516 0.267
FAI
R 0.422 0.178
FAI R Sample
6 0.675 0.456 FAIR 0.568 0.322 FAIR 0.483 0.233 FAIR 0.516 0.267
FAI
R 0.422 0.178
FAI R Sample
7 0.516 0.267
GOO
D 0.516 0.267
GOO
D 0.000 0.000
GOO
D 0.316 0.100
FAI
R 0.422 0.178
FAI R Sample
8 0.516 0.267
GOO
D 0.516 0.267
GOO
D 0.000 0.000
GOO
D 0.316 0.100
FAI
R 0.483 0.233
FAI R Sample
9 0.516 0.267
GOO
D 0.516 0.267
GOO
D 0.000 0.000
GOO
D 0.316 0.100
FAI
R 0.483 0.233
FAI R Sample
10 0.527 0.278
GOO
D 0.516 0.267
GOO
D 0.000 0.000
GOO
D 0.316 0.100
FAI
R 0.483 0.233
FAI R Sample
11 0.527 0.278
GOO
D 0.516 0.267
GOO
D 0.000 0.000
GOO
D 0.316 0.100
FAI
R 0.422 0.178
FAI R Sample
12 0.527 0.278
GOO
D 0.516 0.267
GOO
D 0.000 0.000
GOO
D 0.316 0.100
FAI
R 0.422 0.178
FAI R