Analysis of Quantitative Trait Loci for Behavioral Laterality in Mice
Pierre L. Roubertoux,*
,1,2Isabelle Le Roy,
†,1Sylvie Tordjman,
‡Ame´ziane Cherfou
†and Danie`le Migliore-Samour
†*Centre National de la Recherche Scientifique, Institut de Neurosciences Physiologiques et Cognitives, INPC.CNRS, 13402 Marseille Cedex 20, France,†Centre National de la Recherche Scientifique, Institut de Transge´nose, 45071 Orle´ans Cedex 2, France and‡Centre National
de la Recherche Scientifique and Universite´ Paris VI, Vulne´rabilite´, Adaptation et Psychopathologie, 75013, Paris, France Manuscript received June 21, 2002
Accepted for publication November 20, 2002
ABSTRACT
Laterality is believed to have genetic components, as has been deduced from family studies in humans and responses to artificial selection in mice, but these genetic components are unknown and the underlying physiological mechanisms are still a subject of dispute. We measured direction of laterality (preferential use of left or right paws) and degree of laterality (absolute difference between the use of left and right paws) in C57BL/6ByJ (B) and NZB/BlNJ (N) mice and in their F1and F2intercrosses. Measurements were taken of both forepaws and hind paws. Quantitative trait loci (QTL) did not emerge for direction but did for degree of laterality. One QTL for forepaw (LOD score⫽5.6) and the second QTL for hind paw (LOD score⫽ 7.2) were both located on chromosome 4 and their peaks were within the same confidence interval. A QTL for plasma luteinizing hormone concentration was also found in the confidence interval of these two QTL. These results suggest that the physiological mechanisms underlying degree of laterality react to gonadal steroids.
T
WENTY-SEVEN years ago,Collins(1975) charac- could be presented as hypotheses to explain these incon-sistencies.terized handedness as an “intriguing phenotype” and today both the genetic and the physiological
path-i. All the authors referred to one of the two definitions ways underlying left- or right-handed asymmetries remain
of laterality. Most studies considered “direction” unknown. Four decades of clinical and experimental
(the preferred left or right hand; Francks et al. work have produced an accumulation of contradictory
2002) while others chose “relative hand skill” (devia-results in genetic investigations of handedness. Although
tion from the use of the right hand; Laval et al. family studies indicate that the prevalence of
left-hand-1998), and yet others referred to both direction and edness rises from 7% in Western populations to 21%
“degree” (absolute difference between the use of in the offspring of probands (Annett1996), suggesting
left and right hands;Carlieret al. 1996). that genes may have something to do with this
pheno-ii. Methods for measuring laterality differed from one type, twin studies have not provided encouraging
con-study to another, but poor correlation in different clusions. About 15 twin studies have been published
laterality tests suggested that these tests measured about handedness since 1924. Some showed
left-hand-different abilities (Rigal1992;DoyenandCarlier
edness to be more frequent in twins compared to
single-2002), which correlated to different neuronal sub-tons (Coren 1994). Others failed to reveal any
differ-strates that could involve different genes. ence between the two types of twins (Bishop 2001).
iii. Depending on the acceptance in families of the use Some of these studies, combining twin and family stud- of the left hand, pressure in raising children may ies, concluded that inheritance of handedness followed have produced a differential bias between individu-a rindividu-ather complicindividu-ated model (Orlebeke et al. 1996). als (Carlier1995).
Two genome scans performed for handedness helped
High conservation of brain and motor asymmetries find the quantitative trait loci (QTL;Lavalet al. 1998;
across species (VallortigaraandAndrew1994; Zil-Franckset al., 2002) but the LOD scores were low and
leset al. 1996;LaMendolaandBever1997) including
chromosomal positions inconsistent despite extensive
the mouse (Collins 1985) have been reported and evidence for reproducibility of the method (
Rouber-this species was therefore chosen to elucidate the gene
touxandLe Roy-Duflos2001). Several other reasons
linked to laterality and corresponding physiological mechanisms.
Three hypotheses have attempted to explain individ-1These authors contributed equally to this work.
ual differences in laterality. All three consider that an 2Corresponding author:Institut de Neurosciences Physiologiques et
overdeveloped hemisphere of the brain means
prefer-Cognitives, INPC.CNRS, 31 Chemin Joseph-Aiguier, 13402 Marseille
Cedex 20, France. E-mail: [email protected] ential use of the contralateral limbs (Hecaen 1984),
the preference for the right hand corresponding to an (1993) demonstrated that the differences between the selected lines were not due to differences in genetic overdevelopment of the left hemisphere, while the use
of the left hand corresponds to less pronounced asym- heterogeneity. A low degree of laterality,i.e., an equal preference for the left or right paws, was associated with metry between right and left hemisphere (Galaburda
et al.1978). reduced asymmetry of the brain hemispheres (Collins
1985). Mice selected by Collins for a high degree of The first hypothesis sees brain asymmetry and
conse-quent behavioral laterality as a specific case of visceral laterality showed more brain asymmetries than mice selected for a low degree of laterality (Lippet al.1984; asymmetries, emerging as an output of genes implicated
in the left-right body axis development in the embryo Wardand Collins1985;Cassellset al.1990). Lines of evidence indicate that a high level of gonadal hor-(Ramsdelland Yost1998;Yost1998). Situs inversus,
in mammals, andleftyand pitx2inDanio rerio in zebra mones is associated with a low degree of laterality in a wide range of species (Collins1985;Clarket al.1996; fish induce visceral asymmetries, affecting both the
brain and thenodalgene modulating the right-left posi- Westergaard et al. 2000). An excess of testosterone reduces brain asymmetry in several regions (Wardand tion of the adult pineal organ in zebra fish (Conchaet
al. 2000; Liang et al. 2000). Functional asymmetry of Collins1985; InaseandMachida 1992;Tabibnia et al.1999). Taken together, these lines of evidence are the brain and behavioral laterality may be a pleiotropic
effect of these genes. However, Kennedy et al. (1999) compatible with an association between high concentra-tion of gonadal hormones and a reducconcentra-tion of brain andTanakaet al. (1999) performed neurological
inves-tigations ofsitus invs. totalispatients and concluded that asymmetry producing a low degree of laterality. This study reports the results of a wide genome scan the left-right reversal insitus invs.did not involve
func-tional brain asymmetries. No direct evidence appears for both direction and degree of laterality. Mice were successively subjected to two different tests of laterality to exist implicatingnodal, lefty, andpitx2 in behavioral
laterality. to see whether the putative QTL were task dependent.
We addressed the possibility of genes having an effect on The second hypothesis concerning dopamine
involve-ment in motor behavior suggests the existence of dopa- left-right body axis development and the dopaminergic system. We therefore investigated chromosomal regions minergic asymmetries in the brain (GlickandShapiro
1985). Overfunctioning of the dopaminergic system in encompassingsitus invs.,nodal,lefty, andpitx2as well as genes involved in the dopaminergic system. The go-one hemisphere could induce increased skills of
contra-lateral limbs. Although dopaminergic asymmetries have nadal hormone pathway was also examined. As direction been reported in the brains of rodents (seeCarlson and degree of laterality were reported in this study in and Glick 1992 for review), including asymmetry in both male and female mice, we selected plasma-luteiniz-dopamine uptake controlling the direction of rotation ing hormone concentration (PLHC), which is a com-behavior (Gordonet al.1994), brain asymmetries of the mon trigger for both male and female gonadotropic dopaminergic system (uptake, concentration, receptor hormones.
functioning) could not be related to a preferential use of left or right paws in mice (Neveu1996).
MATERIALS AND METHODS The third hypothesis suggests gonadal steroid
involve-ment in laterality. In their pioneering article,
Gesch-Measuring laterality:Laterality was measured with two
inde-windandGalaburda(1985) suggested that high gonadal pendent tests, one for forepaw and the other for hind paw. steroid levels slowed the growth of the left hemisphere, We recorded the preferential use of right or left forepaw in favoring the development of the right hemisphere and a food-reaching task and the number of right or left hind paw slips during a bar-crossing test. Each mouse was subjected to the consequent use of the contralateral limbs in
hu-the two measures, hu-the interval between hu-the two tests being mans. Recent data indicate less pronounced brain
asym-between 17 and 33 days.
metry in left-handed humans compared to right-handed Laterality for forepaws was assessed according toCollins subjects by brain magnetic resonance imaging (MRI; (1968). Mice were deprived of food atⵑ5:30 p.m. and tested
Geschwindet al.2002). 17⫾2 hr later. Each mouse was placed in a chamber (10.5⫻ 6⫻6 cm), where its usual food was available in a tube located In mice, differences in direction could be the result
on the front wall at half height equally accessible from both of randomly distributed environmental events; two
argu-the right and argu-the left. The mouse could obtain argu-the food by ments support this hypothesis. First, intrastrain
differ-introducing only one of its forepaws into the tube. Each testing ences for direction cannot be attributed to residual ge- session consisted of observing 50 reaches and recording the netic variation (Collins1985, 1991). Second, direction sequence of paws used. Two values were calculated, “direction” and “degree.” The number of right paw entries (RPE) during did not respond to selection in a segregating population
a session indicates the direction of laterality: the higher the (Collins 1991). However, the “degree” of laterality,
score, the more right pawed the mouse. The degree of later-defined as the absolute difference between the
formed into logit (ln|RPE⫺LPE|) (Collins1985) to ensure males were housed alone with an NMRI female. The mice were tested between 110 and 130 days of age.
homoscedasticity in the nonsegregating generations.
Laterality of the hind paw was measured using a bar-crossing On the basis of a preliminary experiment with parental B6 and N strains and their reciprocal F1’s showing no dominance test (LippandWahlsten1992) modified byMaaroufet al.
(1999). A solid bar with a smooth surface was used for shaping. in laterality measurements, an intercross design strategy was chosen for wide genome scanning using 33 B6, 31 N, 23 The mouse was first placed on the middle platform of the
solid bar (50⫻5 ⫻5 cm) and trained to cross in periods NB6F1’s and 25 B6NF1’s. Another 48 F1 pairs were used to produce the 283 F2 mice (68 NB6 ⫻ NB6F2’s, 74 NB6 ⫻ lasting 2 or 3 min. When the mouse succeeded in crossing
the solid bar fearlessly, it was placed on the middle platform B6NF2’s, 71 B6N⫻NB6F2’s, and 70 B6N⫻B6NF2’s). Statistics and QTL analysis:Examination of variances in the of the carved bar for testing. The bar consisted of a small
platform (5⫻5 cm) located in the middle of a carved wooden nonsegregating generations showed heterogeneity, requiring raw data transformation. We selected logit for the forepaw bar bridging a gap between two larger platforms (10⫻ 10
cm). The notched bar (100⫻ 5⫻ 5 cm) was formed by a and log 10 for both hind paw and PLHC, on the basis of a nonsignificant2value with the Bartlett test. The transformed series of regularly spaced notches 2 cm wide and 1.5 cm deep.
The mouse was placed on the middle platform on the bar values from parental strains, reciprocal F1’s, and F2’s were used to compute heritability and to estimate the components of and had to reach one of the two end platforms (one trial).
Two experimenters stood on either side of the bar, counting the mean differences in laterality and PLHC. Heritability in the broad sense was estimated as the number of times the animal slipped with either the
right-(RPS) or the left-hind paw (LPS) during five trials. The bar
h2
L⫽VG/(VG⫹VE), had 11 notches and the mouse could therefore make 11 errors
with each paw per trial, or a total of 55 errors over five trials. where The direction of laterality was calculated as the number of
right slips divided by the total number of slips [RPS/(RPS⫹ VE⫽1⁄4VN⫹1⁄4VB6⫹1⁄2VF1 and VG⫽VF2⫺VE.
LPS)]. The degree of laterality was the absolute difference
between the number of slips with the left- and right-hind paws MatherandJinks’s (1971) procedure was used for compo-nents of mean differences. Parameters were estimated and divided by the total number of slips [|RPS⫺LPS|/(RPS ⫹
LPS)] because the number of slips differed between mice. models fitting observed data were selected using Cavalli’s least-squares fitting procedure. Several models fit observed values We estimated the reliability of both direction and degree
for the two tests. The reliabilities were estimated by split-half and we selected one model using the complementary method developed byKerbuschet al. (1981). For this procedure, the coefficients (rtt), the split-half value being calculated as
best-fitting model has as few parameters as possible; a more rtt⫽2rhh/1⫹rhh, complex model was accepted only if the fit was better than that for the simpler model. The lowest2value indicates the whererhhwas the correlation between the half-tests (Anastasi
best fit. Because of the number of generations, including 1988). We computed therttusing the first 25 and the last 25
reciprocal crosses in F1 and F2, seven parameters could be food reaches with a forepaw for direction and degree and
estimated: [m] mean, [d] additivity, [h] dominance, [i] inter-between the first 50% and the last 50% of slips with the hind
action between homozygous loci, [j] interaction between ho-paw for both direction and degree.
mozygous and heterozygous loci, [l] interaction between het-Plasma luteinizing hormone concentration:Mice were killed
erozygous loci, and [cm] contribution of the mother. at 145 ⫾ 5 days of age by cervical dislocation. PLHC was
Before performing the genome scan, we examined the num-assayed by antibody radioimmunoassay. Blood was centrifuged
ber of segregating units, to establish whether one or more and plasma frozen at⫺20⬚until assayed for PLHC. Because
were associated with measures of laterality and PLHC. We used of homology between mouse and rat LH, the rat luteinizing
Collins’s general nonparametric method for genetic analysis hormone (rLH) [125] assay system is used usually (Saitohet
(Collins1967, 1980) according toTullyandHirsch(1982) al.1991;Tanget al.1993). We used the (rLH) [125] provided
and Michard and Roubertoux (1986) for computations. by Amersham, which was calibrated against the National
Insti-For a variable and for one class of the phenotype continuum, tutes of Health rat LH RP-2 reference preparation. We assayed
it is possible to compute the theoretical values in segregating PLHC in duplicate. Assays were performed again when
intraas-generations (F2, B1, B2 . . . ) from the observed values in say coefficients of variation were ⬎10%. Results were
ex-nonsegregating generations (N, B, and their F1). For a one-pressed in terms of rat LH Rp-2 reference preparation as
segregating-unit model and for classi, the Mendelian expres-nanograms per milliliter of plasma.
sionpi, in F2is Animals: Identified breeders from B6 and N mice were
purchased from the Jackson Laboratory (Bar Harbor, Maine) pi(F
2)⫽pi(B/4)⫹pi(F1/2)⫹pi(N/4) . respectively at generations 190 and 156 of a brother⫻sister
mating breeding protocol. Brother⫻sister mating was contin- For each variable, the phenotype dimension was divided into five equal classes and the values for the phenotype dimension ued in the animal facility for another 4 generations before
starting the experiment. The mice were maintained under were reassigned to these classes. Theoretical and observed values were compared with a2for accuracy of fit.
standard rearing conditions: temperature, 23.5⬚ ⫾0.5⬚;
photo-period, 12/12 hr with lights on at 7:30 a.m.; food and water Genotyping was performed individually with the DNA from the 283 F2’s mice using 67 single sequence length polymor-were availablead libitum; bedding, dust-free sawdust. Any
fe-males obviously close to parturition were isolated. Because phisms (SSLPs) as markers (average interval length, 22.5 cM) on the 20 chromosomes. At this stage, we used the chromo-the first litter from N mochromo-thers often dies, chromo-the first litter was
discarded and the second litter was used for the experiment. somal locations of the SSLPs reported in the consensus map provided by theMouse Genome Database(2002). Significant Litters with only five to seven pups were chosen to reduce
possible postnatal effects due to litter size. Litters of less than differences (P⬍0.05 threshold) between the three genotypes N//N, N//B6, and B6//B6 were assessed. We used the Kruskal-five were discarded and those with more than seven were
culled to seven. There were no adoptions. Weaning took place Wallis test as the transformations providing homoscedasticity in the parental and F1populations did not necessarily produce at 28⫾2 days of age. Females were housed in groups of four
geno-types in the F2’s. In the second stage, when differences between ute to these three phenotypes. This was confirmed by the three genotypes were found with an SSLP, we selected the analysis of the components of the mean differences. other SSLPs on the chromosomal region displaying significant
No model was able to fit for direction of laterality, but differences among the three genotypes. All the F2mice were
one model with additivity ([d] parameter) was the best individually genotyped for these additional SSLPs. The third
stage produced a new SSLP map for the region based on fit for degree of laterality measured with the forepaw distances found in the F2’s. For this purpose, we anchored the (2⫽0.903,P⬍0.52, [d] 0.39⫾0.061) and hind paw most centromeric SSLP and computed the distances across
(2⫽0.527,P⬍0.46, [d] 0.13⫾0.06). The best-fitting the SSLPs. This new SSLP map, which was specific to our
model for PLHC was always additive (2⫽ 0.712,P ⬍ segregating population, was used then for likelihood ratios
0.49, [d] 0.53⫾0.074). With Collins’s general nonpara-and LOD score computations. We estimated these values with
the interval-mapping method (MapQTL-tm-version 3.0; van metric method, the one-segregating-unit model was not Ooijenand Maliepaard1996). The LOD score values and rejected for the two measurements of degree of laterality the chromosomal distances were compared to those obtained
(2⫽0.923,P⬍0.63 for forepaw and2⫽0.5184,P⬍ with composite interval mapping with cofactors (QTL
Cartog-0.91 for hind paw), but was rejected for PLHC (2 ⫽ rapher, model 6;Zeng1994). After mapping QTL linked to
laterality, a possible linkage with PLHC was investigated for the 9.126,P⬍0.010). chromosomes where linkage with laterality had been detected. In F
2, measures of degree of laterality with forepaw Confidence intervals were estimated with the method
pro-and hind paw were correlated (Bravais-Pearson product posed byDarvasiandSoller(1997).
moment correlation; r ⫽ 0.31, P ⬍ 0.0005). Plasma Genotyping: DNA was extracted from tails and stored at
luteinizing hormone levels correlated with degree of ⫺80⬚. Genotyping was performed using SSLP that differed by
at least 15 bases. Preparation of PCR was done with Beckmann laterality for both forepaw (r⫽0.35,P ⬍0.0001) and 2000 and adapted for the robot and for each set of primers hind paw (r⫽0.39,P⬍ 0.0001).
from general protocols. We used 3 pmol of each primer
(Ge-QTL mapping:The first genome scan was performed
netic Research, Alabama); 2.5 units of Taqpolymerase and
on the whole F2 population with 67 SSLPs as markers buffer, adjusted to 1 mmMg2⫹(Promega, Madison, WI); 200
ng of genomic DNA; and 0.2 mmof each dNTP in a total covering all chromosomes. No significant differences volume of 30l. Amplification included initial denaturation between the three possible genotypes appeared for di-(94⬚for 3 min), and then 94⬚at 30 sec per cycle, annealing rection measured with either forepaw or hind paw. The (1 min 15 sec from 42⬚ to 55⬚ according to the primers),
degree of laterality was associated with SSLPs on chro-extension (1 min 15 sec at 72⬚), and final chro-extension (3 min).
mosome 4:D4Mit205a(P⬍0.0005) andD4Mit12(P⬍
Electrophoresis was performed on an agarose gel. Each
migra-tion included DNA from N, B6, and F2and a molecular weight 0.001) for forepaw andD4Mit205a(P ⬍0.00001) and marker to determine the size of the alleles. Allele sizes were D4Mit12 (P ⬍ 0.0002) for hind paw, suggesting an identified blind and independently by the first two authors
involvement of the central part of chromosome 4 in with Transilluminator, the UVP PMW 20 computer system
the two measurements. A total of 8 new SSLPs were (4.5⫻ magnification). Any discordant observation was
fol-lowed by a second amplification. therefore added onto this chromosome. The
chromo-somal positions of the 12 SSLPs were computed again for the F2population as described above and these
posi-RESULTS tions were used for the final mapping with the MapQTL
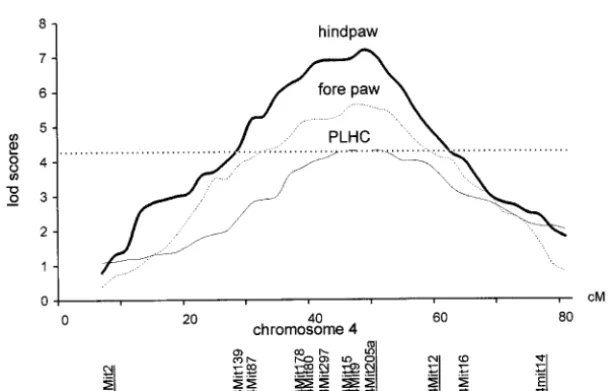
package (van OoijenandMaliepaard1996). Chromo-The respective reliabilities with forepaw and hind paw
some 4 was scanned in the whole F2population with 12 were 0.97 and 0.95 for direction and 0.94 and 0.93 for
SSLPs (Figure 1). One QTL linked to degree of laterality degree. The reliability for preferential food reaching
of the forepaw was mapped at 48 cM and the other with forepaws was similar to those previously published
linked to degree of laterality of the hind paw at 49.7 cM on degree (0.92, Collins 1985; and 0.89,Signore et
(Table 2). The overlapping was compatible with the
al.1991a).
significant correlation between forepaw and hind paw
Components of mean differences: The N and B6
in the segregating F2 generation (Table 1), indicating mice did not differ for direction of laterality assessed
that the QTL found might encompass common genetic either by preferential food reaching with the right
fore-bases. The LOD scores (5.6 for forepaw, 7.2 for hind paw or by the number of slips with the right hind paw
paw) met the criteria for highly significant linkage during the bar-crossing test (data not shown), but did
(LanderandKruglyak1995). differ for the two corresponding indices of degree of
QTL mapping was performed for PLHC on chromo-laterality (Table 1). N strain mice were more
ambidex-some 4 with the 12 SSLPs used for degree of laterality trous (smaller absolute difference between right and
(Figure 1). We found a significant QTL with a LOD left) than B6 for forepaw and hind paw and had a higher
score of 4.4 at 48.8 cM from the centromere (MapQTL-PLHC. Males and females were pooled for subsequent
tm-version 3.0) that became 3.7 with the QTL Cartogra-analyses as males and females did not differ for
measure-pher, the corresponding distance being 44.3 cM. This ments of either laterality or PLHC.
QTL was included in the confidence intervals of each F1 values did not differ from midparent values for
of the two QTL linked to degree of laterality. The lowest the two measures of degree of laterality and for PLHC
TABLE 1
Mean scores for degree of laterality and luteinizing hormone concentration
Generations Forepawa Hind pawb Luteinizing hormonec
B6 (n⫽33) 1.611⫾0.076 0.837⫾0.033 0.685⫾0.025
N (n⫽31) 0.790⫾0.074 0.291⫾0.025 2.167⫾0.009
F1(n⫽48) 1.286⫾0.112 0.567⫾0.023 1.154⫾0.046
F2(n⫽283) 1.308⫾0.057 0.562⫾0.012 1.219⫾0.078
h2d 0.289 0.330 0.451
Means, SEM, and sample size are shown.
alogit|RPE⫺LPE|, which is the absolute difference between the number of right (RPE) and left (LPE) paw
entries (B6vs. N,t⫽5.80,P⬍0.0005).
blog|RPS⫺LPS|/(RPS⫹LPS), where RPS and LPS correspond to the number of right and left paw slips
(B6vs. N,t⫽5.25,P⬍0.0005).
clog plasma luteinizing hormone concentration expressed as nanograms per milliliter of plasma (B6vs. N,
t⫽4.59,P⬍0.001).
dHeritability in the broad sense;tand heritability were computed after raw transformation to fulfill
homosce-dasticity conditions in nonsegregating generations.
and the highest value for PLHC were linked to N geno- that direction and degree are different measurements of laterality. These results observed in the B6 and N types (Table 2).
population indicated a relationship between genetic variability and degree but not between genetic variability DISCUSSION
and direction. This result fits with Collins’s view ( Col-lins 1991), who rejected the hypothesis of a genetic The lack of difference between N and B6 strains for
control of direction from both his own experiments and direction measured with either the forepaw or the hind
phylogenic considerations. paw was not due to large sample errors as the two
mea-For degree, each QTL contributed to part of the total surements had high reliability. In contrast, the
differ-variance, which approximated the respective heritabili-ence between the two strains for degree was significant.
ties estimated in the measurements (30 vs. 28.9% for The difference between their mean indexes was
equiva-forepaw and 26.8 vs. 33% for hind paw). This point lent to the maximum difference between the 12 strains
suggested that only a major QTL contributed to degree tested for this value (Signoreet al. 1991b). Moreover,
of laterality for each measurement in the population the difference is comparable to the difference in lines
derived from B6 and N. This QTL might encompass bred for differences in degree of laterality (Collins
several genes. Collins’s general nonparametric method, 1985); N mice record a score close to mice in the low
which did not lead to rejection of the one-segregating-selected line (ambidextrous), while B6 mice are close
unit model for either of the two measurements of de-to mice in the high selected line (strongly lateralized).
gree, did not support this last possibility in our data. As Highly significant QTL for degree of laterality and the
absence of genetic components for direction indicate a consequence of finding exclusively an additive genetic
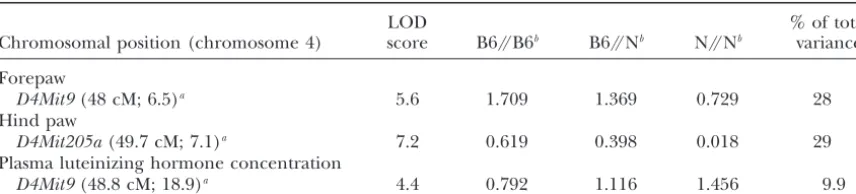
TABLE 2
QTL linked to degree of laterality and plasma luteinizing hormone concentration
LOD % of total
Chromosomal position (chromosome 4) score B6//B6b B6//Nb N//Nb variance
Forepaw
D4Mit9(48 cM; 6.5)a 5.6 1.709 1.369 0.729 28
Hind paw
D4Mit205a(49.7 cM; 7.1)a 7.2 0.619 0.398 0.018 29
Plasma luteinizing hormone concentration
D4Mit9(48.8 cM; 18.9)a 4.4 0.792 1.116 1.456 9.9
QTL were detected with MapQTL-(tm)-version 3.0. Forepaw logit|RPE⫺LPE|, Hind paw log|RPS⫺LPS|/ (RPS⫹LPS), and log plasma luteinizing hormone concentration are shown.
aThe closest SSLPs to the peak of the QTL are shown. The values in parentheses correspond to the distance
from the centromere in centimorgans with the confidence interval.
bMean phenotypic values at the peak of the QTL for the three F
2genotypes.
component, we note that the nonsignificant effect of controls (Nostenet al. 1989). We investigated the popu-lation derived from N and B6 for testing a possible link the “contribution of the mother” component tallies with
previously published data showing that mitochondrial between gonadal hormones and degree of laterality. The plasma testosterone concentration had appeared DNA did not contribute to degree of laterality measured
for forepaw and hind paw (Maaroufet al.1999). The lower in N than in B6 males (Carlier et al. 1990), suggesting that we should measure testosterone in the contribution of genetic factors to the degree of laterality
estimated by heritability, did, however, remain moder- F2’s. As we found no difference between males and fe-males for degree of laterality in this population, we ate, as has been widely reported for behavioral
measure-ments in experimental genetics. looked for a common trigger for both male and female gonadotropic hormones. We selected luteinizing hor-The measurements of degree of laterality recorded
in the two tests were linked to the same chromosomal mone as it stimulates secretion of estrogen and estradiol and production of testosterone. The location of a QTL region. This suggests a linkage between the QTL that
we discovered on the central part of chromosome 4 and for PLHC in the confidence interval of the QTL linked to degree of laterality provided support for gonadal a common physiological mechanism.
The three hypothetical mechanisms presented above steroid implication in degree. However, genes involved in luteinizing hormone are not mapped on chromo-as possibly involved in brain and behavioral laterality
were tested. Our results led us to eliminate the implica- some 4 but on chromosomes 7 and 17 (Lhb, luteinizing hormone, andLhcgr, luteinizing hormone/choriona-tion of genes linked with left-right body axis
develop-ment. Chromosome 4, where we detected the QTL for dotropin receptor, respectively;Mouse Genome Data-base2002). This result indicated that luteinizing hor-degree of laterality, did not includesitus invs.,nodal,lefty,
and pitx2. Moreover, careful anatomical examination mone was probably not the prime mover involved in
degree of laterality, but that the highest PLHC that we conducted according to previously defined protocols
(Yokoyamaet al. 1993) did not revealsitus invs.or simi- found in the ambidextrous mice was the consequence of mechanisms monitored by other genes. The leptin lar phenotypes in N or B6 mice. For the dopaminergic
hypothesis, none of the genes known as being associated receptor gene (Lepr) might be one of the candidates. Its chromosomal location on chromosome 4 at 46.7 cM with dopaminergic functioning were seen on
chromo-some 4 after inspecting the mouse genome map (Mouse (Mouse Genome Database2002) is close to the QTL for degree that we found (between 48 and 49.7 cM).
Genome Database2002).
Much indirect evidence was compatible with the go- Lepris implicated in the gonadal steroid cycle (Chenet al.1996; Cioffi et al.1996; Carro et al. 1997) and in nadal steroid hypothesis. An excess of perinatal
testos-terone favors left-handedness in Mongolian gerbils, luteinizing hormone particularly. Leptin, which modu-lates luteinizing hormone and follicle-stimulating hor-among other species (Clark et al.1996).
Left-handed-ness has a higher prevalence in individuals with high mone, is also considered as a metabolic signal acting on the gonadotropin-releasing hormone system with plasma testosterone concentration (Westergaardet al.
2000). In humans, the QTL mapped by Laval et al. consequences upon reproductive target organs (
Bar-ash et al. 1996; Elmquist et al. 1998). As the male
(1998) for degree was in the vicinity of the androgen
receptor gene on the X chromosome. Mice carrying the reproductive organ weight results from the contribution of testosterone during development (McKinney and
Tfm mutation (impairment of the androgen receptor)
Argyro-relation to degree of laterality in selectively bred mice. Brain Res.
poulosandShire 1989; Hutsonet al. 1994), it must
529:50–56.
be mentioned that the QTL that we found for both Chen, H., O. Charlat, L. A. Tartaglia, E. A. Woolf, X. Wenget degree of laterality and PLHC correspond to the region al., 1996 Evidence that the diabetes gene encodes the leptin receptor: identification of a mutation in the leptin receptor in
of chromosome 4 where we had mapped one of the
db/dbmice. Cell84:491–495.
QTL linked with testes and seminal vesicle weights (47.5 Cioffi, J. A., A. W. Shafer, T. J. Zupancic, J. Smith-Gbur, A. Mikhail and 48 cM, respectively;Le Royet al.2001). et al., 1996 Novel B219/OB receptor isoforms: possible role of leptin in hematopoiesis and reproduction. Nat. Med.2:585–589.
The close linkage between degree of laterality and
Clark, M. M., R. K.Robertsonand B. G.Galef, Jr., 1996 Effects
PLHC with Lepr is currently being examined by fine- of perinatal testosterone on handedness of gerbils: support for mapping strategies using advanced intercrossed lines part of the Geschwind-Galaburda hypothesis. Behav. Neurosci.
110:413–417.
(DarvasiandSoller1995). These results suggest that
Collins, R. L., 1967 A general non-parametric theory of genetic
degree of laterality was associated with physiological analysis. II. Application to the classical cross. Genetics60:169. mechanisms influenced by gonadal hormones and must Collins, R. L., 1968 On the inheritance of handedness. I. Laterality
in inbred mice. J. Hered.59:9–12.
be considered as specifically characterizing the
popula-Collins, R. L., 1975 When left-handed mice live in right-handed
tion derived from the strains selected. Other genome worlds. Science187:181–184.
scans with other genetic pools may reveal different QTL Collins, R. L., 1980 Algorithm to determine the genotype frequen-cies of neoclassical crosses: signature and the generating function.
implicated in other physiological mechanisms. Many
Behav. Genet.10:472.
authors have claimed that laterality is implicated in mo- Collins, R. L., 1985 On the inheritance of the direction and the tor or cognitive performances as well as in addictive degree of asymmetry, pp. 41–71 inCerebral Lateralization in Nonhu-man Species, edited by S. D.Glick. Academic Press, New York.
behavior (Carlson and Glick 1992, among others).
Collins, R. L., 1991 Reimpressed selective breeding for
lateraliza-Given the present results, that measures of laterality tion of handedness in mice. Brain Res.564:194–202.
(degree vs. direction in this study) have different ge- Collins, R. L, E. E. SargentandP. E. Neumann, 1993 Genetic and behavioral tests of the McManus hypothesis relating response
netic bases and are consequently associated with
differ-to selection for lateralization of handedness in mice differ-to degree
ent physiological mechanisms, this implication should be of heterozygosity. Behav. Genet.23:413–421.
revisited. On the basis of the present results, a specific Concha, M. L., R. D. Burdine, C. Russell, A. F. SchierandS. W. Wilson, 2000 A nodal signaling pathway regulates the laterality
pattern of characteristics for each measurement of
later-of neuroanatomical asymmetries in the zebrafish forebrain.
Neu-ality should be investigated. ron28:399–409.
Coren, L. A., 1994 Twinning is associated with an increased risk of We thank Miche`le Carlier and Anne-Lise Doyen for their discussions
left-handedness and inverted writing hand posture. Early Hum. and Robert Brush for his helpful comments on the manuscript. This
Dev.40:23–27. study was supported by the Centre National de la Recherche
Scienti-Darvasi, A., and M.Soller, 1995 Advanced intercross lines, an fique, the Ministry for Research and Technology, and the Fondation experimental population for fine genetic mapping. Genetics141:
pour la Recherche Me´dicale. 1199–1212.
Darvasi, A., and M.Soller, 1997 A simple method to calculate resolving power and confidence interval of QTL map location. Behav. Genet.27:125–132.
Doyen, A. L., andM. Carlier, 2002 Measuring handedness: a
valida-LITERATURE CITED
tion study of Bishop’s reaching card test. Laterality7:115–130. Anastasi, A., 1988 Psychological Testing. Macmillan, New York. Elmquist, J. K., E. Maratos-Flier, C. B. Saper andJ. S. Flier, Annett, M., 1996 In defense of the right shift theory. Percept. Mot. 1998 Unraveling the central nervous system pathways
underly-Skills82:115–137. ing reponses to leptin. Nat. Neurosci.1:445–450.
Argyropoulos, G., andJ. G. M. Shire, 1989 Genotypic effects on Francks, C., S. E. Fisher, I. L. MacPhie, A. J. Richardson, A. J. gonadal size in fetal mice. J. Reprod. Fertil.86:473–478. Marlowet al., 2002 A genome wide linkage screen for relative Barash, I. C. C., D. S. Cheung, H. Weigle, E. B. Ren, D. K. Kabigting hand skill in sibling pairs. Am. J. Hum. Genet.70:800–805.
et al., 1996 Leptin is a metabolic signal to the reproductive Galaburda, A. M., M.LeMay, T. L.Kemperand N.Geschwind, system. Endocrinology137:3144–3147. 1978 Right-left asymmetries in the brain. Science199:852–856. Bishop, D. V. M., 2001 Individual differences in handedness and Geschwind, D. H., B. L. Miller, C. DeCarliand D. Carmelli, specific speech and language impairment: evidence against a 2002 Heritability of lobar brain volumes in twins supports ge-genetic link. Behav. Genet.31:339–351. netic models of cerebral laterality and handedness. Proc. Natl. Carlier, M., 1995 Genetics and direction or degree of laterality: Acad. Sci. USA99:3176–3181.
Geschwind, N., andA. M. Galaburda, 1985 Cerebral lateralization. What can be learned from the mouse model? Curr. Psychol.
Cognit.14:516–519. Arch. Neurol.42:521–552.
Glick, S. D., andR. M. Shapiro, 1985 Functional and neurochemi-Carlier, M., P. L. Roubertoux, M. L. KottlerandH. Degrelle,
1990 Y-chromosome and aggression in strains of laboratory cal mechanisms of cerebral lateralization in rats, pp.158–184 in
Cerebral Lateralization in Nonhuman Species, edited by S. D.Glick. mice. Behav. Genet.20:137–156.
Carlier, M., E. Spitz, M. C. Vacher-Lavenu, P. Ville´ger, B. Martin Academic Press, New York.
Gordon, I., M. RehaviandM. Mintz, 1994 Bilateral imbalance in
et al., 1996 Manual performance and laterality in twins of known
chorion type. Behav. Genet.26:409–417. striatal DA-uptake controls rotation behavior. Brain Res. 646:
207–210. Carlson, J. N., and S. D., Glick, 1992 Cerebral laterality as a
deter-minant of behavioral function and dysfunction, pp. 189–215 in Hecaen, H., 1984 Les Gauchers. PUF, Paris.
Hutson, J. M., M. Backer, B. Terada, B. ZhouandG. Paxton,
Genetically Defined Animal Models of Neurobehavioral Dysfunctions,
edited by P.Driscoll. Birkha¨user, Boston. 1994 Hormonal control of testicular descent and the cause of cryptorchidism. Reprod. Fertil. Dev.6:151–156.
Carro, E., R. Sefiaris, R. V. Considine, F. F. CasanuevaandC.
Dieguez, 1997 Regulation of in vivo growth hormone secretion Inase, I., andT. Machida, 1992 Differential effects of right-sided and left-sided orchidectomy on lateral asymmetry of LHRH cells by leptin. Endocrinology138:2203–2206.
Cassells, B., R. L. CollinsandD. Wahlsten, 1990 Path analysis in the mouse brain. Brain Res.580:338–340.
Jean, 1983 Testicular response to HCG stimulation and sexual Ramsdell, A. F., andH. J. Yost, 1998 Molecular mechanisms of vertebrate left-right development. Trends Genet.14:459–465. maturation in mice. Hormone Res.17:216–221.
Rigal, R. A., 1992 Which handedness: Preference or performance? Kennedy, D. N., K. M. O’Craven, B. S. Ticho, A. M. Goldstein, N.
Percept. Mot. Skills75:851–866. Makriset al., 1999 Structural and functional brain asymmetries
Roubertoux, P. L., andI. Le Roy-Duflos, 2001 Quantitative trait in human situs inversus totalis. Neurology53:1260–1265.
locus mapping: Fishing strategy or replicable results? Behav. Kerbusch, J. M. L., F. J. van der StaayandN. Hendricks, 1981
Genet.31:141–148. A searching procedure for transformation and models in a
classi-Saitoh, Y., A. J. Silverman and M. J. Gibson, 1991 Effects of cal mendelian cross breeding study. Behav. Genet.11:239–254.
N-methyl-D,L-aspartic acid on luteinizing hormone secretion in LaMendola, N. P., andT. G. Bever, 1997 Peripheral and cerebral
normal mice and in hypogonadal mice with fetal preoptic area asymmetries in the rat. Science278:483–486.
implants. Endocrinology128:2432–2440. Lander, E. S.,andL. Kruglyak, 1995 Genetic dissection of complex
Signore, P., M. Nosten-Bertrand, M. Chaoui, P. L. Roubertoux, traits: guidelines for interpreting and reporting linkage results.
C. Marchalandet al., 1991a An assessment of handedness in Nat. Genet.11:241–247.
mice. Physiol. Behav.49:701–704. Laval, S. H, J. C. Dann, R. J. Butler, J. Loftus, J. Rueet al., 1998
Signore, P., M. Chaoui, M. Nosten-Bertrand, F. Perez-DiazandC. Evidence for linkage to psychosis and cerebral asymmetry
(rela-Marchaland, 1991b Handedness in mice: comparison across tive hand skill) on the X chromosome. Am. J. Med. Genet.81:
eleven inbred strains. Behav. Genet.21:421–429.
420–427. Tabibnia, G., B. M.Cookeand S. M.Breedlove, 1999 Sex
differ-Le Roy, I., S. Tordjman, H. Degrelle, D. Migliore-SamourandP. L. ence in laterality in the volume of mouse dentate gyrus granule Roubertoux, 2001 Genetic architecture of testes and seminal cell layer. Brain Res.827:41–45.
vesicles weights in mice. Genetics158:333–340. Tanaka, S., R.Kanzaki, M.Yoshibayashi, T.Kamiyaand M. Sugis-Liang, J. O., A. Etheridge, L. Hantsoo, A. L. Rubinstein, S. J. hita, 1999 Dichotic listening in patients with situs inversus: Nowaket al., 2000 Asymmetric nodal signaling in the zebrafish brain asymmetry and situs asymmettry. Neuropsychology37:869– diencephalon positions the pineal organ. Development 127: 874.
5101–5112. Tang, K., A. Bartke, C. S. Gardiner, T. E. WagnerandJ. S. Yun,
Lipp, H. P., andD. Wahlsten, 1992 Absence of corpus callosum, 1993 Gonadotropin secretion, synthesis, and gene expression pp. 216–252 inGenetically Defined Animal Models of Neurobehavioral in human growth hormone transgenic mice and in Ames dwarf
Dysfunctions, edited by P.Driscoll. Birkha¨user, Boston. mice. Endocrinology132:2518–2524.
Lipp, H. P., R. L. CollinsandW. J. Nauta, 1984 Structural asymmet- Tully, T., andJ. Hirsch, 1982 Behavior-genetic analysis of Phormia ries in brains of mice selected for strong lateralization. Brain Res. regina. II. Detection of a single major-gene effect from behavioral
310:393–396. variation for central excitatory state (CES) using hybrid crosses.
Anim. Behav.30:1193–1202. Maarouf, D. A. F., P. L. Roubertoux andM. Carlier, 1999 Is
Vallortigara, G., andR. J. Andrew, 1994 Differential involvement mitochondrial DNA involved in mouse behavioral laterality?
Be-of right and left hemisphere in individual recognition in the hav. Genet.29:311–318.
domestic chick. Behav. Process.33:41–58. Mather, K., andJ. L. Jinks, 1971 Biometrical Genetics, Ed. 2.
Chap-van Ooijen, J. W., andC. Maliepaard, 1996 MapQTL (tm), Version
man & Hall, London.
3.0. Software for the Calculation of QTL Positions on Genetic Maps. McKinney, T. D., andC. Desjardin, 1973 Postnatal development
CPRO-DLO, Wageningen, The Netherlands. of the testis, fighting behavior, and fertility in house mice. Biol.
Ward, R., andR. L. Collins, 1985 Brain size and shape in strongly Reprod.9:279–294.
and weakly lateralized mice. Brain Res.328:243–249. Michard, C., andP. L. Roubertoux, 1986 Differences in patterns
Westergaard, G. C., T. J. Chavanne, I. D. Lussier, S. J. Suomiand of pup care in Mus musculus domesticus: use of segregating
J. D. Higley, 2000 Hormonal correlates of hand preference in populations to dissociate behavioral units in retrieving. J. Comp.
free-ranging primates. Neuropsychopharmacology23:502–507. Psychol.100:285–290.
Yokoyama, T., N. G. Copeland, N. A. Jenkins, C. A. Montgomery, Mouse Genome Database, 2002 Mouse Genome Informatics. The
Jack-F. Jack-F. Elderet al., 1993 Reversal of left-right asymmetries: a situs son Laboratory, Bar Harbor, ME (http://www.informatics.jax.
inversus mutation. Science260:679–682. org).
Yost, H. J., 1998 Left-right development from embryos to brain. Neveu, P., 1996 Lateralization and stress responses in mice: interin- Dev. Genet.23:159–163.
dividual differences in the association of brain, neuroendocrine Zeng, Z-B., 1994 Precision mapping of quantitative trait loci. Genet-and immune responses. Behav. Genet.26:373–378. ics136:1457–1468.
Nosten, M., P. L.Roubertoux, H.Degrelleand M.Leboyer, 1989 Zilles, K., A. Dabringhaus, S. Geyer, K. Amunts, M. Quet al., 1996 Effect of theTfmmutation on mice handedness. J. Endocrinol. Structural asymmetries in the human forebrain and the forebrain
121:5–7. of non-human primates and rats. Neurosci. Biobehav. Rev.20:
Orlebeke,J. F., D. L.Knol, J. R.Koopmans,D. I.Boomsmaand O. P. 593–605. Bleker, 1996 Left-handedness in twins: Genes or environment?