by Xinyue Lu
A thesis submitted to the Graduate Faculty of North Carolina State University
in partial fulfillment of the requirements for the degree of
Master of Science
Textile Engineering
Raleigh, North Carolina 2014
APPROVED BY:
_______________________________ _____________________________ _ Dr. Martin W. King Dr. Zhen Gu
Committee Chair
DEDICATION
BIOGRAPHY
ACKNOWLEDGMENTS
I would like to express my thanks to all the people who helped with my research. First of all, I sincerely thank Dr. Martin W. King for his constant support, funding, guidance and encouragement not only in my study in NC State, but also in my future career. His dedication and enthusiasm for his work inspire all his students. His love and care for us affects every member in our research group.
I would also like to give my appreciation to my other committee members, Dr. Wendy E. Krause, Dr. Natasha Olby and Dr. Zhen Gu for their encouragement and guidance. Many thanks to Dr. Zhen Gu for his generosity in letting me use his laboratory supplies. In addition, I would like to give special thanks to Dr. Philip Bradford in the College of Textiles for his generosity in providing carbon nanotubes. Many thanks to Ozkan Yildiz, a graduate student of Dr. Bradford for fabricating the special aligned carbon nanotubes in electrospun poly(ethylene oxide) webs.
TABLE OF CONTENTS
LIST OF TABLES ... vii
LIST OF FIGURES ... viii
CHAPTER 1 ... 1
GENERAL INTRODUCTION ... 1
1.1 Background and Motivation ... 1
1.2 Objectives and Hypotheses ... 3
1.3 Significance ... 6
CHAPTER 2 ... 8
REVIEW OF LITERATURE ... 8
2.1 Nervous System ... 8
2.2 Injuries to the Peripheral Nervous System ... 11
2.3 Categories of Peripheral Nerve Regeneration ... 15
2.3.1 Direct Repair ... 16
2.3.2 Autografting ... 17
2.3.3 Neural Scaffolds ... 18
2.3.4 Allografts ... 19
2.4 Biomaterials for Nerve Regeneration ... 19
2.4.1 Polylactic acid (PLA) ... 20
2.4.2 Polyglycolic Acid (PGA) ... 22
2.4.3 Polylactic-co-glycolic Acid (PLGA) ... 23
2.4.4 Poly (Ɛ-caprolactone) (PCL) ... 24
2.4.5 Type I Collagen ... 25
2.5 Carbon Nanotubes (CNTs) for Nerve Regeneration ... 27
2.5.1 Properties of Carbon Nanotubes (CNTs) ... 27
2.5.2 Synthesis of CNTs ... 30
2.5.3 Toxicity of CNTs ... 32
2.5.4 CNTs for Nerve Regeneration... 32
CHAPTER 3 ... 35
MATERIALS AND METHODS ... 35
3.1 Fabrication of Nerve Guides ... 35
3.1.1 Preparation of Electrospun Poly(ethylene oxide) and CNTs ... 36
3.1.2 Braiding Nerve Guides... 37
3.1.3 Post Processing ... 40
3.1.4 Total porosity and pore size ... 42
3.2.1 Tensile Strength and Elongation at Break ... 44
3.2.2 Kink Resistance and Recovery ... 45
3.2.3 Compression Resistance and Elastic Recovery ... 46
3.2.4 Suture Retention Strength ... 48
3.3 Biological Performances of Nerve Guides ... 50
3.3.1 Sample Preparation ... 50
3.3.2 Preparation and Harvesting 3T3 Fibroblast Cells ... 51
3.3.3 Seeding 3T3 Fibroblast Cells on the Nerve Guides ... 52
3.3.4 Cell Proliferation by MTT Assay ... 52
3.3.5 Live/Dead Proliferation and Migration of Cells by Laser Scanning Confocal Microscope ... 54
3.3.6 Cells Attachment by Scanning Electron Microscope ... 55
3.4 Statistical and Analysis ... 57
CHAPTER 4 ... 58
RESULTS AND DISCUSSION ... 58
4.1 Basic Properties of Multiple Layer Nerve Guides ... 58
4.1.1 Structure of Multiple Layer Nerve Guides ... 58
4.1.2 Braiding Parameters for the Braided Nerve Guides ... 60
4.2 Physical Properties ... 62
4.2.1 Porosity and Pore Size ... 62
4.2.2 Tensile Strength and Elongation at Break ... 64
4.2.3 Kink Resistance and Recovery ... 68
4.2.4 Compression Resistance and Recovery ... 70
4.2.5 Suture Retention ... 74
4.3 Biological Performance ... 76
4.3.1 Cell Viability and Proliferation by MTT Assay for Biocompatibility ... 76
4.3.2 Cell Migration and Proliferation of Live/Dead by LSCM ... 78
4.3.3 Cell Attachment of SEM ... 84
CHAPTER 5 ... 87
CONCLUSIONS AND FUTURE WORK ... 87
5.1 Conclusions ... 87
5.2 Future Work ... 89
LIST OF TABLES
Table 2.1 Classification of the six degrees of nerve injuries ... 13
Table 4.1 Braided structure for each nerve guide prototype ... 62
Table 4.2 Total of porosity and average pore size for four nerve guide prototypes ... 63
Table 4.3 Results of tensile strength ... 65
Table 4.4 Results of radial compression and recovery testing ... 71
Table 4.5 Results of suture retention strength ... 75
LIST OF FIGURES
Figure 2.1 Neuron structure ... 9
Figure 2.2 Schwann cells ... 10
Figure 2.3 Structure inside the entire nerve trunk ... 11
Figure 2.4 Formation of bands of Bünger. ... 14
Figure 2.5 Various treatments for nerve repair ... 16
Figure 2.6 Commercial nerve guide conduits ... 20
Figure 2.7 (a-b) Synthesis, chemical structure of PLA ... 21
Figure 2.7 (c) Stereoforms of lactic acid ... 21
Figure 2.7 (d) Stereoforms of lactide by ring-opening polymerization ... 21
Figure 2.8 Chemical structure of PGA ... 23
Figure 2.9 Chemical structure of PLGA... 24
Figure 2.10 Chemical synthesis of PCL ... 25
Figure 2.11 (a-b) Structure of fullerene and graphene ... 27
Figure 2.12 (a) Structures of SWNTs determined by the indices n and m ... 29
Figure 2.12 (b) Structure of MWNTs ... 29
Figure 3.1 Flow chart of fabrication process ... 35
Figure 3.2 Structure of electrospun PEO/CNTs ... 37
Figure 3.3 (a-b) Central core and braiding machine ... 38
Figure 3.4 (a-b) Second central core and second braiding process ... 40
Figure 3.5 (b) Braided structure of final nerve guides ... 41
Figure 3.6 Cross section observed by microscope (4) ... 43
Figure 3.7 (a-b) Tensile testing ... 45
Figure 3.8 Kink resistance testing ... 46
Figure 3.9 Compression resistance test ... 47
Figure 3.10 (a-c) Suture retention testing ... 49
Figure 3.11 Nerve conduits at the length of 10 mm. ... 50
Figure 3.12 (a-c) Equipment for preparation and operation of scanning electron microscope ... 56
Figure 4.1 (a-c) Images showing structure of 200 CNT sample. ... 59
Figure 4.1 (d-e) Cross-sectional images showing structure of 200 CNT sample and PEO sample. ... 60
Figure 4.2 (a) Tensile strength results: maximum load ... 65
Figure 4.2 (b) Percent elongation at break ... 66
Figure 4.3 Comparison of load/elongation curves ... 67
Figure 4.4 Kink resistance test ... 69
Figure 4.5 (a-b) Prototype nerve guide samples before and after kink resistance testing. ... 70
Figure 4.6 (a) Compression resistance test results ... 72
Figure 4.7 Comparison of the levels of compression resistance and compression
recovery ... 73
Figure 4.8 Comparison of suture retention strength ... 75
Figure 4.9 Results of MTT assay on Day 1, Day 3 and Day 7 ... 77
Figure 4.10 (a) Four images for the CONTROL sample on Day 7: ... 79
Figure 4.10 (b) Combined image of the CONTROL sample showing the live and dead cells without the PLA layer after Adobe Photoshop correction. ... 80
Figure 4.11 (a-d) Live and dead cells on the inner PLA layer for the four different nerve guide samples on Day 7. ... 81
Figure 4.12 (a-b) Images represent 3T3 cell viability on the CNTs on Day 7. ... 83
Figure 4.13 (a) Cells attached to the CNT web of the 100 CNT sample ... 84
Figure 4.13 (b) Cells attached to the CNT web of the 100 CNT sample. ... 84
Figure 4.13 (c) Cells attached to the CNT web of the 200 CNT sample ... 85
Figure 4.13 (d) Single cell attachment to the CNT web on the 200 CNT sample. ... 85
Figure 4.13 (e) Single cell attachment to the CNT web of the 200 CNT sample. ... 85
Figure 4.14 (a) 3T3 cells on the inner PLA tube. Scale bar: 100m. ... 86
CHAPTER 1
GENERAL INTRODUCTION
1.1 Background and Motivation
There are three main advantages of artificial nerve guides for peripheral nerve repair. First, it overcomes the lack of available autografts and avoids morbidity at the donor site. Second, the nerve guide can serve as a conduit to enable the axons and Schwann cells to grow in the right direction and so eventually reconnect to their distal partner. Third, it protects the axons and Schwann cells from being diverted from the desired pathway by the inflammatory response of infiltrating macrophages. As such it provides a protective envelope around the nerve during the period of nerve regeneration as it migrates and reconnects with its distal stump. Eleven commercial nerve guide devices, including nerve guide conduits and nerve protective wraps have been approved by the FDA since 1995 (Kehoe, Zhang, & Boyd, 2012). However, some commercial nerve guide conduits are too
rigid, such as the Neurolacdevice, or the rate of degradation is too fast, such as the
Neurotube, resulting in a loss of stable architecture during the regeneration process. These devices have been associated with a chronic inflammatory response and nerve guide compression. Therefore, a flexible and semi-permeable nerve guide with improved compression resistance and an acceptable degradation rate is important for nerve guide design.
the potential to enhance the rate of nerve regeneration. Carbon nanotubes are nanomaterials that have been widely applied in the field of neuroscience research for repairing both central nerves and peripheral nerves in recent years. Carbon nanotubes and their composites have already been shown to increase neuronal adhesion and promote cell differentiation as well as result in a low immunogenic profile (Fabbro A, Sucapane A, & etc, 2013). Therefore, we are proposing to fabricate a flexible nerve guide that has good compression resistance and contains carbon nanotubes to improve the rate and the extent of nerve regeneration. The flexible structure can be achieved by using a braiding technique to create a double layer hollow tube with a higher outer layer density so that the compression resistance can be enhanced (J. Liang, 2013).
1.2 Objectives and Hypotheses
nanotubes in one direction, they need to be co-electrospun into an orientated web with a second material, which in this case, will be poly(ethylene oxide) polymer.
Three specific objectives have been proposed as listed below, followed by a description of the tests that will be needed for their evaluation.
1. To design and fabricate multiple layer nerve guide prototype samples with and without directional carbon nanotubes using braiding technology.
a) To review the literature for the types of fabrication and the types of polymers and carbon nanotubes that have been used to prepare nerve guides.
b) To discuss the general requirements and appropriate resorbable polymers for nerve guide fabrication based on a review of the literature.
c) To select the yarns, design the structure, and set the braiding parameters for this experimental study and define the independent and dependent variables. Four prototype samples were designed and fabricated: i) nerve guide with 100 layers of carbon nanotube/poly(ethylene oxide) composite web, ii) nerve guide with 200 layers of carbon nanotube/poly(ethylene oxide) composite web, iii) nerve guide with no carbon nanotubes and only a poly(ethylene oxide) web and iv) an empty hollow control sample nerve guide with no web added.
a) To perform mechanical tests and the four prototype samples, including a tensile strength test, compression resistance and compression recovery tests, a kink resistance test and a suture retention test.
b) To analyze any differences between the four prototype samples using statistical analysis.
3. To evaluate the biocompatibility of the nerve guide prototype samples with and without carbon nanotubes using 3T3 fibroblast cells.
a) To perform a biological test by culturing 3T3 cells for 7 days on the four prototype samples of nerve guides and evaluate their cell proliferation by MTT assay, their cell viability and extent of migration by a live/dead assay using laser scanning confocal microscopy (LSCM), and their degree of cell attachment by scanning electron microscopy (SEM).
b) To compare the biological performance of the four prototype samples and analyze any differences between them using statistical analysis.
According to the objectives, I hypothesize that:
2. The use of carbon nanotubes will improve the mechanical properties, such as tensile strength and compression resistance, and the higher concentration of carbon nanotubes in the nerve guide sample will yield superior results.
3. The process of introducing and removing the poly(ethylene oxide) webs will not affect the mechanical and biological properties of the nerve guides.
4. The nerve guide samples with carbon nanotubes are biocompatible.
5. The directional alignment of the carbon nanotubes will help the cells migrate along the axial direction of the nerve guides.
1.3 Significance
two-dimensional web could not represent the properties of a tubular structure of a nerve guide and the twisted yarn had inferior mechanical properties compared to the braided polymer tube (Huang, 2012).
CHAPTER 2
REVIEW OF LITERATURE
2.1 Nervous System
The nervous system is composed of the central nervous system (CNS) and the peripheral nervous system (PNS) and is formed from a network of neurons and neuroglia. Specialized types of neurons, called sensory neurons, collect information from the environment by responding to touch, sound, light and other stimuli that effect our sensory organs and send it to the central nervous system, which is the brain and spinal cord. Our brain and spinal cord, which are responsible for regulating our bodily functions, interpret this information and generate responses that are transmitted through motor neurons to cause muscle contraction, affect glandular output and stimulate the neural network (Carbrey, 2014).
to the cell body. There are junctions between each neuron (presynaptic neurons and postsynaptic neurons) to transmit signals, which are called synapses. For a single neuron, the synaptic input is received by the cell body or dendrite, but it is then transmitted from the axon to other neurons.
Figure 2.1 Neuron structure (Copyright: Kennesaw State University)
system, and as a result, research in peripheral nerve regeneration mainly focuses on the proliferation of Schwann cells (Brenner, Lowe, & Fox, 2005).
Figure 2.2 Schwann cells (Copyright: Sciprojex)
Figure 2.3 Structure inside the entire nerve trunk (Copyright: Adapted (Schmid, 2012))
2.2 Injuries to the Peripheral Nervous System
and reconnect to the distal Schwann cells if the correct path can be found. The third type of injury, called neurotmesis, is the most severe lesion. It is often the result of severe contusion, stretching, laceration or local anesthetic toxicity. In this case, the degenerative lesion not only involves axonal injury, but also there is damage to the surrounding connective tissue and epineurium, which has caused separation between the distal and proximal stumps (Zochodne, 2008). Wallerian degeneration has affected the cell body and the Schwann cells. Therefore, spontaneous regeneration is unlikely to occur at all.
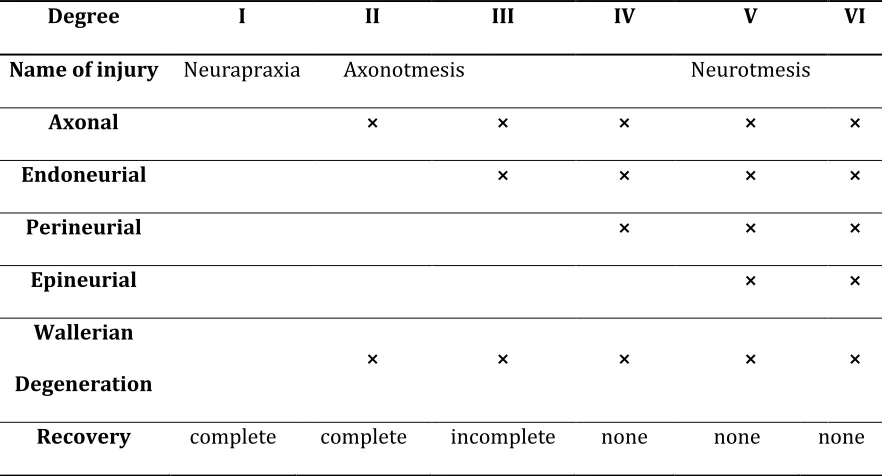
injury to individual fascicles, with local demyelination and axonal degeneration. Table 2.1 below shows the classification of the different levels of injury. Injuries of the first, second and third degree can recover by themselves. But fourth, fifth and sixth degree injuries, surgical treatment is required (Ray & Mackinnon, 2010)
Table 2.1 Classification of the six degrees of nerve injuries
Degree I II III IV V VI
Name of injury Neurapraxia Axonotmesis Neurotmesis
Axonal ⨯ ⨯ ⨯ ⨯ ⨯
Endoneurial ⨯ ⨯ ⨯ ⨯
Perineurial ⨯ ⨯ ⨯
Epineurial ⨯ ⨯
Wallerian
Degeneration ⨯ ⨯ ⨯ ⨯ ⨯
Recovery complete complete incomplete none none none
nerve stumps. In the regions where the axon is still intact, myelinated and unmylinated fibers sprout new axons with a basal lamina that form a regenerating unit (Santin, 2009). Initially there are cytoskeletal materials and transported cytoskeletal proteins which support the first stage of regeneration. Then the Schwann cells direct the regeneration of the axon along the endoneurial channel, which is referred to as the bands of Bünger. The image in Figure 2.4 shows the formation of bands of Bünger. The Schwann cells phagocytize the axonal and myelin debris and secrete chemoattractive factors to attract macrophages into the distal nerve stumps. Together they help phagocytize the axonal and myelin debris during the regeneration process. The axonal debris releases mitogens that stimulate the division of the Schwann cells. In this way the axonal sprouts, the axons and the Schwann cells establish a close relationship to facilitate the regeneration process.
Figure 2.4 Formation of bands of Bünger.
2.3 Categories of Peripheral Nerve Regeneration
Figure 2.5 Various treatments for nerve repair (Copyright: (Ray & Mackinnon, 2010))
2.3.1 Direct Repair
requires a split repair, in which the regenerating nerves are preserved in continuity, while the non-regenerating nerves undergo neurorrhaphy. Fascicular repair is used for specific trauma situations where individual motor and sensory fascicles can be identified and need to be repaired separately (Griffin et al., 2013).
2.3.2 Autografting
When direct repair cannot be performed, nerve grafting is the current gold standard for treatment of peripheral nerve injuries. The time between injury and surgical treatment significantly affects the success of the reconstruction of the peripheral nerve, especially for young patients (Matejĕı̕k, 2002). This is because the robust regenerative capacity of young patients facilitates the process of regeneration. Autografting provides neurotrophic factors and Schwann cells to help the axon to regenerate (Ray & Mackinnon, 2010). The time for regeneration of an axon to reach its denervated target is determined by the chronic denervated Schwann cells within the distal nerve stump particularly, when the time is longer than a month. For example, the regenerative rate of growth of an axon is reported to be 1 mm/day (Gordon, Sulaiman, & Boyd, 2003).
nervous system are possible choices. Noncritical portions of an injured nerve can be good choices for autografts so as to avoid the morbidity of the donor site. However, the question of morbidity at the donor site of the whole nervous the system are still critical concerns for autografts. The sutures that are used for secure the proximal and distal anastomoses may result in unfavorable fibroblastic proliferation, which will inhibit the development of the tiny axons (Merolli, 2009). In addition, the cost is higher for a double operative procedure involving both the donor and injured sites.
2.3.3 Neural Scaffolds
2.3.4 Allografts
The function of allografts is similar to that of autografts but avoiding the problems of short supply and donor site morbidity. Allografts can repair nerve gaps of up to 50 mm. However, successful reconstruction relies on the viability of both host and donor Schwann cells. The donor Schwann cells work both as support cells for remyelination and as facultative antigen presenting cells. Therefore, the main concern for using allografts is the side effect of immunogenicity (Ray & Mackinnon, 2010).
2.4 Biomaterials for Nerve Regeneration
Figure 2.6 Commercial nerve guide conduits (a) “Neurolac” Polyganics NL (b) “NeuraGen” Integra USA)
(Copyright: (Polyganics, 2014a)) (Copyright: (Integra LifeScience Corporation, 2010))
2.4.1 Polylactic acid (PLA)
(a) Synthesis of PLA (b) Chemical structure of PLA Figure 2.7 (a-b) Synthesis, chemical structure of PLA
(Copyright: (Maharana et al., 2009))
Figure 2.7 (c) Stereoforms of lactic acid (Copyright: (Södergård & Stolt, 2002))
Although PLA is a hydrophobic polymer due to its methyl side groups (–CH3), but it can be degraded into water and carbon dioxide through hydrolytic, enzymatic and microbial activity in marine and other environments. The semicrystalline PLLA has the tensile strength at break of 45-70 MPa and an elongation of 85%-105%. For some typical commercial PLLA products, the glass transition temperature is 63.8 °C and the tensile strength is 32.2 MPa with the elongation at break of 30.7% (Briassoulis, 2004). By increasing the molecular weight, the mechanical properties of crystalline PLLA show significant improvement. However, PDLLA is always an amorphous polymer. PDLLA is usually used for drug delivery where a homogeneous dispersion is required, whereas PLLA is often used for an application that requires high mechanical properties, such as sutures. Since the hydrolysis of PLLA yields only L-lactic acid, it is more widely used than PDLLA (Perego, Cella, & Bastioli, 1996). For the peripheral nerve repair, PLA conduits or PLA composite conduits (such as with chitosan) have been shown to be preferable materials for both commercial products and research(J. Liang, 2013; Xie, Li, Gu, Liu, & Shen, 2008).
2.4.2 Polyglycolic Acid (PGA)
when it degrades through hydrolysis of the ester group in the backbone chain, the aqueous byproducts are readily excreted from the body (Chandra & Rustgi, 1998). In addition, during the degradation process, acidic by-products are released. PGA was first used as a synthetic suture. However, it degrades so quickly that the suture loses its mechanical properties in 2 to 4 weeks after implantation. In previous research of nerve regeneration, PGA nerve guides have been shown to repair nerve injuries with up to 30 mm gaps with comparable results to autografting (Mackinnon & Dellon, March 1990).
Figure 2.8 Chemical structure of PGA (Copyright: (Mackinnon & Dellon, March 1990))
2.4.3 Polylactic-co-glycolic Acid (PLGA)
has been approved by the FDA for human use, and nanoparticles of PLGA are widely used for drug delivery therapies (Astete & Sabliov, 2006). Recent research found that PLGA fibers in the ratio of 75:25 promotes migration of axons and 85:15 improves growth of Schwann cells to support the peripheral nerve repair (Quigley, A. F., Bulluss. K. J., etc, 2013).
Figure 2.9 Chemical structure of PLGA (Copyright: (Emanuel, Neuman, & Barak, 2004))
2.4.4 Poly (Ɛ-caprolactone) (PCL)
repair for a 10 mm nerve gap (Reid et al., 2013). PCL is widely used as an electrospun fibrous mat for nerve regeneration. Electrospun PCL/collagen conduits have also been shown to have the potential as an alternative clinical therapy for use in an end-to-side neurorrhaphy technique (Lee et al., 2012). An in vitro study has indicated that electrospun PCL results in superior nerve regeneration and mechanical properties, especially when the structure is oriented or aligned (Ciardelli & Chiono, 2006; Prabhakaran et al., 2008; Yao & O'Brien, 2009). In addition, caprolactone can be co-polymerized with lactic acid to form poly(DL-lactide-Ɛ-caprolactone), (PLC). VIVOSRB® is a bioresorbable polymer sheet for end-to-end nerve repair that claims to prevent neuroma formation (Polyganics, 2014b).
Figure 2.10 Chemical synthesis of PCL (Copyright: (Hedhli, 2011))
2.4.5 Type I Collagen
2.5 Carbon Nanotubes (CNTs) for Nerve Regeneration
2.5.1 Properties of Carbon Nanotubes (CNTs)
Carbon nanotubes (CNTs) were first discovered by Sumio Iijima in 1991 (Mishra, 2012). They are structurally part of the fullerene family and are basically allotropes of carbon composed of graphene sheets, which are one-atom-thick layers of graphite sheets rolled into hollow tubes (Figure 2.11). The length of a CNT can be up to several millimeters long, while the diameter of a nanotube is nearly 1/50,000th of the width of a human hair. The chemical bonding of CNTs is by sp2 bonds, which are similar to those of graphite and stronger than the sp3 bonds found in diamond. The sp2 bonds provide unique strength to CNTs. In addition, CNTs have the superior thermal conductivity and thermal properties.
Figure 2.11 (a-b) Structure of fullerene and graphene (a) Fullerene structure (b) Graphene
Figure 2.12 (a) Structures of SWNTs determined by the indices n and m (Copyright: (Poore, 2007))
Figure 2.12 (b) Structure of MWNTs
(Copyright: (Young & The nanotechnology age, 2014))
strain is engendered by the curvature of the structure, which induces the reactivity (Niyogi et al., 2002). The graphene sheets of CNTs determine their conductivity. The different geometries of CNTs also determine the electrical behavior. Each carbon nanotube is unique and the relationship between their structure and electrical properties is highly correlated. The degree of helicity may determine the metallic or semiconducting behavior of SWNTs, but the metallic or semiconducting nature of MWNTs is also influenced by interlayer interactions (Ebbesen, Lezec, Hiura, & Bennett, 1996). CNTs are flexible, but their high Young’s modulus in the axial direction allows them to withstand pressures of up to 24 GPa. Their strength is determined by the force of the covalent sp2 bonds. The thermal conductivity in the axial direction at room temperature of SWNTs is similar to that of copper and similar to other conductive metals in the transverse direction. CNTs also have excellent thermal stability, and can withstand up to 2800 °C in vacuum and 750 °C in air.
2.5.2 Synthesis of CNTs
to ablate a block of pure graphite. This is especially effective for fabircating SWNTs with high purity. The third method is flame pyrolysis, in which carbon nanotubes are created during the process of combustion. Parameters such as temperature, catalysts particle concentration, setup, and the type of flame and fuel influence the length, purity and diameter of CNTs produced.
2.5.3 Toxicity of CNTs
Thanks to the unique properties of CNTs, such as chemical, electrical and mechanical properties, CNTs have the potential to be used in biomedical applications and some research has been done to fabricate tissue engineering scaffolds with CNTs, such as nerve guides and drug delivery system. The toxicity of CNTs is related to many factors and there is not a standard systematic understanding of CNT toxicity (Liu, 2013). However, the CNT-based three dimensional (3D) matrices, such as 3D scaffolds are believed to reduce the toxicity of CNTs because the matrices resemble the natural extracellular matrix (ECM) (Serrano, 2014). In addition, it has been shown that limited doses of hydrophilic CNTs, such as 100 µg/mL for MWNTs can be excreted through the urinary system without any toxicity (Serrano, 2014).
2.5.4 CNTs for Nerve Regeneration
CHAPTER 3
MATERIALS AND METHODS
3.1 Fabrication of Nerve Guides
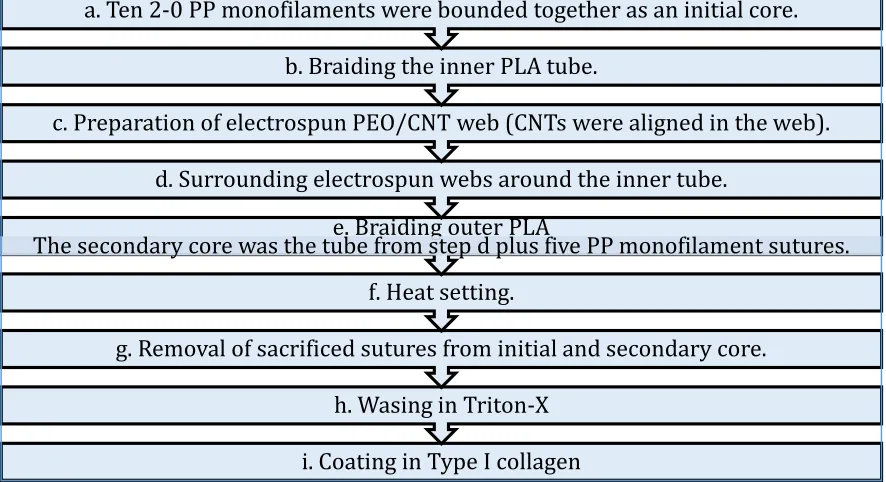
The structure of the prototype nerve guides includes three major components: (i) braided inner PLA tube, (ii) aligned CNTs in a nonwoven structure and (iii) braided outer PLA tube. The steps in the fabrication process to make these prototype samples is shown in Figure 3.1.
Figure 3.1 Flow chart of fabrication process i. Coating in Type I collagen
h. Wasing in Triton-X
g. Removal of sacrificed sutures from initial and secondary core. f. Heat setting.
e. Braiding outer PLA
The secondary core was the tube from step d plus five PP monofilament sutures. d. Surrounding electrospun webs around the inner tube.
c. Preparation of electrospun PEO/CNT web (CNTs were aligned in the web). b. Braiding the inner PLA tube.
3.1.1 Preparation of Electrospun Poly(ethylene oxide) and CNTs
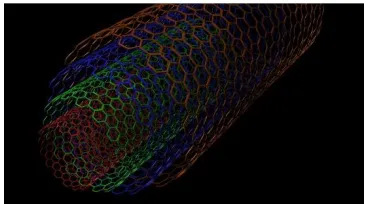
(a) Structure of electrospun PEO/CNTs (b) aligned CNTs (black straight line) on electrospun PEO (white)
Figure 3.2 Structure of electrospun PEO/CNTs
3.1.2 Braiding Nerve Guides
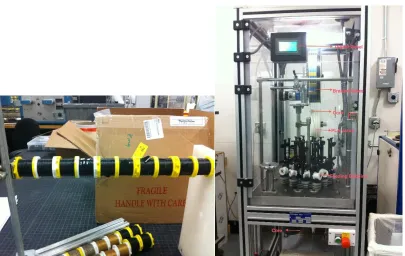
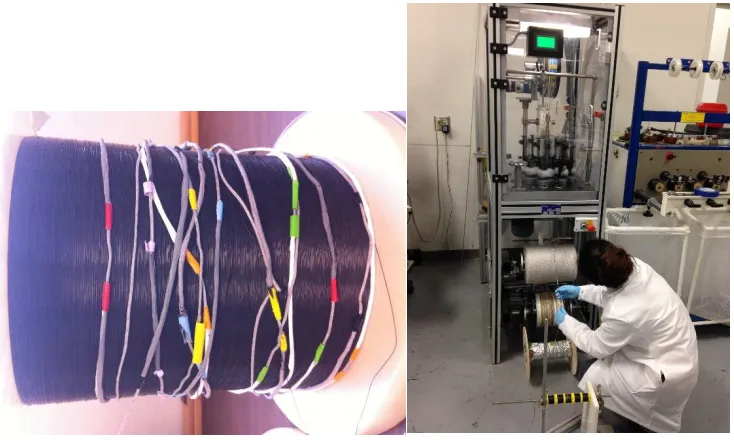
(a) Ten 2-0 PP black monofilament sutures wound on small bobbins ready to provide a central core. (b) 16 spindle Steeger braiding machine
Figure 3.3 (a-b) Central core and braiding machine
After braiding the inner layer of the nerve guides, the PLA tube was thoroughly washed in 0.5% Triton-X at 30 °C to remove any oils and particle contamination that has been added to on the PLA tubes during the in braiding process. The inner PLA tubular layers were then dried at room temperature overnight.
a control group with no electrospun web. Five layers of each of the first three types of web were wrapped around the inner PLA layer. Different colored labels were used to distinguish the samples from each other (Figure 3.3 (a)).
(a) Test specimens of inner PLA layer surrounded by CNTs aligned in the axial direction (b) Five additional 2-0 PP monofilament combined with the inner PLA layer and electrospun webs being fed as a core into the central column of the braiding machine
Figure 3.4 (a-b) Second central core and second braiding process
3.1.3 Post Processing
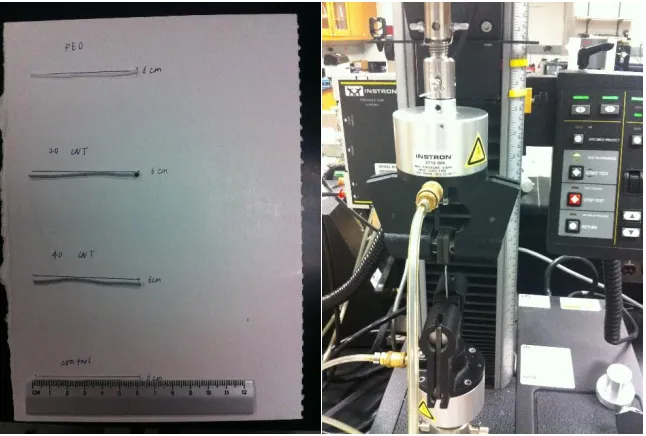
transition temperature of PLA. After pulling out all the PP monofilaments (Figure 3.4(a)), the final multiple nerve guides were washed by 0.5% Triton-X at 30 °C for 4 hours and rinsed with deionized water three times. After they were dried overnight at room temperature, they were coated with 0.01 % Type I collagen (Soluble from calf skin, C806, Elastin) in 0.01 M acetic acid for 6 hours at room temperature and dried overnight. Therefore, the four sample groups were: (i) PLA nerve guide with 20 layers of PEO/CNT, (ii) PLA nerve guide with 40 layers of PEO/CNT, (iii) PLA nerve guide with electrospun PEO web only and (iv) control group of PLA nerve guide with no additional web (Figure 3.4(b)).
Figure 3.5 (a) View of specimens after pulling out black PP monofilament sutures
3.1.4 Total porosity and pore size
According to ASTM F2450-10 (Standard Guide for Assessing the Microstructure of Polymeric Scaffolds for Use in Tissue-Engineered Medical Products), the determination of porosity is the “ratio of void volume to total volume of a porous material and is often expressed as a percentage”. The total porosity of the nerve guide without CNTs could be calculated from the following equation according to ASTM F2450–10 (Standard Guide for Assessing Microstructure of Polymeric Scaffolds for Use in Tissue-Engineered Medical Products):
Total porosity (%)=(1-ds/dPLA)×100,
Where ds is the density of nerve guide and dPLA is the density of the PLA polymer. The density of PLA polymer is assumed to be 1.24 g/cm3 (J. Liang, 2013). The density of each nerve guide was calculated from the mass divided by ten the average of cross-sectional area of a 10 mm long nerve guide:
ds (g/cm3)=m/V,
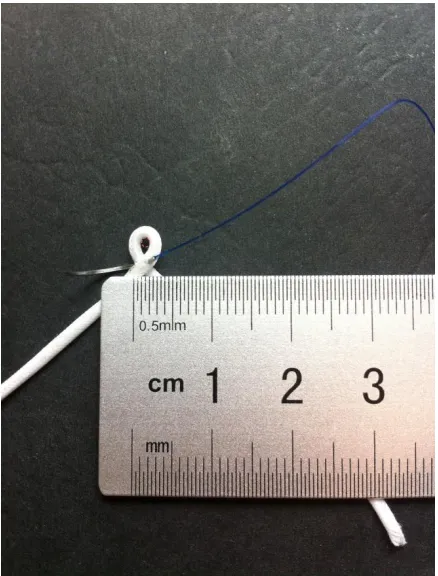
Where m is the mass (g) and V is volume (cm3). The wall thickness of the outer tube was 0.13 mm and the wall thickness of the inner tube was 0.12 mm. The diameter of outer tube of the double layer nerve guide was 1.7 mm and the inner tubular layer was 1.3 mm from analysis by image J (Figure 3.5). So the volume of double layer tube can be calculated from:
Where Ro is the outer radius of the outer tube, ro is the inner radius of the outer tube, Ri is the outer radius of the inner tube and ri is the inner radius of the inner tube. The ds was 0.254 g/cm3 for the control samples.
Figure 3.6 Cross section observed by microscope (4)
3.2 Evaluation of Physical Properties of Nerve Guides
3.2.1 Tensile Strength and Elongation at Break
The standard tensile strength test (ASTM D 5035-11 Standard Test Method for Breaking Force and Elongation of Textile Fabrics) was followed using a crosshead speed of 300 mm/min and an initial gauge length of 30 mm. All nerve guide specimens were cut to a length of 60 mm to be long enough to be clamped in the top and bottom jaws. The maximum load, elongation at maximum load and elongation at break (or load drops by 80%) were recorded. Based on the above values, the Young’s modulus was calculated for each specimen by determining the slope of the stress/strain curve during the first stage of the curve according to the following equation:
E=tensile stress/tensile strain=ơ/Ɛ=𝐹/𝐴
∆𝐿/𝐿,
Where E is Young’s modulus (MPa), F is the absolute force applied on the tube (N), A is the cross-section of area of the tube, ∆L is the extension of tube in the axial direction (mm), and L is the original gauge length.
(a) 60 mm long nerve guide specimens for tensile strength testing (b) Tensile strength testing on the Instron® Model 2712-864 mechanical tester
Figure 3.7 (a-b) Tensile testing
3.2.2 Kink Resistance and Recovery
Figure 3.8 Kink resistance testing
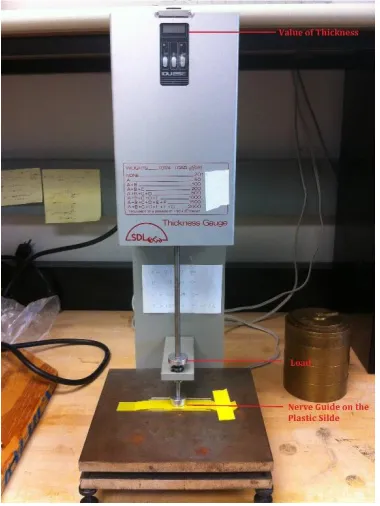
3.2.3 Compression Resistance and Elastic Recovery
half-minute intervals were maintained between each incremental addition of load. At that point, the thickness value of the nerve guide was recorded. During the unloading cycle, the loads were unloaded over the same incremental range from 1000 to 20 g, with half-minute intervals between each thickness measurement. The thickness values at each load were then averaged, and the compression resistance was calculated as the thickness at each load. The elastic recovery was defined as the ratio of the final thickness at 20 g after compression and recovery divided by the thickness of initial 20 g before adding any load.
3.2.4 Suture Retention Strength
(a) Suture retention test on the Instron® testing machine (b) Specimen set up
3.3 Biological Performances of Nerve Guides
3.3.1 Sample Preparation
All samples were cut down to 10 mm long specimens (Figure 3.10) and placed in a 24-well plate. Each nerve guide was put in a single 24-well. Samples were sterilized with ethylene oxide overnight and kept in the hood for 48 hours so as to release remaining ethylene oxide. Then the specimens were immersed in 70 % ethanol for 15 minutes, followed by a 3 times PBS wash.
Figure 3.11 Nerve conduits at the length of 10 mm.
3.3.2 Preparation and Harvesting 3T3 Fibroblast Cells
The 3T3 cell line was obtained from embryonic fibroblast mouse cells (ATCC® CRL-1658, Lot 60731982). The complete culture media was composed of 89% DMEM (Dulbecco’s Modified Eagle’s Medium, 4,500 mg/L glucose) with phenol red, 10% CBS (Calf Bovine Serum, ATCC® 30-2030) and 1% PSS (Penicillin-Streptomycin Solution, Cellgro® 30-002-CI). The cells were unfrozen and prepared a week before culturing on the nerve guide samples. During procedure, aseptic conditions were strictly maintained. All vials, centrifuge tubes, flasks and other supplies were sprayed with 70% ethanol before use. Firstly, a T-75 flask with 15mL of complete culture media was incubated in 37 °C and 5% CO2 for at least 15 minutes. Secondly, the frozen vial was thawed in a water bath at 37 °C for approximately 2 minutes. Then the vial was transferred to the hood and the contents were transferred to a sterile centrifuge tube with 9 mL of complete culture media, followed by centrifugation at 125 × g for 10 minutes. Finally, the supernatant liquid was discarded and the cell suspension was transferred to the prewarmed flask containing 15 mL of complete growth media.
culture media was added and the suspension was transferred into a sterile centrifuge tube. Then 15 mL fresh culture media was added to a new flask to allow the cells in suspension to be counted and their viability determined. This enabled the required number of cells to be transferred to a new flask with 15 mL of culture media. In fact, in order to obtain enough cells, two flasks were subcultured and the media was changed every three days.
3.3.3 Seeding 3T3 Fibroblast Cells on the Nerve Guides
The cells were obtained from the subcultured flasks three days before seeding. After counting the cells, a 20 µL cell suspension with 104 cells was added to the tip of each 10 mm nerve guide in between the inner and outer layers. For these nerve guides that contained a CNT layer, the cells were seeded in the space between the inner layer and the CNT layer. In addition, each plate had cells seeded directly on the surface of the wells to serve as controls. After the cells were seeded, all 24-well plates were incubated at 37 °C and 5% CO2 in an incubator for 20 minutes. Then 0.5 mL of culture media was pipetted into each well, and it was changed every second day.
3.3.4 Cell Proliferation by MTT Assay
3.3.5 Live/Dead Proliferation and Migration of Cells by Laser Scanning Confocal Microscope
3.3.6 Cells Attachment by Scanning Electron Microscope
(a) Critical Point Dryer (b) Sputter Coater
(c) JEOL Scanning Electron Microscope
3.4 Statistical and Analysis
CHAPTER 4
RESULTS AND DISCUSSION
4.1 Basic Properties of Multiple Layer Nerve Guides
4.1.1 Structure of Multiple Layer Nerve Guides
heat setting treatment that melted the PEO layer may have influenced the physical and/or biological properties. This was the rationale for including the PEO sample as a control during the testing. The results will be discussed in this chapter.
(a) CNTs and outer PLA tube (b) Inner PLA tube and CNTs on it Scale bar: 100 µm.
(d) CNT layer in between the inner and outer PLA tube. (e) Only the PLA inner tube and outer tube remain for the PEO sample. Scale bar: 100 µm.
Figure 4.1 (d-e) Cross-sectional images showing structure of 200 CNT sample and PEO sample.
4.1.2 Braiding Parameters for the Braided Nerve Guides
The braiding angle was calculated using the following equation (General Cable, 2014):
= tan−1|2𝜋(𝐷+2𝑑)𝑃
𝐶 | ,
carriers. The above calculation gave a braiding angle of 36° for the inner tube and an angle of 51° for the outer tube. The SEM images were analyzed and compared with these theoretical values. The difference was about 5°, which may be due to the shrinkage of the PLA polymer during the heat setting process. It is known that different braiding angles can increase the compression resistance of nerve guide conduits (J. Liang, 2013).
Table 4.1 Braided structure for each nerve guide prototype
4.2 Physical Properties
4.2.1 Porosity and Pore Size
By applying the equation in Chapter 3: Total porosity (%)=(1-ds/dPLA)×100), the total porosity of the PEO and CONTROL samples was calculated to be 77.2% and 79.5% respectively. The lower porosity for the PEO sample may have been due to the melting of the PEO, which contributed to additional nerve guide shrinkage over and above any shrinkage of the PLA polymer. For the composite nerve guide prototypes composed of
Special layer in between the inner
and outer tubes
Braiding Parameters Thickness of CNT layer
Braiding
picks/inch Braiding angle braiding Before
After braiding and heat
setting
100 CNT 100 layer CNTs
Inner: 36
Outer: 48 Outer: 51° Inner: 36°
0.58mm 0.09mm
200 CNT 200 layer CNTs 1.15mm 0.12mm
PEO None, electrospun PEO washed away --- ---
both PLA and CNTs, the total porosity were calculated by taking into account the percentage of each component:
Total porosity (%)=[1-(ds/dPLA×P1+dc/dCNT×P2)×100,
Where dc is the density of CNTs web in the composite, dCNT is the theoretical density of one carbon nanotube, P1 is the weight percentage of PLA and P2 is the weight percentage of the CNTs. The theoretical density of MWNTs is 2.1 g/cm3 (Cheap Tubes Inc, 2014) and of PLA is 1.24 g/cm3 (Liang, 2013). The pore size of each component in the four nerve guide prototypes was also measured and analyzed by Image J. Table 4.2 lists the results of total porosity and pore size for each sample.
Table 4.2 Total of porosity and average pore size for four nerve guide prototypes
Total porosity Inner tube CNT layer Pore size Outer tube
100 CNT 76.9%
5-25 m
0.5-1 m
20-50 m
200 CNT 74.5%
PEO 77.2% ---
CONTROL 79.5%
CNTs reduced the total porosity of the nerve guide. The porosity of the 200 CNT sample was around 75%, which is an appropriate pore size for nutrient supply and oxygen exchange. However, the difference in total porosity between the 100 CNT and the PEO sample was not significant, possibly due to the small amount of CNTs added. The average pore size for the inner tube was in the range of 5-25 m, which ensured nutrient exchange and prevented the loss of cells migrating through the wall. The average pore
size of the CNT layer was between 0.5-1 m. Given the small size of these pores, it is unlikely that they could provide a channel for nutrient exchange. However, note that the purpose of this study was to fabricate novel multiple layer nerve guides with CNTs and to ascertain whether or not they are cytocompatible. In future studies the CNTs will serve as core and the double layer PLA tubular structure will be braided around this CNT core so that the nutrients and oxygen can be readily transferred through the wall of the tubes.
4.2.2 Tensile Strength and Elongation at Break
break. Figure 4.2 (a) compares the average maximum load between the four samples, whereas Figure 4.2 (b) compares the average percent elongation at break values.
Table 4.3 Results of tensile strength
100 CNT 200 CNT PEO CONTROL
Maximum load
(N) Mean S.D. 68.4 3.83 71.5 6.26 61.5 3.48 69.3 7.00
Elongation at
break (%) Mean S.D. 64.7 3.63 62.2 6.77 70.6 7.16 14.68 66.9
Figure 4.2 (a) Tensile strength results: maximum load 0.0 10.0 20.0 30.0 40.0 50.0 60.0 70.0 80.0 90.0
100 CNT 200 CNT PEO CONTROL
Figure 4.2 (b) Percent elongation at break
In order to determine whether the average tensile strength values between any of the four prototype samples were significantly different from the rest, it was necessary for the ANOVA statistical test to generate a 95% confidence interval where the p-value0.05. For the average maximum load, only the PEO sample gave a value significantly lower than the other three samples (p-value0.05). For percent elongation at break, no significant
differences were found (p>0.05). The difference in tensile strength between the high content CNTs and the low content CNTs was also found to be no significant (p>0.05), which suggests that the amount of CNTs did not significantly influence the tensile strength of the nerve guide prototypes. The low tensile strength of the PEO sample may be due the additional imperfections in the two layer composite structure caused by the
0 10 20 30 40 50 60 70 80 90
100 CNT 200 CNT PEO CONTROL
El ong at ion at br ea k %
Elongation at break
melting of the PEO. Otherwise the presence of the CNTs generally increased the elastic modulus of the nerve guide. The curves in Figure 4.3 represent the typical load/elongation relationships for each sample as well as for the inner and outer PLA tubes, which were tested independently of each other.
Figure 4.3 Comparison of load/elongation curves
In Figure 4.3, the nerve guides that contain CNTs show two peaks before reaching their maximum load. The slope during the initial stage is much steeper than for these samples without CNTs. This indicates that the nerve guides with CNTs have a higher modulus than these samples without CNTs. The first peak is most likely due to slippage of the CNTs
0 10 20 30 40 50 60 70
0 10 20 30 40
Loa
d
(N
)
Elongation (mm)
under tensile loading due to the applied tensile load being larger than the friction force between the CNT web and the inner PLA tubular layer. The second peak was most likely introduced by failure of the CNT layer. It is worth noting that the design of a double layer PLA nerve guide had a higher elastic modulus compared to the single layer either inner or outer prototype layer.
4.2.3 Kink Resistance and Recovery
Figure 4.4 Kink resistance test
Figure 4.5 shows the images of the four prototypes before and after performing the kink resistance test. All four nerve guide samples recovered with an open lumen, which confirms acceptable kink recovery performance for all of the braded nerve guides, especially the ones with CNTs. This desirable kink resistance and kink recovery performance will ensure that the lumen of these nerve conduits does not close and reduce the space for axon of regeneration.
-0.1 0.1 0.3 0.5 0.7 0.9 1.1
100 CNT 200 CNT PEO CONTROL
Ra d iu s of cu rv at u re (mm)
Kink Resistance Test
(a) Original prototypes (b) kinking recovery after kinking
Figure 4.5 (a-b) Prototype nerve guide samples before and after kink resistance testing.
4.2.4 Compression Resistance and Recovery
Table 4.4 Results of radial compression and recovery testing
Thickness (mm)
Force applied (g) 100 CNT 200 CNT PEO CONTROL
20 0.78 0.85 0.78 0.92
50 0.57 0.57 0.47 0.61
100 0.46 0.48 0.36 0.46
200 0.40 0.41 0.32 0.39
500 0.34 0.34 0.26 0.31
1000 0.29 0.30 0.22 0.27
500 0.31 0.32 0.24 0.29
200 0.35 0.36 0.27 0.32
100 0.38 0.39 0.30 0.34
50 0.42 0.43 0.34 0.38
20 0.49 0.51 0.42 0.47
Figure 4.6 (a) Compression resistance test results
Figure 4.6 (b) Compression recovery test results 0 0.1 0.2 0.3 0.4 0.5 0.6 0.7 0.8 0.9 1
0 200 400 600 800 1000
Th
ickn
ess (
mm)
Increasing Compression Force (g)
100 CNT 200 CNT PEO CONTROL 0 0.1 0.2 0.3 0.4 0.5 0.6 0.7 0.8 0.9 1 0 200 400 600 800 1000 Th ickn ess ( mm)
Decreasing Compression Force (g)
Based on the results in Table 4.4 and Figure 4.6, the overall level of compression resistance and compression recovery was been plotted in Figure 4.7. As mentioned in Chapter 3, the compression resistance was calculated from the thickness at the highest load divided by the thickness at the lowest load, and the compression recovery was obtained from the original thickness at 20 gdivided by the final thickness at 20 g load.
Figure 4.7 Comparison of the levels of compression resistance and compression recovery
The level of compression resistance for the two samples with CNTs is significantly higher (p≤0.05) than for the PEO and CONTROL samples. This is most likely due to the additional stiffness contributed by the CNTs. In addition, a similar significant difference was
0 10 20 30 40 50 60 70 80
100 CNT 200 CNT PEO CONTROL
P er cen ta ge (100 % )
Level of compression resistance and compression recovery
Compression Resistance Compression Recovery
observed in the compression recovery for the nerve guides with CNTs and the two samples without CNTS (p≤0.05). This points to the advantages of including CNTs in the nerve guides to improve their compression recovery. However, the p-values between the 100 CNT and the 200 CNT samples are larger than 0.05, which suggests that the amount of CNTs does not affect the compression resistance or the compression recovery. We therefore conclude that the inclusion of CNTs inside the nerve guides helps them maintain their shape and will facilitate axonal regeneration.
4.2.5 Suture Retention
Table 4.5 Results of suture retention strength
100 CNT 200 CNT PEO CONTROL
Suture Retention Strength (N)
Mean 25.2 27.4 24.0 21.9
S.D. 5.45 3.15 6.27 3.68
Figure 4.8 Comparison of suture retention strength 0
10 20 30 40
100 CNT 200 CNT PEO CNT
Sutur e R et en ti on Str en gth (N
) Comparison of suture retention strength
4.3 Biological Performance
4.3.1 Cell Viability and Proliferation by MTT Assay for Biocompatibility
The use of an MTT assay provides a method to measure the extent of cell viability and cell proliferation on the nerve guides. As mentioned in Chapter 3, the MTT assay was undertaken on Day 1, Day 3 and Day 7. The average and standard deviation of the absorbance results at 540 nm for these three days is listed in Table 4.6. Figure 4.9 shows the comparison between four prototypes on each of these three days.
Table 4.6 Absorbance percentage results from MTT assay
100 CNT 200 CNT PEO CONTROL
Day 1 Mean S.D. 10.5 0.7 11.2 0.7 11.1 1.5 10.8 0.7
Day 3 Mean S.D. 18.3 1.7 19.9 2.8 5.1 22 19.9 0.9
Figure 4.9 Results of MTT assay on Day 1, Day 3 and Day 7
For each of the prototype samples that extent of cell proliferation on Day 1 and Day 3 is significantly different (p0.05), which may be due to the fact that the cells had reached their maximum density which would have been either controlled by the limitation of space and/or by insufficient nutrient supply. The level of cell viability on Day 1 and/or Day 3 were the same for all four samples, whereas on Day 7 significant differences were observed in between some of the samples. For example, the MTT assay gave a significantly greater value for the 100 CNT sample compared with the 200 CNT sample (p0.05). This suggests that the higher content of CNTs may reduce the proliferation of
3T3 cells on nerve guides. This result may be introduced by the short distance between 0.00 5.00 10.00 15.00 20.00 25.00 30.00 35.00 40.00
100 CNT 200 CNT PEO CONTROL
inner PLA layer and the CNT web, which could not provide enough space for cell proliferation. It is therefore suggested that, in future studies, the space around the CNT enlarged. The fall in proliferation of the 200 CNT and CONTROL samples on Day 7 may also be due to the overgrowth of cells. Note that there is no significant difference extent of cell proliferation on Day 7 between 100 CNT, PEO and CONTROL samples, which confirm that all four nerve guide samples had equivalent biocompatibility. Therefore, CNTs have the potential to be used in biomedical applications, especially in nerve guides for peripheral nerve regeneration.
4.3.2 Cell Migration and Proliferation of Live/Dead by LSCM
one image showing the live cells, dead cells and the PLA layer superimposed. In order to obtain a clear resulted view of the cellular performance, an images with only live cells and dead cells was generated using Adobe Photoshop (Figure 4.10 (b)). Figure 4.11 shows the superimposed images of the cells and the PLA layer on Day 7 for all four prototypes.
Figure 4.10 (a) Four images for the CONTROL sample on Day 7:
showing (i)only live cells (top left), (ii) only dead cells (top right), (iii) inner PLA layer without cells (lower left) and (iv) combined image showing live cells, dead cells on the
Figure 4.10 (b) Combined image of the CONTROL sample showing the live and dead cells without the PLA layer after Adobe Photoshop correction.
(a) 100 CNT. Scale bar: 200 m. (b) 200 CNT. Scale bar: 200 m.
(c) PEO. Scale bar: 200 m. (d) Control. Scale bar: 200 m.
From the above four images, one can observe that most of the cells appear to be green, which indicates that the cells prefer to grow on the PLA layer. More cells grew on the PEO sample compared to the other prototypes which confirm the MTT assay result for the PEO sample on Day 7.
(a) Four images showing: Live cells (top left). Dead cells (top right). CNTs (bottom left). Combined image (bottom right). (b) An enlarged combined image. Scale bar: 50 m.
Figure 4.12 (a-b) Images represent 3T3 cell viability on the CNTs on Day 7.
4.3.3 Cell Attachment of SEM
While the live/dead cell assay illustrates the viability of the cells, the attachment of cells to the nerve guides needs to be demonstrated by an alternative technique. Eventually Schwann cells will have to attache themselves and grow along the nerve guides so that the axons can regenerate. In this study, SEM three dimensional images were taken to show the attachment of the 3T3 cells on the nerve guides. Figure 4.13 shows the cell attachment of 3T33 cells on both the CNTs and the PLA yarn layer.
Figure 4.13 (a) Cells attached to the CNT web of the 100 CNT sample Figure 4.13 (b) Cells attached to the CNT web of the 100 CNT sample.
Figure 4.13 (c) Cells attached to the CNT web of the 200 CNT sample Figure 4.13 (d) Single cell attachment to the CNT web on the 200 CNT sample.
Scale bar: 10 m.
The above images demonstrate that 3T3 cells can attach to CNT webs. However, the direction of cells growth was not in the direction of the aligned CNTs. This may be explained by the fact that cells could not distinguish their direction. In the future, in order to stimulate the cells to orientate in the direction of aligned CNTs, it may be necessary to apply an electrical potential across the guides during in vitro cell culture. Although the 3T3 fibroblast cells proliferate and attach to the PLA and CNT surfaces in the nerve guides, different cell are likely to behave differently. Schwann cells should be seeded on the prototype nerve guides in the future to identify whether these nerve conduits with CNTs can improve the attachment and migration of Schwann cells. Figure 4.14 shows the attachment of 3T3 cells to the inner PLA tube.
Figure 4.14 (a) 3T3 cells on the inner PLA tube. Scale bar: 100m. Figure 4.14 (b) A single 3T3 cell attached and aligned on the PLA fibers.
CHAPTER 5
CONCLUSIONS AND FUTURE WORK
5.1 Conclusions
A multiple layer nerve guide incorporating carbon nanotubes has been designed and fabricated as described in Chapter 1. The results of the mechanical and biological testing have been presented, discussed and analyzed in Chapter 4. Based on these results, the hypotheses proposed in Chapter 1 can be answered as follows.
1. The braided structure successfully protected the carbon nanotubes, and avoided the possibility of shrinkage during the heat setting treatment. This thermal treatment caused the poly(ethylene oxide) to melt and ensure that the carbon nanotubes to maintain their stability in the liquid culture environment during biological testing. 2. The nerve guides with carbon nanotubes showed improved tensile strength and
different amounts of carbon nanotubes. This suggests that the concentration of carbon nanotubes had little influence on the mechanical properties of the nerve guide. The lower kinking resistance for the nerve guide sample with carbon nanotubes compared to the controls illustrates that the incorporation of carbon nanotubes reduced the flexibility of the nerve guide.
3. The process of introducing and removing poly(ethylene oxide) reduced the tensile strength but improved cell proliferation, which indicates that the performance of the nerve guides with carbon nanotubes was influenced to some degree by the presence of the poly (ethylene oxide). If no poly(ethylene oxide) had been incorporated within the tubular structure, the tensile strength of the nerve guides with carbon nanotubes might have been even higher.
4. The extent of cell proliferation and attachment within the nerve guides with carbon nanotubes showed similar results to the control samples, which confirms that the biocompatibility of the nerve guides was equivalent regardless of whether the carbon nanotubes were or were nor present.
5. The cells did not migrate preferentially in the direction of the carbon nanotubes. This suggests that the aligned carbon nanotubes could not help improve the rate of cell migration in any specific direction without electrical stimulation.
high surface area was found to be biocompatible and provided superior tensile strength and compression resistance. Therefore, carbon nanotubes have the potential to be an attractive biomaterial is the design of nerve guides for peripheral nerve regeneration.
5.2 Future Work
After evaluation and analysis of this study, and based on the literatures, the following five changes are proposed for future work to achieve improvement of nerve guide with carbon nanotubes and reach the ultimate goal of this study.
1. From the point of view of fabrication, it is proposed that the carbon nanotube web can be fabricated as an inner tube or core. The PLA tubes should then be braided around the core with 36 picks/inch followed by a second braided tube with 48 picks/inch PLA tube to improve the nutrient and oxygen exchange through the pores of the tubular layers during biological testing. In addition, the distance between the carbon nanotube web and the internal PLA tube could be increased so that the cells have more space to grow and migrate.
3. With the intention of increasing the rate and extent of cell migration, electrical stimulation should be applied during the period of cell culture so that the cells experience the electrical stimulation and migrate along the direction of the carbon nanotubes. In addition, altering the level of conductivity is a way to improve the rate of cell migration. For example, a nerve guide could be fabricated with a high conductivity section followed by a low conductivity section, which could then be continuous to another high conductivity section along its length. It is possible that such a “conductivity gradient” would works like a growth factor.
4. With the focus on nerve regeneration, the cells used for the biological culture test should be changed to Schwann cells. This may lead to the formation of “bands of Bünger” which would confirm that nerve guides with carbon nanotubes could improve peripheral nerve regeneration.
REFERENCES
Aldinucci, A., Turco, A., & etc. (2013). Carbon nanotube scaffolds instruct human dendritic cells: Modulating immune responses by contacts at the nanoscale. - Nano Lett.2013 Dec 11;13(12):6098-105.
Antonio Merolli, Thomas J. Joyce,eds., Frédéric Schuind., & Merolli, A. (. (2009). Biomaterials in hand surgery. Dordrecht ; New York: Springer.
Arslantunali, D., Budak, G., & Hasirci, V. (2014). Multiwalled CNT-pHEMA composite conduit for peripheral nerve repair. Journal of Biomedical Materials Research Part A, 102(3), 828-841.
Astete, C. E., & Sabliov, C. M. (2006). Synthesis and characterization of PLGA nanoparticles. Journal of Biomaterials Science -- Polymer Edition, 17(3), 247-289.
ASTM International. (2001). ASTM D6571-01 standard test method for determination of compression resistance and recovery properties of highloft nonwoven fabric using static force loading. ASTM International.
Bennet, D., & Kim, S. (2011). Implantable microdevice for peripheral nerve regeneration: Materials and fabrications. Journal of Materials Science, 46(14), 4723-4740.
Brenner, M. J., Lowe, J. B., & Fox, I. K. (2005). Effects of schwann cells and donor antigen on long-nerve allograft regeneration. Microsurgery, 25(1), 61-70.
Briassoulis, D. (2004). An overview on the mechanical behaviour of biodegradable agricultural films. Journal of Polymers and the Environment, 12(2), 65-81. 、
Carbrey, J. (2014). Introductory human physiology. Unpublished manuscript.
Cellot, G., Toma, F., & etc. (2011). Carbon nanotube scaffolds tune synaptic strength in cultured neural circuits: Novel frontiers in nanomaterial-tissue interactions. - J Neurosci.2011 Sep 7;31(36):12945-53.
Chandra, R., & Rustgi, R. (1998). Biodegradable polymers. Progress in Polymer Science, 23(7), 1273-1335.
Cheap Tubes Inc. (2014). Multi walled carbon naotubes-MWNTs. Retrieved Retrieved from http://www.cheaptubes.com/mwnts.htm
Chen, C., Soni, S., Le, C., Biasca, M., Farr, E., Chen, E. -., & Chin, W. (2012). Human stem cell neuronal differentiation on silk-carbon nanotube composite. Nanoscale Research Letters, 7(1), 1-7.
Emanuel, N., Neuman, M., & Barak, S.In Polypid Ltd. (Ed.), Sustained-release drug carrier
Evans, G. R. D. (2001). Peripheral nerve injury: A review and approach to tissue engineered constructs. The Anatomical Record, 263(4), 396-404.
Fabbro A, Sucapane A, & etc. (2013). Adhesion to carbon nanotube conductive scaffolds forces action-potential appearance in immature rat spinal neurons. - PLoS One., 8(8)
Fratzl, P. (2008). In edited by Peter Fratzl., Fratzl P. (Eds.), Collagen : Structure and mechanics. New York: Springer.
Galvan-Garcia, P., Keefer, E. W., & Yang, F. (2007). Robust cell migration and neuronal growth on pristine carbon nanotube sheets and yarns. Journal of Biomaterials Science -- Polymer Edition, 18(10), 1245-1261.
General Cable. (2014). Cable design equations - braid shield. Retrieved Retrieved fromhttp://www.digikey.com/Web%20Export/Supplier%20Content/GenCable_42/PD F/GC_CableDesignEquationsBraidShield.pdf?redirected=1
Gordon, T., Sulaiman, O., & Boyd, J. G. (2003). Experimental strategies to promote functional recovery after peripheral nerve injuries. Journal of the Peripheral Nervous System, 8(4), 236-250.
Griffin, J. W., Hogan, M. V., Chhabra, A. B., & Deal, D. N. (2013). Peripheral nerve repair and reconstruction. The Journal of Bone & Joint Surgery, 95(23), 2144-2151. Retrieved fromhttp://dx.doi.org/10.2106/JBJS.L.00704.
Hedhli, L. (2011). Polymerization of fluoropolymers using polycaprolactone Google Patents. Retrieved from http://www.google.com/patents/EP2274345A2?cl=en.
Huang, Y., & Hsu, S. (2011). Effects of laminin-coated carbon nanotube/chitosan fibers on guided neurite growth. - J Biomed Mater Res A.2011 Oct; 99(1):86-93.
Huang, Y., Wu, H., Tai, N., & Wang, T. (2012). Carbon nanotube rope with electrical stimulation promotes the differentiation and maturity of neural stem cells. Small, 8(18), 2869-2877.
Integra LifeScience Corporation. (2010). NeuraGen nerve guide. Retrieved Retrieved from http://www.ilstraining.com/NTC%20Solutions/brochures.html.
Jin GZ, Kim M. (2011). Effect of carbon nanotube coating of aligned nanofibrous polymer scaffolds on the neurite outgrowth of PC-12 cells. - Cell Biol Int.2011 Jul; 35(7):741-5.
Kehoe, S., Zhang, X. F., & Boyd, D. (2012). FDA approved guidance conduits and wraps for peripheral nerve injury: A review of materials and efficacy. Injury, 43(5), 553-572.
Kim, Y., & Kim, J. Differential stimulation of neurotrophin release by the biocompatible nano-material (carbon nanotube) in primary cultured neurons. - J Biomater Appl.2014 Jan;28(5):790-7
Lee, B., Ju, Y. M., Cho, J., Jackson, J. D., Lee, S. J., Atala, A., & Yoo, J. J. (2012). End-to-side neurorrhaphy using an electrospun PCL/collagen nerve conduit for complex peripheral motor nerve regeneration.Biomaterials, 33(35), 9027-9036.
Lee, W., & Parpura, V.Chapter 6 - carbon nanotubes as substrates/scaffolds for neural cell growth. Progress in brain research (pp. 110-125) Elsevier.
Li, R., Liu, Z., Pan, Y., Chen, L., Zhang, Z., & Lu, L. (2014). Peripheral nerve injuries treatment: A systematic review. Cell Biochemistry and Biophysics, 68(3), 449-454.