Volume 2011, Article ID 946498,18pages doi:10.1155/2011/946498
Research Article
Design of Active Queue Management for Robust Control on
Access Router for Heterogeneous Networks
Rahim Rahmani,
1Christer ˚
Ahlund,
2and Theo Kanter
11Department of Information Technology and Media, Mid Sweden University, Sweden
2Lule˚a University of Technology, Sweden
Correspondence should be addressed to Rahim Rahmani,[email protected]
Received 26 August 2010; Revised 25 December 2010; Accepted 7 March 2011
Academic Editor: Mohamed Hossam Ahmed
Copyright © 2011 Rahim Rahmani et al. This is an open access article distributed under the Creative Commons Attribution License, which permits unrestricted use, distribution, and reproduction in any medium, provided the original work is properly cited.
The Internet architecture is a packet switching technology that allows dynamic sharing of bandwidth among different flows with in an IP network. Packets are stored and forwarded from one node to the next until reaching their destination. Major issues in this integration are congestion control and how to meet different quality of service requirements associated with various services. In other words streaming media quality degrades with increased packet delay and jitter caused by network congestion. To mitigate the impact of network congestion, various techniques have been used to improve multimedia quality and one of those techniques is Active Queue Management (AQM). Access routers require a buffer to hold packets during times of congestion. A large buffer can absorb the bursty arrivals, and this tends to increase the link utilizations but results in higher queuing delays. Traffic burstiness has a considerable negative impact on network performance. AQM is now considered an effective congestion control mechanism for enhancing transport protocol performance over wireless links. In order to have good link utilization, it is necessary for queues to adapt to varying traffic loads. This paper considers a particular scheme which is called Adaptive AQM (AAQM) and studies its performance in the presence of feedback delays and its ability to maintain a small queue length as well as its robustness in the presence of traffic burstiness. The paper also presents a method based on the well-known Markov Modulated Poisson Process (MPP) to capture traffic burstiness and buffer occupancy. To demonstrate the generality of the presented method, an analytic model is described and verified by extensive simulations of different adaptive AQM algorithms. The analysis and simulations show that AAQM outperforms the other AQMs with respect to responsiveness and robustness.
1. Introduction
Proposals to handle differentiated and guaranteed services in the Internet have not provided the expected benefits for both users and operators. Its complexity, with a large number of interconnected networks, is difficult to handle in an efficient way. This is due to the resource heterogeneity in terms of technologies and the inconsistent implementation of quality of services (QoS) in different networks. A Next Generation Network is an advanced, packet-based network that exploits multiple broadband QoS enabling transport technologies to provide communication services. The objective of Next Gen-eration Network is to focus on users and those service-related functions that are independent of underlying transport-related technologies. With the advent of Next Generation Network, services that are currently provided by multiple
specific network-centric architectures are migrated toward a single, converged, user-centric communication network.
Optical demultiplexers
Optical multiplexers Optical switch
Shared electronic buffer
Figure1: Optoelectronic router.
reliability. During the past number of years, there have been a variety of mechanisms developed to deal with congestion both in end hosts and at the network level (router based) [1– 3]. However, in heterogeneous networks the assumption that a packet loss always indicates an appearance of congestion might be flawed. This is simply because (1) a wireless link has a much higher bit-error rate and (2) the Internet connection might be temporarily down due to handover. This may result in an unnecessary invocation of some congestion recovery algorithms and this will have an immediate effect on network performance such as a low link utilization and unsatisfactory transport protocol performance. Consequently, there has been a certain reluctance to deploy end-to-end congestion control mechanisms for networked multimedia applications in transport protocols.
Access routers require a buffer to hold packets during times of congestion. A large buffer can absorb the bursty arrivals of more packets but this tends to increase response times. The approach most utilized in relation to buffering is to set a maximum limit on the amount of data that can be buffered. The buffer accepts arriving packets until the queue is exhausted and then drops all subsequent arriving packets until some space becomes available in the queue.
With recent advances [4–6], it is now possible to perform an all-optical switching method regarding the opening the door to routers with a huge capacity and lower power than that for electronic routers. Recent advances in technology make it possible to use optical First Come First serve (FCFS) packet buffers that can hold a few dozen packet in an integrated optoelectronic chip [6]. Figure 1 shown an optoelectronic router architecture. Larger all-optical buffers remain infeasible, except with unwieldy spools of optical fibers and that can only implement delay lines, not true for FCFS packet buffers. In [7] one of point discussed as requirements for future Internet or post-Internet architec-ture is high-speed network to exploring the feasibility for an operational all-optical network with just a few dozen optical packet buffers in each router.
If big electronic routers required only a few dozen packet buffers, it could reduce their complexity making them easier to build and easier to scale. A typical 10 Gbps router line-card today contains about one million packet buffers, using many
external DRAM chips. The board space occupied by the DRAMs the pins they require and the power they dissipate all limit the capacity of the router [8].
In switch plane behavior of the optoelectronic router, if an output port is available for forwarding, then packets will be forwarded. Otherwise packets will be held in shared buffer until there is an available port. Packets leave the shared buffer only when both the destination port and the shared buffer output port are both available. Increasing the number of inputs to the shared buffer will significantly improve switch plan performance, in this end there is a need for potential buffer management for congestion control such as AQM.
AQM intends to achieve high link utilization without introducing an excessive delay into the E2E path. In order to achieve good link utilization it is necessary for the AQM to adapt to varying traffic loads. AQM has been subject to extensive research in the Internet community over the past few years and a number of methods to control the queue size have been proposed [3,9]. An increase in Round Trip Time (RTT) not only degrades the control performance of an AQM algorithm, but also leads to instability in the network.
The studies on AQM in [3, 9–12] only evaluated the system throughput performance a situation not directly related to the performance metrics studied in this paper. Publications that are more closely related include a different model which use the Markov Modulated Poisson Process (MMPP) to capture the buffer occupancy with a special case of the model studied in this paper. The main result is that minor modifications to closed loop traffic would indeed allow the reduction of buffer sizes to dozens of packets with the expense of slightly reduced link utilization.
From the above discussion it is clear that a large buffer size absorbs a great number of bursty arrivals of packets in the access router and that an MMPP-8 can be used for the exact analysis of the buffer occupancy model with both open loop traffic and closed loop traffic taken into consideration. In addition, the effects of coexistence of such traffics in buffering occupancy are very limited and this provides the main motivation associated with the research in this paper.
high link utilization. We propose a method based on the well-known MMPP to capture traffic burstiness and buffer occupancy. And we have developed a queuing system with an MMPP-8 arrival process for evaluating the performance of an adaptive AQM-based congestion control mechanism using various loss probabilities as the marking/dropping function. The use of this marking/dropping function designed for a small buffer size is intended to avoid traffic burstiness.
The rest of this paper is organized as follows:Section 2 describes related work; Section 3 presents the adaptive algorithms used in the study;Section 4presents the AAQM concept; Section 5 presents an analytical model; Section 6 presents the simulation model; Section 7 presents the per-formance analysis. Section 8 compares AAQM to a hybrid AQM approaches which have been known as BLUE. Finally Section 9presents conclusions and future work.
2. Related Work
The work presented in [11] studies the effects of unrespon-sive flows on AQM. It shows that the queue averaging time is the result of a trade-offbetween AQM responsiveness and the robustness of the uncontrolled flows. The average queue time results in a smooth or stable congestion feedback that introduces jitter in the queuing delay due to variation in the unresponsive flows. Three flow types were considered: short-lived TCP, Markov on-offUDP, and traffic with long-range dependencies (e.g., ftp). The work in this paper instead focuses on video, multimedia, long-lived and short-lived flows and uses a more realistic model for video traffic and VoIP traffic by using RTP and UDP traffics. Also [11] does not study the impact of video traffic flows and unresponsive flows on the AQMs algorithms, while this is the case in this paper where the main focus is on burstry traffics and unresponsiveness UDP flows with coexistence TCP flows, RTP flows and SCTP flows.
The study in [9], surveys two adaptive and proactive AQM algorithms using a classical proportional-integral-derivative feedback control in order to achieve stability and responsiveness. The TCP flows are modeled as long-lived FTP flows. In our work the flows are modeled as the mix of long-live flows and short-live flows to fulfill the design goal of an adaptive AQM which interacts with realistic flow compositions.
In [13] the authors argue in favor of a rate-based AQM for high-speed links. Also in this work a proportional-integral controller for the AQM scheme is used. The design goal was to match the aggregate rate of TCP flows to the available capacity while minimizing the queue size.
The work presented in [10] uses a token-bucket model as a virtual queue (VQ) with a link capacity less than the actual link capacity. If a packet arrives, it is placed in a queue in the VQ if there is space available. Otherwise the packet is dropped. Accordingly the algorithm is able to react at an earlier stage, even before the queue grows, making it very sensitive to the traffic load and round trip time. However, the utility functions are much different from ours due to the AQM control parameters. The AAQM uses control law and link utilization in order to manage congestion. The action
of the control law in AAQM is to mark incoming packets in order to maintain the quotient between arriving and departing packet at as low value as possible.
The study in [14] focused only on the RED and the parameter setting of RED was based on heuristics. Also [14] studied RED against a disturbance in the wireless access network. Only one type of flow was considered: short-lived TCP. The paper studied RTP, UPD, TCP and SCTP in coexistence and their impact on ARED, PI, VQ and AAQM.
The work presented in [15] used a proxy AQM between the access point for WLAN and the wired network. The proxy reduces the overhead of the access point by implementing AQM functionality at the gateway. In this work the authors extend the RED/ARED scheme to a proxy mode by calculat-ing the average queue length and updated values ofpmaxfor ARED. They measured only a number of TCP flows.
In [16] a channel-aware AQM scheme was presented. This new approach provides congestion signals for flow con-trol based not only on the queue length but also on the chan-nel condition and the transmission bit rate. For the perfor-mance evaluation of the new AQM in multirate WLAN, the bit rate of the wireless node is set manually and fixed at dif-ferent levels (in sequence of 2 M, 1 M, 11 M, and 5.5 Mbps). Two TCP flows were considered. The main idea in this work was to design an AQM for flow control in multirate WLAN.
3. Adaptive AQM Algorithms Used in the Study
The AQM algorithms Adaptive Random Early Detection (ARED) [12], Adaptive Virtual Queue (AVQ) [10], Propor-tional-integral (PI) [17] and Adaptive AQM (AAQM) [18] are compared in this study.
Random Early Detection (RED) is widely deployed and there are several variants working in slightly different ways. RED makes a decision by calculating the average queue size and by applying a low-pass filter with an exponential and weighted moving average (using the history of the queue to decide whether or not to mark a packet). The average queue size is compared to the minimum and maximum thresholds. When the average queue length is less than the minimum threshold no packets are dropped. When the average queue length is above the maximum threshold then all arriving packets are dropped. If the average queue length is between the minimum and maximum thresholds, then RED bases its decision regarding whether or not to drop a packet-based on the average queue size. As the average queue size varies from the minimum to the maximum threshold, the packet drop probability increases linearly.
The ARED [12] algorithm attempts to maintain suitable operating parameters in RED by dynamically adjusting maxp
based on observing the queue length dynamics. ARED increase the maxp when the average exceeds the maximum
threshold and decreases the maxpwhen the average falls blew
the minimum threshold.
a virtual queue whose link capacity of a link (C) is less than the actually capacity of a link (C) and whose buffer size is the same as the buffer size of the real queue. At each packet arrival the virtual queue is updated according to a different equationC=α(γC−λ), whereλis the packet arrival rate,γ
is a desired link utilization andαis a damping factor. If the new packet causes an overflow in the virtual queue then the packet is dropped in the virtual queue and the real packet is dropped in the real queue.
PI stabilizes the router queue length around a refer-ence queue (Qref) that can be achieved by means of I-control. While an improvement to the responsiveness can be achieved by means of proportional (P)-control using the instantaneous queue length (Qt). The resulting PI-controller
is though to be capable of eliminating the steady-state error regardless of the load level.
AAQM is an algorithm that aims to maintain the packet arrival rate as close to the packet departure rate as possible. AAQM is presented inSection 4.
4. The AAQM Concept
AAQM is a light weight algorithm aimed at maximizing the flow of packets through the access router, by using an optimization-based mechanism. The idea in such a mecha-nism is to find the optimal value of the queue occupation by considering two metrics for instance the minimization of the queuing delay and the maximization of the throughput. The AAQM algorithm is a feedback control function which adjusts the rate of congestion notification in response to the flow-based congestion measure which estimated the packets arrival rate.
4.1. The Design of AAQM. The key idea behind AAQM is to
perform congestion notification at a rate which maintains the aggregate transmission rates of the sources at or just below the clearing rate. As a matter of fact it is possible for AAQM to notify congestion by either discarding packets or by marking packets using the Explicit Congestion Noti-fication (ECN) [19]. Contrary to the conventional control approaches these focus on constructing a controller by using the model of the rate-based system. The algorithm is able to update the drop/mark probability according to the packet arrival rate. Using this metric is beneficial and permits the maintenance of a low queue occupation. In the following section we present the design of the AAQM controller. Dur-ing the period involved in the design of this controller three events were adopted which occur during the execution of the AAQM algorithm. A key issue in the design of the AAQM is the choice of the speed of adaptation of the queue occupa-tion. The speed of adaptation is determined by three events.
4.2. Packet Arrival Event. AAQM utilizes the packet arrival
event when a packet arriving at one of access router incoming interfaces is supposed to be transmitted to the outgoing interface, as shown inFigure 2.QandQmaxare the current queue length and maximum queue length, respectively.Qis updated every time a packet is added to the queue or removed
End
A=A+ 1 No
Pr≤P(n) Yes Mark packet Generate random number
Pr∈[0, 1] Enque packet
Yes
Q(n)< Qmax No Drop packet Packet arrival at queue
Figure2: Packet arrival event.
from the queue. Depending on the size ofQ, the packet will be enqueued or discarded. If the packet is enqueued then the outcome of a random variable RND in conjunction with the packet marking probabilityPdetermines whether or not the packet is marked (detecting an onset of congestion). The packet marking either means that the congestion experienced bit, which is part of ECN [19], is set in the packet header or that the packet is discarded. ThenA, which is the number of packets arriving in the queue during the course of the last time interval, is increased by one.
4.3. Packet Departure Event. Figure 3 shows the packet departure events. The event occurs when a packet is enqueued at the outgoing access router interfaces and it is transmitted over the outgoing link. Then B, which is the number of departures packets from the queue occurring during the last time interval, is increased by one. In the steady-state the departure process can be decomposed into two different situations after the departure of a packet: (a) the departing packet sees an empty system or (b) the departing packet sees the next packet in the queue (which is equivalent to the system which immediately servers the next packet in the queue).
4.4. Timer Event. The speed of adaptation is determined by
End
B=B+ 1 Deque
Begin
Packet departure at queue
Figure3: Packet departure event.
End
A=B=0 0≤P≤1
P=P−P1
Yes
(U=A/B)<1 No P=P+P2
Time event at queue
Figure4: Timer event.
sizes of the adjustments for the packet dropping probability depending on whetherU < 1 or U ≥ 1.P must never be smaller than 0 or greater than 1. At the end of a timer event
AandBare set to 0 so that the utilization factor for the next time interval can be computed.
4.5. Parameter Tuning. In this section we look at the
adaptation behavior of the AAQM by studying the sensitivity of the AAQM to the smoothing and utilization parameters
P1,P2, andT. The simulation setup is identical to that in
Section 6. In the first part of the experiment the smoothingT
is varied from 0.010 to 0.090 while the utilization parameters are fixed at P1 = 0.7 andP2 = 1.0. We observe that the average queue length remain smaller respective of the value ofTbeing used. However, the transients due to the sudden load of the unresponsiveness (UDP) flows at 175 s simulation are more pronounced whenTis small. In the second part of the experiment we fixed the value ofT to be equal to 0.010 and varied the value ofP1andP2as shown inTable 1in order to study the sensitivity of the AAQM. Figure 5 shows the evolution of the utilization parametersP1andP2for different
Table 1: The parameter settings for the five different AAQM configurations.
Configurations P1 P2 T
Pa1 0.100 0.300 0.010
Pa2 0.200 0.400 0.010
Pa3 0.450 0.600 0.010
Pa4 0.500 0.700 0.010
Pa5 0.650 0.900 0.010
Pa6 0.700 0.900 0.010
Pa7 0.700 1.000 0.010
values of buffer size. We can see that at the value ofPa7this results in a lower queuing delay and a higher utilization.
As a result of the study regarding the tuning of the AAQM for use in heterogeneous networks we observe that a largeT
will give a larger time interval over which the quotientUis computed. This will in turn lead to a better prediction with regards to the flow through the queue. But on the downside it will also lead to a slower reaction to changes in the flow. Slow reactions to changes in the flow can lead to high delay and packet loss.
5. Analytical Model
Using clearly indicated traffic burstiness over heterogeneous networks and corrections of such traffic several stochastic models have been presented to capture traffic proper-ties of this type. For instance the well-known Markov-Modulated Poisson Process (MMPP) [20] has been used to model the time-varying arrival rate and to capture the important correlation between interarrival times while still maintaining analytical tractability [21]. On the other hand, in heterogeneous networks with heavy traffic, various sources requesting different QoS compete for bandwidth and buffer space while being unaware of the current state of the system resources. This situation can easily lead to congestion even when the demand for available resources is not exceeded [21]. Consequently, system performance degrades due to the increase in packet loss. In this context, congestion control mechanisms play important roles in effective network resource management. This study aims to develop a queuing system with an MMPP arrival process for evaluating the performance of an AQM-based conges-tion control mechanism by using various loss probabilities as the Marking/dropping function. The Marking/dropping function is presented briefly inSection 5.3in this section.
The model for the superposed traffic of video, multi-media, web and ftp sources is analyzed in this paper by constructing an (MMPP-8)/Er(m)/1/L queue. The results given in [22] used to carry out this analysis.
5.1. The Model of Traffic as MMPP-8. An MMPP-8 which
102
Dela
y
(ms)
102
Buffer size (ms)
Pa1 Pa2 Pa3 Pa4
Pa5 Pa6 Pa7
Parameter settings for AAQM configurations
(a)
102
U
tilization
(%)
102
Buffer size (ms)
Pa1 Pa2 Pa3 Pa4
Pa5 Pa6 Pa7
Parameter settings for AAQM configurations
(b)
Figure5: The parameter settings for AAQM configuration for performance metrics (a) delay (b) utilization.
Q0 λ2 λ1
Q2 λ2 λ1
Q1 λ2 λ1
Q4
Q3
λ2 λ1
λ2 λ1
Q5
Q6
λ2 λ1
λ1
λ2
Video sources (RTP)
Multimedia sources (UDP)
www sources (TCP)
Ftp sources (SCTP)
μ λ
On Off
Figure7: Markov model for a minisource.
arrival rates. The 8 is a superposition of two MMPP-4 processes. In the first one,Q3is for video sources andQ4 is for multimedia sources and for the second oneQ5 is for www sources and Q6 is for ftp sources. The service time is approximated by an m-stage Erlang distribution service time (Erlang distribution is an appropriate candidate for representing the true situation with regard to service times and interarrival times [23]). The buffer size is represented by L. In order to model the multimedia sources, and m
Markov model ON-OFF minisources is used as shown in Figure 7to represent a multimedia source. It is assumed that the multimedia packets arrived during the ON state and that there is no arrival during the OFF state. Thenindependent multimedia sources are modeled by an MMPP-4 equivalent to the superposition of theMminisources (M=m×n).
Anm-state MMPP is a double stochastic Poisson process in which the arrival process is determined by an irreducible continuous-time Markov chain consisting of m different states [24]. In order to assist in the approximation of an arrival process of the aggregated minisource let the MMPP-2 process be as
where QsandΛs represents the transition and arrival rate
matrix, respectively.
From [16] it is known that the superposition of two or more MMPPs produces another MMPP. Thus the aggregated video (RTP), multimedia (UDP), TCP and SCTP traffic can be modeled by an MMPP. The infinitesimal generatorQof the Markov chain and the rate matrixΛ of the superposed process are obtained from theQ andΛ given for the RTP, UDP, TCP and SCTP processses.Figure 5shows the structure of an MMP with two states and matches its eight parameters to a particular time scale. By splitting each of the two states into two new states, and adjusting the parameters associated with the new states to another time-scale, the variability over longer time-scales is only introduced over a limited range. The resulting states can then be split again until the required accuracy is obtained. In this paper we limit our study to MMPPs with three levels.Q0is the transition matrix for the resulting eight state chain and Q1 is the transition matrix for MMPP 1,Q2is the transition matrix for MMPP 2 andQ3is the transition matrix for MMP 3 andQ4 is the transition matrix for MMPP 4. The resultingQ0andΛ0of
the aggregated MMPPs process are given as in [16]:
Q0=Q1⊕Q2=(Q1⊗I(4)) + (I(4)⊗Q2),
The resulting transition matrix Q0 will be an (8×8) matrix. The same operation occurs as for transition matrices for arrival rate matrices:
Λ0=Λ1⊕Λ2=(Λ1⊗I(4)) + (I(4)⊗Λ2), Λ1=Λ3⊕Λ4=(Λ3⊗I(2)) + (I(2)⊗Λ4), Λ2=Λ5⊕Λ6=(Λ5⊗I(2)) + (I(2)⊗Λ6).
(3)
The resulting arrival rate matrix Λ0 will be an (8 × 8) matrix and Λ0 is rewritten as a vector of the diagonal elements ofΛ0:
The traffic in the access router for the superposed process can be modeled by an MMP-8/Er(m)/1/L queue where the arrival process is an MMPP-8 and whose services have anm -stage Erlangian distribution and a buffer size is of L. Consider the Markov process whose state is represented by (Nt,Jt,Bt).
TheNt,JtandBtdenote the number of packets in the system,
the state of the arrival process, and the service state at timet, respectively. The sample space of the Markov processϕ0and ϕare defined byϕ0= {(0,j); 1≤j≤8}and
ϕ= b,j,l, 1≤b≤L, 1≤j≤8, 1≤l≤m,
the steady state probability is
lim
t→ ∞Pr Nt=b, Jt=j, Bt=l
.
(5)
The probability vector can be denote asspb with a buffer occupancy ofbfor the superposed Markov process of video, multimedia, www and ftp sources given:
The steady-state probability of MMPP-8/Er(m)/1/L can then be computed by extending the results in [25]. The size of theQinfinitesimal generator matrix is 8(Lm+ 1)×
8(Lm+ 1). The steady-state probability of the system can be obtained from the performance parameters such as the average number of packets in the system, so that drop probability and packet delay can be easily estimated.
5.2. The Probability of Buffer Occupancy. The probability vec-tor with buffer occupancy ofbfor video, multimedia, www, and ftp sources1b,
bcan be obtained as
for video sources,
So, in the end the average number of packets for the superposed process (Q0) can be computed [25] as
The average-number-of-packets delay of the superposed process (Q0) is
Packets-loss probability of the aggregated video source can be obtained as
The packets-loss probability of the aggregated multimedia source is computed as
P2=
The packets-loss probability of the aggregated www source is computed as
The packets loss probability of the aggregated ftp source is computed as
The packets-loss probability of the aggregated video sources, multimedia source, www source and ftp sources used as the threshold to control the external traffic arriving into the queue is shown inFigure 7. When the queuing length exceeds the threshold then the arriving packets will be marked or dropped. This process can be seen as a reduction of the arrival rate with the loss probability.
Consider the system in an equilibrium state. In this case it is clear that the input flow must be equal to the output flow for a given state of the superposed process (Q0):
L
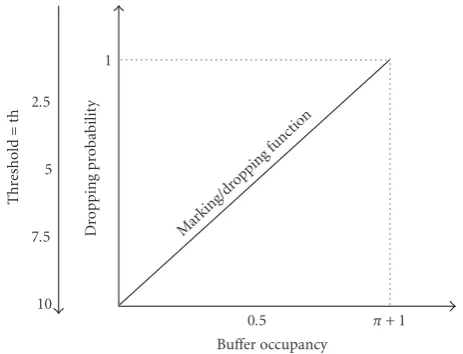
5.3. Marking/Dropping Function. As explained, the packet
marking/dropping function uses a threshold to control the external traffic arriving in the queue. The value of the threshold (th) will be changed based on the packets-loss probability of the traffic sources. The probability vector with buffer occupancies for video, multimedia, www and ftp sources 1b,
b are used as the congestion
indicator. A linear function is adopted to control the congestion by marking/dropping packets for each traffic source. The general control function was considered as follows:
F(x)= x−th
−th, th≤x <
+ 1, (18)
is used for marking/dropping packets and the position of the threshold for each of the traffic sources (Q3,Q4,Q5,Q6) under the MMPP-2 arrival process, as can be seen inFigure 7. The marking/dropping control function is adopted mainly in the AQM by using the output values for the parameters setting of each AQM and this has been shown inTable 2. The marking/dropping probability increases linearly between 0 and 1.
5.4. State Transition Diagram. A state transition diagram
for the queuing model regard in each of the traffic sources (Q3,Q4,Q5,Q6) under the MMPP-2 arrival process is shown inFigure 8. Two different states of the MMP-2 corresponds to two independent Poisson arrival processes with rateλ1and λ2.β1andβ2are the intensities of the transition between the two states. The state (b,j) with (1≤b≤L, 1≤j≤2) which represents the current queuing length is b and the traffic arrival process MMPP-2 is at state j. The buffer capacity is given asLandμis the service rate.
6. Simulations Model
The theorem (inSection 5) shows that by choosing parame-ters settings according to (18) it is possible to guarantee the local stability and responsiveness of the AQM schemes.
6.1. Simulation Model. The simulation results presented
have been obtained by using the NS-2 simulation tool [26].Figure 9 shows the topology used. We investigate the performance and robustness of the AAQM and compare it to that of ARED, PI and Vq. The dynamic behavior of the AAQM, ARED, PI and Vq schemes is simulated under a variety of network topologies and traffic sources. There is a bottleneck between Node 0 and Node 1. The link capacity of the bottleneck is 10 Mb/s. The topology consists of a wireless heterogeneous network employing three wireless access networks UMTS, WiFi and WiMax. The source traffic is generated by using TCP, UDP, RTP and SCTP and the traffic sources are connected by 100 Mbps links with Node 0. Node 1 is connected by means of UMTS, WiFi and WiMax base sta-tions through 100 Mbs links. There are three traffic groups. Each group consists of four wired connections. This topology is designed to capture the essential characteristics of the het-erogeneous network traffic using the four transport protocols for the connection between the wired and wireless nodes.
The link between the nodes 0 and 1 represents the virtual bottleneck link when running the AQM algorithms. The vir-tual bottleneck represents an access router. Data originating at the nodes 2–5 are received by the nodes Wless-1 to Wless-4 (through the WiFi base station) and data originating at nodes 6–9 are received by the nodes Wless-5 to Wless-8 (through the WiMax base station) and data originating at the nodes 10–13 are received by the nodes (User Equipment) UE-1 to UE-4 (through the UMTS base station).
The source of the RTP uses an MPEG-4 binary trace file [27] as its input trace file. The RTP agent sends data from the MPEG-4 binary trace file and the receiver is a RTCP agent that sends a report concerning the connection (packets-loss, RTT) so that the RTP agent can adapt his rate and the RTCP
sends a report every 900 ms. The UDP flows are based on an Exponential On/Offdistribution traffic generator with a bursty time of 800 ms and an idle time of 200 ms. The TCP flow uses a Pareto traffic generator (to generate aggregate traffic that exhibits a long-range dependency). The SCTP flows use FTP traffics that persists throughout the duration of the simulation. The traffic generators start randomly after 25 s seconds of the simulation to avoid indeterminate behavior and lasts for 200 seconds which is sufficiently long to observe both the transient and the steady-state behaviors of the each of the AQM schemes. Each simulation was run 50 times with different seeds for the random number generator. The average packet size is 1282 bytes and the maximum buffer size of the access router is set to 130 KB which corresponds to approximately 100 packets.
6.2. Parameter Settings Used in the Simulations. Table 2 shows the parameter settings for each of the AQM algorithms in the simulation. The control parameter values of the AQM schemes under evaluation are set based on the recommen-dation as provided by the authors of each AQM schemes. The objective is to allow a fair comparison using the setting recommended by the respective authors and also allow for a comparative evaluation using the same controller objectives. The AQM schemes control parameters are not neces-sarily appropriate for stability. The observed instability was significantly reduced in AQM algorithms through the use of damping and thresholding. Damping (or hysteresis) will be done by applying the control parameters of each AQM algorithms together with correct threshold values. Damping reflects a direct tradeoffbetween stability on the one hand and responsiveness, the system’s ability to react to change circumstance on the other [28]. The relationship between the queue length, congestion notification probability and capacity of router and the traffic parameters such as the number of flows and the RTT is defined as queue law. In this section we develop a simple model of buffer load with persistent congestion and apply it to mixed traffics in order to derive a general queue law.
λ2 λ2
μ μ
0, 2 1, 2
λ2 λ2 λ2
P, 2 L, 2
μ μ μ
β1 β2
μ μ
0, 1 1, 1
λ1 λ1
β1 β2
β1 β2
β1 β2
μ μ μ
λ1 λ1 λ1
P, 1 L, 1
Threshold from packet loss probability
· · · · · ·
· · · · · ·
Figure8: State transition diagramfor each traffic sources (Q3,Q4,Q5,Q6) under the MMPP-2 arrival process.
N-10 N-11 N-12 N-13
100 Mb
/20 ms
100 Mb
/20 ms
100 Mb
/15 ms
100
Mb
/
15
ms
100 Mb/1 ms
UMTS Bs
UE-4 UE-3 UE-2 UE-1 Wless-8 Wless-7 Wless-6 Wless-5 Wless-4 Wless-3 Wless-2 Wless-1
100 Mb/1 ms
Wimax Bs Node 1
100 Mb/5 ms Node 0
100Mb/ 20 ms 100 Mb/20 ms
100 Mb/ 25 ms
100 Mb
/15 ms
N-9
N-8
N-7
N-6
100 Mb
/25 ms 100 Mb
/20 ms
100 Mb
/20 ms
100
Mb
/
5m
s
N-5 N-4 N-3 N-2
100 Mb/1 ms
Wifi Bs
10
Buffer occupancy 1
Figure10: Marking/dropping function with threshold.
Apart from the time interval (125 s–175 s) the values for the parametersαandγwere 0.50 and 0.90, respectively.
For ARED the variation of the th values means that the parameterWq varied from 0.0025 to 0.0030 and the values
of maxp varied from 0.01 to 0.5. During the time interval
(125 s–175 s) the value ofWq was 0.003 and value of maxp
was 0.5.
The values of the PI coefficientsaandb were obtained from [29] andQrefwas chosen to be 100 packets. During the time interval (125 s–175 s) the value of the threshold (th) is decreased to 75% of buffer occupancy in order to overcome any queue size oscillation.
For the AAQM during the time interval (125 s–175 s) the value of threshold (th) is maintained at a fixed values of 95% of buffer occupancy. In addition to these experiments we have conducted extensive simulations including simulta-neous variations to the threshold values and the traffic load. We used heterogeneous flows and have demonstrated AAQM to regulate the queuing delays with much less variation than VQ, ARED and PI while achieving a high throughput. The result will be discussed in details in the next section.
In general reducing the threshold value gives a high marking/dropping probability and the packet loss proba-bility increases which means that the congestion control mechanism is becoming less effective and consequently these will affect the system performance metrics including both the adaptation and the mean response time.
7. Performance Analysis
The system performance metrics including the queue length, response time and the system throughput will be evaluated as follows. We compare the performance variation using different parameters settings which are based on different values for the marking/dropping function for different flows sizes. By varying the value of the marking/dropping function it becomes possible to study system performance in terms of its queue length, response time, throughput and jitter. Figures 11, 12, 13, 14, and 15 show the results for
those four performance metrics for all the AQM schemes. We summarize the performance results for each of the performance metrics separately in the following subsections.
7.1. The Queue Length. The design goals of the AQM
algori-thms are responsiveness (short-term design goal) and stabil-ity (long-term design goal) in order to achieve a satisfactory control performance.
The degree to which the two performance objectives are archived is measured using the queue length as a performance metric for the transient performance (i.e., speed of response to congestion). The queue should generally be kept short. The added delay from the queue also has negative influences on the congestion control algorithm which should obtain feedback that reflects the current state in the network and any time-lag. Long queues distort the RTT samples and render any RTT-based mechanism inefficient.
To analyze stability (steady state) control performance, we studied the elimination of the bias of bursty sources. The term “bursty source” is here considered as a source that sends bursts of packets and none or relatively few packets in between the bursts (e.g., TCP). Maintaining a bounded queue length is very important since many applications require guarantees in term of end-to-end delay. The queue length stability assists in the avoidance of buffer overflow which is responsible for consecutive packet drop and large delays in addition to buffer emptiness which is responsible for decreasing the throughput.Figure 14 shows the queue length evolution and queue length distribution for ARED, VQ, PI and AAQM. The PI and AAQM algorithms are designed to maintain the queue length at an approximate expected value. VQ and ARED displayed the worst perfor-mance of the simulated AQM algorithms as we can be seen inFigure 14. Both VQ and ARED are sensitive to traffic load and this does not stabilize the queue length. This is due to the fact that ARED monitors the average queue length which has a direct consequence on its reactivity as can be seen in Figure 14(b). VQ adjusts the virtual queue length based on the measured arrival rate which has the effect of increasing the buffer size as can be seen fromFigure 14(a). On the other hand the performance of PI and AAQM is better than that for VQ and ARED. AAQM and PI have similar queue lengths. In addition PI is less responsive than AAQM in response to buffer emptiness. As shown inFigure 15, the PI queue size oscillates between 85 and 100 packets. In contrast, AAQM regulates the queue size to 95% of the buffer occupancy.
1000 2000 3000 4000 5000 6000
Thr
o
ug
hpu
t
(Kbps)
200 400 600 800 1000 1200
Number of flows
Throughput versus number of flows for RTP
(a)
1000 2000 3000 4000 5000 6000 7000
Thr
o
ug
hpu
t
(Kbps)
200 400 600 800 1000 1200
Number of flows
Throughput versus number of flows for UDP
(b)
300 400 500 600 700 800 900 1000
Thr
o
ug
hpu
t
(Kbps)
200 400 600 800 1000 1200
Number of flows AAQM
ARED
Vq PI
Throughput versus number of flows for TCP
(c)
100 200 300 400 500 600 700 800 900 1000
Thr
o
ug
hpu
t
(Kbps)
200 400 600 800 1000 1200
Number of flows AAQM
ARED
Vq PI
Throughput versus number of flows for STCP
(d)
Figure11: Throughput for (a) Video Traffic, (b) Multimedia Traffic, (c) TCP Traffic (long-lived), and (d) SCTP traffic.
Table2: lists of control parameters for each AQM.
VQ [10] P-gain γ≤1 α≤0.80
ARED [12] Wq≤0.003 minth<20% of queue size maxth≤(3·minth) maxp≤ 0.5 PI [17,29] Qref=buffer size Qt a=0.00001822 b=0.00001816
AAQM P1≤0.900 P2≤1.000 T=0.010
for an access router (with small buffer) in order to avoid absorbing more bursty arrivals in transit traffics which has been discussed inSection 1.
7.2. The Packet Throughput. A design goal for AQM
algo-rithms is in maintaining a stable packet-drop rate. In general,
10
200 400 600 800 1000 1200
Number of flows AAQM
ARED
Vq PI
Delay versus number of flows for RTP
(a)
200 400 600 800 1000 1200
Number of flows AAQM
ARED
Vq PI
Delay versus number of flows for UDP
(b)
200 400 600 800 1000 1200
Number of flows AAQM
ARED
Vq PI
Delay versus number of flows for SCTP
(c)
200 400 600 800 1000 1200
Number of flows AAQM
ARED
Vq PI
Delay versus number of flows for TCP
(d)
Figure12: Delay for (a) Video Traffic (b) Multimedia traffic (e.g., Voip) (c) SCTP Traffic (d) TCP Traffic.
for packet marking/dropping. In terms of throughput the simulated controllers achieved good performances the excep-tion being the ARED. This is due to the fact that the ARED dropping probability calculation depends on the previous loss ratio which makes it less sensitive to transient congestion as can be seen in Figures11(b)–11(d). PI converges quickly to the steady state and presents less fluctuation than VQ. PI induces more queue emptiness notably in the transitory period which induces a decrease in the total throughput which can be seen in Figures11(a)–11(d). In both ARED and VQ, when the traffic load is very light, there is minimal packet loss (high throughput) and in this case both ARED and VQ experience a longer response time. Both algorithms reaches the steady state after more than 75 s and the router buffer emptiness and throughput drop to the transient period.
However, ARED, VQ and PI display fluctuation and low packet throughput over 400 flows. As a result the PI and AAQM controllers can remove the bias against bursty sources effectively. Whereas ARED and VQ may be biased against bursty sources because of multiple and bursty packet losses. Figures 11(a)–11(d) shows the average packet-throughput for each AQM algorithm under different traffic load levels. PI and AAQM show significantly higher average packet-throughput than ARED and VQ for all traffic load levels.
7.3. The Queuing-Delay. Delay is a very important metric
1 2 3 4 5 6 7
Ji
tt
er
(ms)
200 400 600 800 1000 1200
Number of flows AAQM
ARED
Vq PI
Jitter versus number of flows for RTP
(a)
0 1 2 3 4 5 6
Ji
tt
er
(ms)
200 400 600 800 1000 1200
Number of flows AAQM
ARED
Vq PI
Jitter versus number of flows for UDP
(b)
2 3 4 5 6 7 8 9 10 11 12
Ji
tt
er
(ms)
200 400 600 800 1000 1200
Number of flows AAQM
ARED
Vq PI
Jitter versus number of flows for TCP
(c)
Figure13: Jitter for (a) Video Traffic (b) Multimedia Traffic (c) TCP traffic.
evaluated. This is due to the fact that PI is less responsive and this results in periods of buffer emptiness. VQ and ARED do not provide restricted delays. These schemes result in variable delays reaching very much larger values than AAQM as shown in Figures12(a)–12(d). PI, VQ and ARED display an increase in the queuing delay with work-loads and this indicates a greater instability with regards to the responsibility of the algorithms. We note that an instability problem in the buffer responsibility will affect delay sensitive multimedia applications.
7.4. The Queuing-Jitter. We should note that the queue
fluctuation inevitably causes delay and jitter. The network with the ability to provide QoS guarantees should indeed make an effort to eliminate this phenomenon. As we have
discussed in a pervious section (Section 4) ARED, VQ and PI show queue fluctuations over 400 flows and this causes higher jitter which is clearly visible in Figures13(a)–13(c). In a normal state an access router is overloaded with more than 400 flows and in the case of IPTV which is provided by different ISPs to dozens of Mobile subscribers, the number of flows during an overload time of day will be more than 800 flows. Indeed PI, ARED and VQ schemes result in jitter (variable delays) reaching very large values as shown in
Figure 12. Hence, AAQM is able to give a guarantee for a
restricted jitter in contrast to the other schemes.
7.5. Sensitivity to the Sudden Changing Traffic Load. In
1 2 3 4 5 6 7 8 9 10 ×104
Queue
length
(pac
kets)
20 40 60 80 100 120 140 160 180 200 220 240 Time (s)
Vq
Vqwith 1200 flows
(a)
1 2 3 4 5 6 7 8 9 10 ×104
Queue
length
(pac
kets)
20 40 60 80 100 120 140 160 180 200 220 240 Time (s)
ARED
ARED with 1200 flows
(b)
10 20 30 40 50 60 70 80 90 100 110 120
Queue
length
(pac
kets)
20 40 60 80 100 120 140 160 180 200 220 240 Time (s)
AAQM
AAQM with 1200 flows
(c)
10 20 30 40 50 60 70 80 90 100 110 120
Queue
length
(pac
kets)
20 40 60 80 100 120 140 160 180 200 220 240 Time (s)
PI
PI with 1200 flows
(d)
Figure14: Queue Monitoring with 1200 flows for (a) VQ (b) ARED (c) zooming in AAQM (d) Zooming in PI.
changes where the traffic consists of 25% of mostly Web-like short-lived traffic and 25% of ftp-like long-lived elephant flows and 50% unresponsiveness traffic load varying over time. The simulation starts with heavy traffic load consisting of 4 sources for each of the wireless network technologies at levelsn=10, 25, 50, 70, and 100 spawning flows for each of the sources with 25% elephant and 25% short-lived flows and 50% unresponsiveness flows. Thus the initial total number of flows is 120 whenn = 10.From time 25 s traffic starts and from time 125 s 25% of the initial total flow drops, in other words 50% of the unresponsiveness (UDP) flow drops during 50 s so the status of traffic load changes from a heavy traffic load to a medium traffic load. Finally the 25% of total
flows dropped is added again at time 175 s. Thus from time 175 s the status of the traffic load will be changed to a heavy traffic load.Figure 14shows the queue length dynamics of the AQM algorithms under the traffic scenario. The queue length of PI remains at aroundQrefand AAQM remains at aroundQ(n) (seeFigure 2), except during the time interval (125 s–175 s) because the number of unresponsiveness flows during this time interval is smaller than the lower bound 120 flows (n=10, then the initial total flows is 120) for PI and
80 85 90 95 100 105
Queue
length
(pac
kets)
100 102 104 106 108 110 112 114 116 118 120 Time (s)
AAQM
AAQM with 1200 flows
(a)
80 85 90 95 100 105
Queue
length
(pac
kets)
100 102 104 106 108 110 112 114 116 118 120 Time (s)
PI
PI with 1200 flows
(b)
Figure15: Comparison of instantaneous Queue Size between (a) AAQM and (b) PI at time 100 s to 120 s with 1200 flows.
0 0.05 0.1 0.15 0.2 0.25
Dr
op
ra
te
400 600 800 1000 1200 1400 1600 Number of sessions
AAQM Blue
Drop rate versus number of sessions
(a)
50 100 150 200 250 300
Thr
o
ug
hpu
t
(Kbps)
400 600 800 1000 1200 1400 1600 Number of sessions
AAQM Blue
Throughput versus number of sessions
(b)
Figure16: (a) Drop rate (b) Throughput.
the fact both schemes controller queue length are based on the measured arrival rate and queue length which has the effect of increasing buffer sizes.
8. Comparisons with a Hybrid AQM Algorithm
In this section we compare AAQM with BLUE [30]. BLUE is a hybrid algorithm that uses packet loss and link utilization
to mark a packet to avoid congestion. The drop probability is increased upon packet loss and the packet drop probability is reduced when the link becomes idle. BLUE uses both the packet loss and link utilization history to manage congestion. BLUE maintains a single probability, pm which it uses to
rate at which it signals congestion notification. Conversely, if the queue becomes empty or if the link is idle, BLUE reduces its marking probability,pm.BLUE uses two other parameters
which control how quickly the marking probability changes over time. The first is freeze time. This parameter determines the minimum time interval between two successive updates of pm. The other parameter used, delta, determines the
amount by which pm is increased incrementally when the
queue overflows or is decreased incrementally when the link is idle. BLUE uses fixed control parameters (freeze time and delta) and is due to that not able to adapt the parameter settings according to changing traffic conditions.
Bursty sources are used for performance evaluation with varying queue sizes managed by the AAQM and BLUE algorithms. The bursts generated require an AQM algorithm to efficiently and quickly adapt to the current situation to maintain a high overall throughput and to avoid dropping more packets than necessary. As a result the drop rate and throughput are comparable for the two algorithms.
Table 3 shows the parameter settings for the BLUE
algorithm in the simulation. The control parameter values of the BLUE scheme under evaluation are based on the recommendation as provided by the authors of BLUE [30].
Figures16(a)and16(b)depict the results for drop rate and overall throughput, respectively. For the experiments we allowed the AQM schemes to converge to steady state when there were 400 web sessions. Then we increased the web session number to 800 and 1600 to study the performance when the number of short flows increases. The resulting curves are plotted using a 95% confidence interval.
When the link capacity is low AAQM regulates the queue length best, while BLUE oscillates between an empty and full buffer. As a result BLUE shows poor performance in a wide range of traffic scenarios. BLUE should be configured with a sufficient amount of buffer space to accommodate an applied load greater than the link capacity from the time congestion is detected using the queue length trigger, until the load decreases in response to congestion notification. The AAQM controller is able to compensate for the oscillations of the flow and gives satisfactory performance with fast and stable control dynamics. AAQM shows the most robust steady-state control performance independent of traffic loads in terms of a relatively small mean value of the packet loss rate as well as its variance. From Figures16(a)and16(b)it can be seen that AAQM has a lower drop rate than BLUE when the number of sessions is 1600, and a higher throughput than BLUE.
BLUE controls congestion reactively based on the current or past congestion information. Thus some degree of performance degradation such as multiple packet losses and link underutilization are not avoidable.
9. Conclusions
In this paper we have presented a method to solve the MMPP-8 process that is utilized for the modeling of video, multimedia, web and ftp sources. We have also developed an analytical model of average packet delay and packet loss probability of AQM congestion control mechanisms
Table3: Control parameters for the BLUE [30]. BLUE freeze time=10 ms D1=0.001 D2=0.0002
for robust control on an access router for heterogeneous networks. As discussed in Sections1and5traffic burstiness and correlation have a considerable impact on network performance. The distinguishing properties of the presented model include the capturing of traffic burstiness and the generation of an expression in order to calculate the desired performance measure with regards to the queuing system. The analytical model has been used for buffer occupancy as the congestion indicator and a linear function has been adopted to control congestion by marking/dropping packets for each traffic source. The Interaction between the marking/dropping control function and the control parameters of each AQM is captured through a simple model, whose behavior is described by a set of traffics and router parameters. The model defines the relationship as a queue law and the model is applied to a system that uses packet marking/dropping for congestion notification. The queue law is used for router design of the AAQM algorithm that provides performance robustness in the presence of bursty traffic. The model verified through simulation that the design is well dimensioned for providing the property of minimizing queuing delay during maximum utilization in the heterogeneous wireless access networks.
References
[1] S. Floyd,Congestion Control Principles, RFC2914, 2000. [2] S. Floyd, M. Handley, J. Padhye, and J. Widmer,
“Equation-based congestion control for unicast applications,” in
Proceed-ings of ACM SIGCOMM Conference, pp. 43–56, September
2000.
[3] S. Floyd and V. Jacobson, “Random early detection gateways for congestion avoidance,”IEEE/ACM Transactions on
Net-working, vol. 1, no. 4, pp. 397–413, 1993.
[4] V. Lal, J. A. Summers, M. L. Masanovic, L. A. Coldren, and D. J. Blumenthal, “Novel compact inPbased monolithic widely-tunable differential, Mach-Zehnder interferometer wavelength converter for 40Gbps operation,” inIndium Phosphide and
Related Materials, Scotland, 2005.
[5] M. L. Masanovic, V. Lal, J. S. Barton, and E. J. Skogen, “Summonolithically-integreated all-optical wavelength con-verters,”Journal of Ligthwave Technology, vol. 23, no. 3, 2005. [6] H. Park, E. F. Burmeister, S. Bjorline, and J. E. Bowers,
“40-Gb/s optical buffer design and simulation,” inProceedings of the 4th International Conference on Numerical Simulation of
Optoelectronic Devices (NUSOD ’04), pp. 19–20, August 2004.
[7] D. Fisher, “US natinal science foundation and the future Internet design,”ACM SIGCOMM Computer Communication
Review, vol. 37, no. 3, pp. 85–87, 2007.
[8] G. Appenzeller, I. Keslassy, and N. McKeowen, “Sizing router buffers,” inProceedings of the SIGCOM, pp. 281–292, ACM Press, New York, NY, USA, 2004,.
[9] S. Ryu, C. Rump, and C. Qiao, “Advances in active queue management (AQM) based TCP congestion control,”
[10] S. S. Kunniyur and R. Srikant, “An adaptive virtual queue (AVQ) algorithm for active queue management,”IEEE/ACM
Transactions on Networking, vol. 12, no. 2, pp. 286–299, 2004.
[11] C. V. Hollot, Y. Liu, V. Misra, and D. Towsley, “Unresponsive flows and AQM performance,” in Proceedings of the 22nd Annual Joint Conference on the IEEE Computer and
Commu-nications Societies, pp. 85–95, April 2003.
[12] W. C. Feng, D. D. Kandlur, D. Saha, and K. G. Shin, “Self-configuring RED gateway,” inProceedings of the 18th Annual Joint Conference of the IEEE Computer and Communications
Societie (INFOCOM ’99), pp. 1320–1328, March 1999.
[13] J. Aweya, M. Ouellette, D. Y. Montuno, and K. Felske, “Rate-based proportional—integral control scheme for active queue management,”International Journal of Network Management, vol. 16, no. 3, pp. 203–231, 2006.
[14] F. Zheng and J. Nelson, “An H∞ approach to congestion control design for AQM routers supporting TCP flows in wireless access networks,”Computer Networks, vol. 51, no. 6, pp. 1684–1704, 2007.
[15] S. Yi, M. Kappes, S. Garg, X. Deng, G. Kesidis, and C. R. Das, “Proxy-RED: an AQM scheme for wireless local area networks,” inProceedings of the 13th International Conference
on Computer Communications and Networks (ICCCN ’04), pp.
460–465, October 2004.
[16] V. Amoia, G. De Micheli, and M. Santomauro, “Computer-oriented formation of transition-rate matrices via kronecker algebra,”IEEE Transactions on Reliability, vol. 30, no. 2, pp. 123–132, 1981.
[17] C. V. Hollot, V. Misra, D. Towsley, and W. Gong, “Analysis and design of controllers for AQM routers supporting TCP flows,”IEEE Transactions on Automatic Control, vol. 47, no. 6, pp. 945–959, 2002.
[18] R. Rahmani and O. Popov, “Adaptive active queue manage-ment in heterogeneous networks,” inProceedings of the 26th International Conference on Information Technology Interfaces
(ITI ’04), pp. 633–636, Croatia, June 2004.
[19] K. Ramakrishnan, S. Floyd, and D. Black, “The Addition of Explicit Congestion Notification (ECN) to IP,” IETF RFC 3168, Proposed Standard, 2001.
[20] W. Fischer and K. Meier-Hellstern, “The Markov-modulated Poisson process (MMPP) cookbook,”Performance Evaluation, vol. 18, no. 2, pp. 149–171, 1993.
[21] D. McDysan, QoS & Traffic Management in IP & ATM
Networks, McGraw Hill, 2000.
[22] H. Yamada and S. Sumita, “A traffic measurement method and its application for cell loss probability estimation in ATM networks,”IEEE Journal on Selected Areas in Communications, vol. 9, no. 3, pp. 315–324, 1991.
[23] L. Kleinrock, Queueing Systems, vol. 1, John Wiley & Sons, 1976.
[24] F. Zheng and J. Nelson, “An H∞ approach to congestion control design for AQM routers supporting TCP flows in wireless access networks,”Computer Networks, vol. 51, no. 6, pp. 1684–1704, 2007.
[25] H. Heffes and D. M. Lucantoni, “A markov modulated characterization of packetized voice and data traffic and related statistical multiplexer performance,”IEEE Journal on
Selected Areas in Communications, vol. 4, no. 6, pp. 856–868,
1986.
[26] The NS-2 Simulator,http://www.isi.edu/nsnam/ns/.
[27] P. Seeling, F. Fitzek, and M. Reisslein,Video Traces for Network
Performance Evaluation, Springer, Berlin, Germany, 2007.
[28] D. Bertskas and R. Gallar, Data Networks, Prentice Hall, Englewood cliffs, NJ, USA, 2nd edition, 1992.
[29] S. Ryu, C. Rump, and C. Qiao, “Advances in active queue management (AQM) based TCP congestion control,”
Telecom-munication Systems, vol. 25, no. 3-4, pp. 317–351, 2004.
[30] W. Feng, D. Kandlur, D. Saha, and K. Shin, “BLUE: a new class of active queue management algorithms,”ACM Transaction on