R E S E A R C H
Open Access
PUE attack detection in CWSNs using anomaly
detection techniques
Javier Blesa
*, Elena Romero, Alba Rozas and Alvaro Araujo
Abstract
Cognitive wireless sensor network (CWSN) is a new paradigm, integrating cognitive features in traditional wireless sensor networks (WSNs) to mitigate important problems such as spectrum occupancy. Security in cognitive wireless sensor networks is an important problem since these kinds of networks manage critical applications and data. The specific constraints of WSN make the problem even more critical, and effective solutions have not yet been implemented. Primary user emulation (PUE) attack is the most studied specific attack deriving from new cognitive features. This work discusses a new approach, based on anomaly behavior detection and collaboration, to detect the primary user emulation attack in CWSN scenarios. Two non-parametric algorithms, suitable for low-resource networks like CWSNs, have been used in this work: the cumulative sum and data clustering algorithms. The comparison is based on some characteristics such as detection delay, learning time, scalability, resources, and scenario dependency. The algorithms have been tested using a cognitive simulator that provides important results in this area. Both algorithms have shown to be valid in order to detect PUE attacks, reaching a detection rate of 99% and less than 1% of false positives using collaboration.
Keywords: Primary user emulation; Security; Cognitive wireless sensor networks; Behavior; Collaborative systems
1 Introduction
One of the fastest growing sectors in recent years has undoubtedly been that of wireless sensor net-works (WSNs). WSNs consist of spatially distributed autonomous sensors that monitor a wide range of ambi-ent conditions and cooperate to share data across the network. WSNs are increasingly being introduced into our daily lives. Potential fields of applications can be found, ranging from the military to home control com-mercially or industrially, to name a few. The emergence of new wireless technologies such as Zigbee and IEEE 802.15.4 has enabled the development of interoperable commercial products, which is important for ensuring scalability and low cost. Most WSN solutions operate on unlicensed frequency bands. In general, they use indus-trial, scientific, and medical (ISM) bands, like the world-wide available 2.4-GHz band. This band is also used by a large number of popular wireless applications, for exam-ple, those working over Wi-Fi or Bluetooth. Thus, the
*Correspondence: [email protected]
Department of Electronic Engineering, ETSI de Telecomunicación (UPM), Av. Complutense 30, Madrid 28040, Spain
unlicensed spectrum bands are becoming overcrowded. As a result, coexistence issues on unlicensed bands have been the subject of extensive research, and in particu-lar, it has been shown that IEEE 802.11 networks can significantly degrade the performance of Zigbee/802.15.4 networks when operating on overlapping frequency bands [1].
The increasing demand for wireless communication presents a challenge to have an efficient spectrum use. To address this challenge, cognitive radio (CR), which enables opportunistic access to the spectrum, has emerged as the key technology. A CR is an intelligent wireless commu-nication system, aware of its surrounding environment, and it adapts its internal parameters to achieve reliable and efficient communications. These new networks have many applications, such as the cognitive use of the TV white space spectrum or making secure calls in emer-gency situations. In order to create these new appli-cations, CR differentiates between two kinds of users: primary users (PUs), those who are licensed users, and secondary users (SUs), those who try to use the same bands when they detect a spectral hole. Adding cognition
to the existing WSN infrastructure brings about a lot of benefits. However, not only will it provide access to new spectrum bands but it will also provide better prop-agation characteristics. By adaptively changing system parameters like modulation schemes, transmit power, car-rier frequency, and constellation size, a wide variety of data rates can be achieved. This will certainly improve the power consumption, network life, and reliability of a WSN.
The nature of large, dynamic, adaptive, cognitive wire-less sensor networks presents significant security scheme design challenges. A cognitive wireless sensor network has many constraints and many different features as com-pared to traditional WSNs. While security challenges have been widely tackled with regard to traditional networks, it is a novel area in cognitive wireless sensor networks. The wireless medium is inherently less secure than the wired one because its broadcast nature makes eavesdrop-ping easier. Any transmission can be easily intercepted, altered, or replayed by an adversary. The wireless medium allows an attacker to easily intercept valid packets and inject malicious ones. Cognitive features enable dynamic reconfiguration to avoid these attacks. However, mali-cious nodes can use dynamic reconfiguration to create new attacks such as primary user emulation (PUE). PUE is an attack where a malicious node emulates the behav-ior of an incumbent node with the purpose of using the radio spectrum for its own interest or denying the access to other nodes.
To avoid these attacks, several approaches have been developed, most of them based on location. However, other cognitive features such as collaboration and learn-ing have not been sufficiently exploited. We need to take into account that most WSNs have been developed in order to carry out a specific application. As a result, nodes usually have their own behavior pattern. This character-istic gives the network an opportunity to create a node profile for each sensor. These profiles can be created and optimized, thanks to cognitive features such as spectrum awareness, learning, and collaboration. In this paper, sim-ulations show how collaboration is essential for improving detection. Moreover, collaboration is the parameter that contributes most efficiently. The node profiles are used to detect anomalies in behavior, an example of which are PUE attacks.
The organization of this paper is as follows: In Section 2, works done on security for dealing with PUE attacks are reviewed. In Section 3, a brief introduction to the main topics related to behavior learning and security is provided. Then, in Section 4, the assumptions taken into account for the simulations are specified. Section 5 explains the general architecture of the system, while Sections 6 and 7 provide its evaluation. Finally, the con-clusions are drawn in Section 8.
2 Related work
According to Section 1, it is very clear that CWSNs face the dangerous problem of security. Several attacks could be adapted from WSNs to the new paradigm of cognitive networks. Over the past 10 years, some approaches related to security on cognitive radio networks have appeared. They describe specific attacks against these networks, but few countermeasures have been proposed.
Most studies on security are focused on PUE detection. Given the origin of cognitive radio networks, the efficient use of TV spectrum in the USA, early studies used loca-tion in order to detect malicious attacks. In this case, PUs are TV towers with a precise behavior and location.
In [2], Chen and Park present the first method for detecting a PUE attack based on location. The idea of this method is to differentiate the attacker from a licensed user by comparing the transmission origin with the previously known PU position. The same authors use a mechanism based on location in [3]. Moreover, they include some new parameters, such as signal power or RF fingerprints, to decide the nature of the signal.
In [4], the authors assume that the attacker is close to the victim, and the real PU is much farther from the SUs than the attacker. Moreover, the position of each node, including the attacker, is fixed. Given this assumption, SUs can learn about the characteristics of the spectrum according to the received power. The authors in [5] follow a similar approach. Despite not using any location infor-mation, they assume a static scenario with the PU much farther away from other possible malicious nodes than the SUs.
More location-based countermeasures can be found in [6] and [7]. In the first work, secondary users calculate the estimated position of the PUE attacker and then propagate this knowledge to reach a coordinate decision. The sec-ond work is focused on the algorithm used to detect the position of the PUE attacker.
All these countermeasures are based only on location. This characteristic cannot be used in some CWSN scenar-ios where both SUs and PUs can be mobile. Therefore, it is very clear that another approach should be adopted.
A few different solutions, not based on location, have been presented. In [8], the authors use the phase noise of a local oscillator as a fingerprint to differentiate the incumbent signals from the attacking ones.
Finally, in [9], the authors present a differential game approach to mitigate the PUE attack. Based on the assumption that the PUE attacker has less energy than the PUs, they look for the optimal sensing strategy for SUs. The Nash equilibrium solution is obtained.
In this paper, a solution based on the use of node behavior is presented. Two effective and also simple algo-rithms have been implemented: cumulative sum and data clustering.
3 Behavior-based system
As geolocation countermeasures do, defenses based on behavior try to model the PUs. The model is used to look for the differences between PUs and attackers. For exam-ple, in [6], authors use some radio parameters to decide if the transmitter is an incumbent transmitter or an attacker. These parameters are transmitted power and location. For a typical TV scenario on CR, the PU model can be very precise. However, as with geolocation countermeasures, the previous studies do not work with CWSNs. Unfor-tunately, a model for PUs on CWSNs does not exist yet. PUs are usually more unpredictable than in previous sce-narios. Moreover, the PU’s behavior can be very different depending on the application. However, if we focus on limited scenarios, for example, ambient intelligence in a home or a building, the PU is specifically defined. Param-eters like power transmission, spectrum time occupancy, and transmission frequency could be modeled.
Learned behaviors of these parameters allow the system to create some profiles that are then compared with peri-odically acquired measures. It is easy to understand that when a PUE attack happens, an anomaly in the learned parameters can be detected. The intrinsic goals of an attacker make it impossible to have a complete likeness between a PU and a PUE attacker. For example, if the goal of a PUE attack is to use a whole frequency band, it needs to transmit more frequently, with more power and different types of packets than those of a normal PU.
In [10], the authors use packet traffic to model sen-sor behavior. Packet train size and packet train length, inter-packet times, and payload size are used to character-ize the packet traffic. They apply these profiles to detect anomalies, such as sinkhole attacks.
In [11], another approach is used to monitor the node’s behavior. In this work, a group of capable nodes form the attack detection system (ADS). These nodes analyze the packets transmitted among their neighbors. The rea-son for limiting the ADS to only a few nodes is that a continuously monitoring node consumes much more energy than a normal one. Along the same lines, in [12], some monitor nodes sniff the communications in order to detect anomalies. They base their decisions on some principles of WSNs such as message symmetry or node similarity.
Finally, in [13], the nodes create neighbor profiles according to the sequence of received packets. The attack is detected using the distance between sequences. The dis-tance is calculated by the number of differences between them.
In conclusion, the previous works use traffic moni-toring to create a behavior model of the network. In this work, we can use other parameters such as power transmission or time between packets to detect behav-ior anomalies in CWSNs. To the best of our knowledge, this is the first time that the anomaly detection approach is applied for PUE attacks on CWSNs. Other cognitive features such as spectrum sensing and learning make it possible to implement the algorithms. The advantage of these parameters is that they can be applied to more flexi-ble networks or independently of the application. Another advantage over the previous works is the use of collabo-ration between nodes. The final decision in the detection of anomalies is collaborative. The more nodes collabo-rating on the decisions, the better are the PUE detection results.
4 Assumptions and CWSN scenario
In our model, a CWSN consists of a setS= s1,s2,. . .,sn ofncognitive wireless sensor nodes with different roles. Each node has a certain transmission range. Their loca-tion and their radio parameters are unknown. However, we assume that the nodes have a stationary behavior that allows learning based on spectrum sensing.
We assume a different behavior for the SUs and PUs in CWSNs because of the nature of these networks. For example, CWSNs usually operate on ISM bands, where anyone can transmit without a license. Because of this feature, the definition of PUs and SUs should be differ-ent. For this CWSN definition, the differences between PUs and SUs are based on the priority of their func-tionality. For example, a fire sensor would have more priority than a temperature sensor. While PUs take pref-erence because they are responsible for critical sensors and information, SUs only send the information when the channel is free. In a common CWSN, the number of nodes can usually vary between 5 and 200. For our study, we assume that networks with more than 200 nodes are not common.
In our scenario, spectrum sensing is carried out by mul-tiple wireless modules contained in all the network nodes. More specifically, these interfaces work on the ISM bands (2.4 GHz, 868 MHz, and 433 MHz). All of them can extract information from the environment: received signal power, noise power, or time between packets. The infor-mation is processed, stored, and shared according to the implemented algorithm. We further assume the existence of a virtual control channel (VCC) for sharing this infor-mation, with no extra overhead over regular cognitive communications.
• Selfish PUE attacks. In this attack, the attacker’s objective is to maximize its own spectrum usage.
• Malicious PUE attacks. The objective of this attack is to obstruct SUs from accessing the spectrum.
Our PUE model is described by the following set of assumptions:
1. A PUE attacker has a similar hardware and radio interface characteristics to those of the rest of nodes. 2. The network does not have any information about
the position of the PUE attacker or its strategy. 3. The PUE attacker and the PUs cannot have exactly
the same radio behavior.
As we explain in Section 3, we assume that regardless of the kind of PUE attack, the malicious node has to change its behavior. If the attacker is a selfish PUE, the malicious node has to change its power transmission or transmis-sion rate in order to acquire more spectrum time. In this case, the SUs receive new information that changes the perception of the spectrum usage. In the other case, if the attacker is a malicious PUE, the attacker node has to change the behavior in order to affect the transmission of the SUs. An example of this situation is a home secu-rity sensor network where a malicious PU is captured and used to attack the network. If it tries to perturb the cor-rect behavior of the network, it should change the radio parameters to interfere with PUs and SUs. If the attacker continues to have the same behavior since the creation of the network and if it uses exactly the same radio param-eters, attack detection becomes almost impossible using either behavior learning or any other method. Moreover, in this situation, the network behavior is not affected, so the attack has no effect.
5 System architecture
The system architecture presented uses collaboration in order to achieve the anomaly detection goal. Its main characteristics are distributed learning and collaboration on final decisions.
5.1 Spectrum sensing and learning
Spectrum sensing is the first module of the entire chain in the system. All the nodes in the system sense the radio spectrum and analyze the data to create a precise profile of each node. Spectrum sensing in this system is performed by detecting the signal level on each channel. Each node is aware of the spectrum occupancy in its near range. More-over, the nodes are able to detect all the valid packets over a reception power threshold. Despite the fact that the packets are usually sent to a specific node, the rest of the nodes in a sensing stage can capture them and extract information from them such as the source, the sink, and the time stamp.
Cognitive wireless nodes have some constraints that limit the system such as low computational resources, low memory, or limited batteries. This makes it impos-sible to create complex detection algorithms or to store large databases. In order to overcome these limitations, this work proposes two non-parametric algorithms: the cumulative sum (CUSUM) and data clustering algorithms [14]. Both approaches are implemented in order to detect changes in some spectrum sensing features. The CUSUM is an algorithm used in WSNs in order to detect changes in the mean value of a stochastic process. The advantages of this algorithm in CWSNs are its low computational requirements and its lack of assumptions of any previous knowledge about the PUE attack. As it has been explained in Section 3, if the scenario is limited, the sensor nodes usually have a stationary behavior. Moreover, the attack happens at an unknown time. These are the reasons why the CUSUM algorithm is applicable in this approach.
In this case, some key features, such as received power, are necessary to model the nodes’ behavior. A good approach is to save the key parameters that define the fea-ture. In this work, the number of measures, the average, and the variance are stored in each node repository. The average (Xn) and the variance (Sn) are calculated using
only their previous values and their current sample as shown in Equations 1, 2, and 3.
Xn=
n is the average of the squared values. So, each
node creates a table with the following data:
{NodeID,n,Xn,E2n,S2n}. (4)
Throughout the learning stage, the nodes update and refine these values which will be used as the base in the anomaly detection algorithm.
The second algorithm is called data clustering. The learning process consists of finding groups with similar data points. Firstly, the data points are clustered. Then, these clusters are used to detect anomalies.
The data clustering learning phase can be summarized in the following steps:
1. Sense the spectrum and obtain a new data sample:Di
2. NormalizeDi
3. Find the nearest cluster which satisfiesd<Rj, where
Rjis the cluster’s radius andd is the distance
between the data and the cluster centroid (a) If (d<Rj), add the data to the cluster and
update the cluster parameters (b) If (d>Rj), create a new cluster
The advantage of the data clustering approach is that it considers multiple features as a whole, whereas CUSUM uses the features in isolation.
5.2 Anomaly detection
When the system has captured enough packets, the nodes are ready to compare the created profiles against the new samples. The optimizer applies the non-parametric algorithm and sends anomaly warnings to other nodes through the VCC. The learning time adopted for each algorithm has been modified in order to check the speed of the algorithms. Depending on the learning time, the system has more or less packets in order to generate the profiles.
In the CUSUM algorithm, the comparison between new samples and the profile is performed according to the Euclidean distance. If the distance is lower than a number of standard deviations, the sample is considered a normal value. However, if the sample is outside the allowed range, the optimizer sends an anomaly warning. This allows the algorithm configuration to use either high threshold val-ues, with a low false positive rate and a slow detection, or low threshold values that imply more false positives but faster detection. In this work, the threshold varies between 1 and 2 standard deviations.
The data clustering algorithm compares the data obtained with the set of clusters. If the data sample fits in some cluster, it will be marked as normal. Otherwise, the data will be labeled as an anomaly.
In this work, the optimizer filters the warnings and only marks them as a PUE attack when the anomaly contin-ues for a configurable time. Each node has a window time in order to manage the spurious effects of the channel and to minimize the false alarms. This window time is configurable depending on the PU transmission rate. If a node detects a configurable number of anomalies in this time, it generates a node-level alarm in the system by sending a message through the VCC channel. When the window time is running out, all the anomalies are removed. The specific values of these parameters are pre-sented in Section 6.2. The window time improves the results, reducing the random effects of the channel.
5.3 Collaboration
The previous chapters describe how the network nodes can collect information from the spectrum as a key fea-ture in cognitive solutions. The stored information used by an isolated node could be useful for a particular opti-mization, but if the final goal of the network is the general optimization of a parameter, in this case security, collabo-rative strategies are essential. Collaboration strategies are a common solution in other cognitive fields like spec-trum sensing and also in security scenarios, such as PUE detection. The next section shows how the introduction of collaborative detection significantly improves the results.
In this work, the SUs collaborate by sharing informa-tion about the detected anomalies. This informainforma-tion can be results from spectrum sensing or anomalies detected by a single node. When one node marks another as a pos-sible PUE attacker, it sends a message to the rest of the SUs. Only when a custom number of nodes have labeled the node as a possible PUE attacker will the whole system marks the node as an attacker.
This collaborative method creates a two-level alarm sys-tem: the node-level alarm and the network alarm. The node-level alarm is sent when an isolate node detects the maximum allowable number of alarms. On the other hand, the network alarm is transmitted when a config-urable number of collaborative nodes sends a node-level alarm for the same attacker. The collaborative method improves the system because it eliminates the possi-ble mistakes derived from the nodes’ location and, for instance, the variations in the received power and the number of packets.
The collaborative system in this work is distributed over the SUs. Each SU has its spectrum sensing data and with this information creates its node-level alarms. The collab-oration in this work includes the reception of these alarms through the ideal VCC channel, described in Section 6.1, and it is use to confirm if a node has an anomalous behavior confirmed by more than one SU.
6 Experimental results
6.1 Simulation tools
The proposed countermeasures have been tested on a CWSN simulator [15]. This simulator has been developed as an enhanced version of the well-known Castalia sim-ulator. The structure of Castalia has been improved by providing it with cognitive features. The CWSN simula-tor is responsible for scenario definition, spectrum state simulation, and communication between nodes from the physical to the application layer. It supports the cognitive features by means of the cognitive module, which has the following parts:
made, or current state. The kind of information stored depends on the context and the requirements of the system.
• Access. This module lets a local repository access the repository of remote nodes. At the same time, it exports a subset of the local repository to remote nodes.
• Policy. This module enforces the requirements for the global system depending on several factors. In this paper, security is the policy being optimized.
• Optimizer. This block processes the repository information bearing in mind the requirements imposed by the policy module. Decisions regarding the behavior of the local node are the results of processing. They are stored in the repository and evaluated by the executor.
• Executor. This module performs the decisions made by the optimizer.
Furthermore, the simulator also provides the VCC, a new method for sharing cognitive information among the CR modules of the nodes. CR modules can access exported information from remote repositories through this channel. It allows CR modules to be aware of their surroundings and even of the whole network. In this work, the VCC is completely ideal, and it does not take into account any delay or loss as a normal channel does.
The Castalia simulator channel model is an important aspect for these experiments. The channel model of this simulator is realistic, including the average path loss, the time variability, and random shadowing [16]. This vari-ability in the channel conditions contributes negatively to the detection of anomalies, but it represents real condi-tions. Finally, the packet reception probability is imple-mented in the channel model in order to take into account the signal-to-noise ratio.
6.2 Simulation experiments
The attacker is implemented as a SU that changes its behavior in a precise moment acting like a PU. The attacker will try to adapt all its radio parameters according to the PU’s behavior. Some of them, such as modulation, encoding, or carrier frequency, probably will be exactly like those of the PU for two reasons. Firstly, the attackers and the PUs usually have the same hardware characteris-tics; therefore, the attackers can imitate the PU. Secondly, the attackers do not need to change these parameters to reach their possible goals, namely to use more spec-trum, to transmit information to other destinations, or to obstruct SU transmissions.
Accordingly, it is reasonable to restrict the parame-ters that the attackers will change to transmitted power and occupied spectrum bandwidth. In this work, the
received power and the time between packets have been used to detect anomalies, like a PUE attack on the network.
By setting the transmitted power and the transmission rate of the attacker to values similar to those used by a real PU, we can check how precise the algorithm is in detecting this kind of attack. In order to test the presented solu-tion, when an attacker changes its behavior, the deviation in transmitted power is 1 dBm constantly and the trans-mission rate varies 1 packet/s in comparison to those of a normal PU. Even with this small change, the system has demonstrated to be very efficient in detecting anomalies. This assumption tries to simulate the worst case, where the PUs and the PUE attacker radio parameters are very close. In a real situation, if the attacker is a selfish PUE, it will try to transmit with the highest possible power in order to acquire the spectrum for itself. If the attacker is a malicious PUE, it will try to transmit with the highest possible transmission rate in order to affect the SU com-munications. Therefore, although our assumption could be a not entirely real situation, it is the worst case and the best scenario in order to test the sensibility of our algorithms. In a real case, where the differences between the attacker and the rest of the nodes will be larger, the algorithm could be adapted in order to reduce the false positive rate.
Several simulations have been executed in the simulator to extract results and to draw conclusions from the work. The scenarios have some common characteristics.
Each scenario has been run 100 times in order to add randomness. The scenario area is a 30 m×30 m square. The complete simulation time is 300 s. The number of nodes in the simulation varies from 50 to 200, including one server, three PUs, and a variable number of attackers. The learning stage covers the first 100 s in the CUSUM case and the first 60 s in the data clustering algorithm. The SUs and PUs send information to the sink, but the SUs only send the information when the channel is not being used by any PU. The location of the nodes is uniform. This improves the testing scenarios. The Castalia simu-lator channel model is used. This includes path loss and shadowing. The PUs’ packet transmission is 2 packets/s, and their transmission power is−1 dBm in all cases. The PUE attackers’ packet rate is 2 packets/s in the CUSUM algorithm and 4 packets/s in the clustering algorithm. The transmission power is 0 dBm. The attacks start between 100 and 200 s, depending on the scenario. The maximum node-level alarm is 5. Finally, the window time for clear-ing the alarms is 5 s in the CUSUM algorithm and 2 s in the clustering algorithm.
Figure 1PUE detection results with 50 nodes using CUSUM algorithm.Results of the simulations with the CUSUM algorithm and 50 nodes in the network.
6.3 Results and discussion
In Figures 1, 2, 3, where the PUE attack is simulated, the results of the CUSUM algorithm are presented. The system has shown a very good behavior in attack detec-tion, with a detection rate of over 99% in all simulations.
However, for some combinations of parameters, some normal nodes are detected as attackers. In Figure 1, we can see the results of a simulation with 50 nodes, includ-ing 1 PUE attacker, 3 PUs, 1 sink, and 45 SUs. In this situation, the decisions made individually by each node
Figure 3False positives in a multiple PUE attack using CUSUM algorithm.Multiple attack against the CUSUM algorithm.
are complemented by the collaboration among them. Each line represents the same scenario where the percentage of SUs that collaborate on detection is variable. Thex-axis represents the number of standard deviations that a sens-ing power measure can deviate from the learnsens-ing average to be considered as a normal value. Finally, the y-axis represents the false positive percentage.
As we can see, the percentage of collaborative nodes is essential in PUE attack detection. For a percentage of around 20 of collaborating nodes, the results are very good, with a false positive rate of under 10% using a
margin of 1 standard deviation for anomaly warnings regarding the average in the profile. If we increase this parameter to 1.3, the results are very satisfactory with false positive and false negative rates near 0%.
Figure 2 shows another scenario with worse conditions than the previous one. In this case, the nodes send lower quality information to the other nodes than in the previ-ous scenario. This is because the node’s optimizer does not filter the anomalies, as Section 5.2 explains, and sends too many anomaly warnings through the VCC. However, if the margin of standard deviations is increased to 1.5 and
Figure 5False positives using data clustering.Results of the simulations with the clustering algorithm and 50 nodes in the network.
the number of collaborative nodes is over 30%, the results are good enough.
However, if collaboration between nodes is eliminated and the filter in the nodes is improved, the system shows poor results. The system is not capable of discriminating between the PUE attackers and normal behavior.
Another interesting result can be seen in Figure 3. In this figure, the behavior of the system during a multiple PUE attack can be observed, where ten malicious nodes attack the system after the learning time. In this case, where 25% of the nodes are attackers, the system behavior gets worse. But, even in this case, if the number of collaborative nodes is over 20%, the results are satisfactory.
The results show that the most important parameter for improving PUE attack detection is the number of
collaborative nodes. Other parameters, such as the appli-cation algorithm or the filter and the margin to mark data as anomalous, also affect the results but to a lesser extent. The same analysis has been carried out taking into account the bandwidth occupied by the nodes instead of the received power. In this case, the results are not good enough. The reason for the poor results is the behavior of the secondary users. As we have explained before, the sec-ondary nodes only send packets when the channel is free, so the occupied bandwidth has a greater variance than that obtained in the power detection-based scenarios. The PUE attack has been impossible to detect with good preci-sion using the occupied bandwidth. This only means that the presented algorithm does not work with our definition of the SUs.
Figure 7False positives for different learning times in CUSUM.Results for different learning times in CUSUM algorithm.
The data clustering algorithm provide a solution to the problem of using multiple features at the same time. Com-bining two features, the power received and the time between packets, the data clustering algorithm aims to detect the PUE attack with a lower false positive rate. Figures 4, 5, 6 summarize the results obtained with this approach. The simulations represent the same scenario as the one of the CUSUM algorithm. The percentage of col-laborative nodes is the same, and the rate of false positives is the parameter presented. However, in the data cluster-ing algorithm, the variable parameter is the initial cluster radius. These values range from 0.1 to 1 over the normal-ized value of the centroid. This parameter directly affects the false positive rate as we can see in Figure 4. The smaller the radius is, the greater the demand for grouping data becomes.
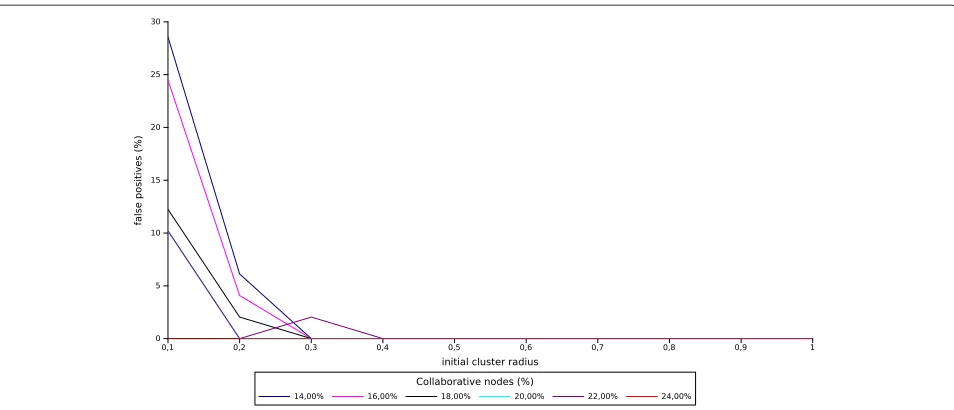
As we can see in Figure 5, the algorithm obtains satis-factory results when the initial radius is higher than 0.3. These results have been obtained simulating multiple sce-narios and setups. The number of collaborating nodes is also important in the data clustering algorithm but to a lesser degree than in the CUSUM case. Here, with only 14% of the SUs collaborating, the results are acceptable.
A new scenario with ten PUE attackers is presented in Figure 6 in order to test the second algorithm in a more complex situation. Here, 20% of the network nodes are malicious. The results are a little bit worse than in the pre-vious scenario but are really good for a radius greater than 0.3. In this situation, the false positive rate is under 2%.
Both algorithms, CUSUM and data clustering, have demonstrated the ability to detect anomalies caused by PUE attacks. In the previous figures, the optimal
Figure 9PUE detection results in a network with 200 nodes using CUSUM algorithm.To test the scalability of the CUSUM algorithm in a network with 200 nodes.
parameters have been presented. Following these results, the next section shows a comparison between both algo-rithms in terms of learning and detection time, scalability, use of resources, and scenario dependency.
7 Comparison
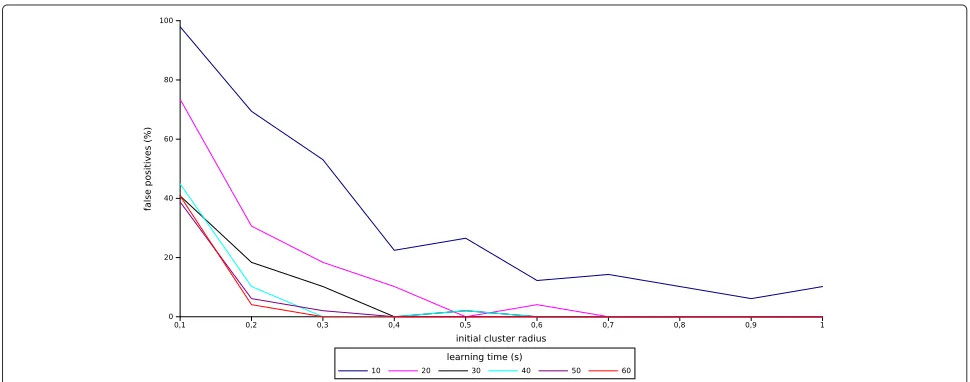
Figures 7 and 8 represent the results for multiple sce-narios with a variable learning time. As we can see, the CUSUM algorithm obtains bad results for any simulated learning time between 10 and 60 s. As the previous section showed, the CUSUM algorithm obtains good results from 100 s onward. Meanwhile, the data clustering approach starts to obtain good results from 30 s onward. This indi-cates that the data clustering approach is best suited for
dynamic networks in which the learning time can be a critical feature.
Detection time is another important characteristic. This is the interval between the beginning of the attack and the warning emission. Here, the simplicity of the CUSUM algorithm makes it faster. The time needed to detect the anomaly is between 0.5 and 1 s. However, the data clus-tering algorithm takes from 3 to 5 s. The results presented here do not include the delay for the collaboration. How-ever, this delay can be ignored if we take into account two factors: the ideal implementation of the VCC channel and the redundancy of the WSNs. In these simulations, more than 50 nodes are presented in a small area of 30 m×30 m. This indicates that each sensor detects almost the same
packets and, for instance, they transmit the same alarms at a similar time. However, collaboration continues being necessary in order to eliminate misleading data.
In order to prove the smooth operation of the system on larger networks, we have simulated a new scenario with 200 nodes. Figure 9 shows the results for the CUSUM algorithm. If the percentage of collaborating nodes is the same, the system still differentiates the PUE attack in almost every simulation, but the results become slightly worse. This is because more nodes in the same scenario space can produce more anomalies such as collisions, interference, higher noise level, or retransmissions.
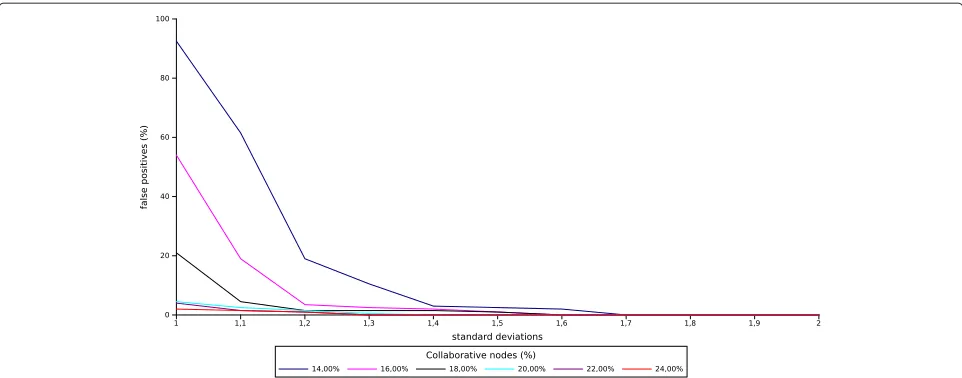
The main difference in the data clustering scenario is the independence of the results from the number of collabo-rating nodes (Figure 10). The false positives rate is under 2% for most setups.
The comparison between CUSUM and data cluster-ing in terms of resources is very clear. In this case, the CUSUM approach needs less memory and computational resources. It saves just one table with only five parameters that represent the transmissions of each node. However, the data clustering algorithm needs the same table and an additional one with the cluster information. Each row in the table represents a cluster with its centroid, its radius, and the number of nodes inside it. The learning and detecting stages also need more computational resources in order to implement the algorithm. For these reasons, the CUSUM algorithm is recommended for power saving applications or extremely simple nodes.
Finally, as a general conclusion, the CUSUM algorithm performance considerably depends on the simulated sce-nario and the parameters applied to it, such as learning time and number of attackers. However, the clustering approach maintains a good stable performance in most scenarios. Therefore, if the limitations or requirements in terms of resources are not critical, the data clustering algorithm is recommended.
8 Conclusions
In this article, a new approach for detecting PUE attacks on CWSNs has been described based on anomaly detec-tion and cognitive features such as sensing, learning, and collaboration. A cognitive simulator has been used to develop the scenarios that prove that collaboration is essential for a good anomaly detection. The results have been presented in the figures shown in Section 6.
Different layers of the cognitive architecture implement the tasks needed to achieve the final objective: PUE attack detection. Cognitive nodes sense the spectrum and cre-ate neighbor profiles in order to model their behavior. The information stored on the repository module is used to warn other nodes about anomalous data. The optimizer module is responsible for filtering the information and collaborating with other nodes.
If the collaborative nodes are over 20% of the total, the PUE attack detection has satisfactory results, with 99% of attacks being detected and a false positive rate near 0%, independently of the number of nodes in the scenario.
Two algorithms have been implemented in the CWSN. CUSUM is the simplest one, using less resources. How-ever, data clustering is more suitable for dynamic or com-plex scenarios. Both have demonstrated to be valid in order to detect the PUE attack anomalies.
Competing interests
The authors declare that they have no competing interests.
Received: 30 April 2013 Accepted: 5 August 2013 Published: 27 August 2013
References
1. J Huang, G Xing, G Zhou, R Zhou, Beyond co-existence: exploiting WiFi white space for Zigbee performance assurance, in18th IEEE International Conference on Network Protocols (ICNP), 2010, (Kyoto, 5–8 October 2010), pp. 305–314
2. R Chen, JM Park, Ensuring trustworthy spectrum sensing in cognitive radio networks, in1st IEEE Workshop on Networking Technologies for Software Defined Radio Networks, SDR ’06, (Reston, 25 September 2006), pp. 110–119
3. R Chen, JM Park, J Reed, Defense against primary user emulation attacks in cognitive radio networks. Selected Areas Commun., IEEE J. 26, 25–37 (2008)
4. Z Chen, T Cooklev, C Chen, C Pomalaza-Raez, Modeling primary user emulation attacks and defenses in cognitive radio networks, inIEEE 28th International Performance Computing and Communications Conference (IPCCC), 2009, (Scottsdale, 14–16 December 2009), pp. 208–215 5. Z Jin, S Anand, K Subbalakshmi, Detecting primary user emulation attacks
in dynamic spectrum access networks, inIEEE International Conference on Communications, 2009. ICC ’09, (Dresden, 14–18 June 2009), pp. 1–5 6. Z Yuan, D Niyato, H Li, Z Han, Defense against primary user emulation
attacks using belief propagation of location information in cognitive radio networks, inIEEE Wireless Communications and Networking Conference (WCNC), 2011, (Cancun, 28–31 March 2011), pp. 599–604 7. L Huang, L Xie, H Yu, W Wang, Y Yao, Anti-PUE attack based on joint
position verification in cognitive radio networks, inInternational Conference on Communications and Mobile Computing (CMC), 2010, Volume 2, (Shenzhen, 12–14 April 2010), pp. 169–173
8. C Zhao, W Wang, L Huang, Y Yao, Anti-PUE attack base on the transmitter fingerprint identification in cognitive radio, in5th International Conference on Wireless Communications, Networking and Mobile Computing, 2009. WiCom ’09, (Beijing, 24–26 September 2009), pp. 1–5
9. D Hao, K Sakurai, A differential game approach to mitigating primary user emulation attacks in cognitive radio networks, inIEEE 26th International Conference on Advanced Information Networking and Applications, 2012, (Fukuoka-shi, 26–29 March 2012), pp. 495–502
10. Q Wang, Packet traffic: a good data source for wireless sensor network modeling and anomaly detection. Netw., IEEE.25(3), 15–21 (2011) 11. Y Liu, K Han, Behavior-based attack detection and reporting in wireless
sensor networks, inThird International Symposium on Electronic Commerce and Security (ISECS), 2010, (Guangzhou, 29–31 July 2010), pp. 209–212 12. F Wang, J Gao, Behavior monitoring framework in large-scale wireless sensor networks, inIEEE 29th International Performance Computing and Communications Conference (IPCCC), 2010, (Albuquerque, 9–11 December 2010), pp. 138–145
13. Q Wang, T Zhang, Detecting anomaly node behavior in wireless sensor networks, in21st International Conference on Advanced Information Networking and Applications Workshops, 2007, AINAW ’07, Volume 1, (Niagara Falls, Ontario, 21–23 May 2007), pp. 451–456
15. J Blesa, E Romero, JC Vallejo, D Villanueva, A Araujo, A cognitive simulator for wireless sensor networks, in5th International Symposium of Ubiquitous Computing and Ambient Intelligence, 2011, UCAMI 2011, (Riviera Maya, 6–9 December 2011)
16. D Pediaditakis, Y Tselishchev, A Boulis, Performance and scalability evaluation of the Castalia wireless sensor network simulator, in
Proceedings of the 3rd International ICST Conference on Simulation Tools and Techniques, SIMUTools ‘10, ICST, (Torremolinos, March 2010), pp. 1–6. http://dx.doi.org/10.4108/ICST.SIMUTOOLS2010.8727
doi:10.1186/1687-1499-2013-215
Cite this article as:Blesa et al.:PUE attack detection in CWSNs using
anomaly detection techniques.EURASIP Journal on Wireless Communications and Networking20132013:215.
Submit your manuscript to a
journal and benefi t from:
7 Convenient online submission 7 Rigorous peer review
7 Immediate publication on acceptance 7 Open access: articles freely available online 7 High visibility within the fi eld
7 Retaining the copyright to your article