R E S E A R C H
Open Access
RSSD-based 3-D localization of an
unknown radio transmitter using weighted
least square and factor graph
Liyang Zhang, Taihang Du
*and Chundong Jiang
Abstract
Realizing accurate detection of an unknown radio transmitter (URT) has become a challenging problem due to its unknown parameter information. A method based on received signal strength difference (RSSD) fingerprint positioning technique and using factor graph (FG) for 2-D scenario has been developed. However, the URT positioning under 3-D scenario is more difficult with the large number of unknown parameters and has greater practical significance. In addition, the previous RSSD-based FG model is not accurate enough to express the
relationship between the RSSD and corresponding location coordinates since the RSSD variances of reference points are different in practice. This paper proposes a more accurate 3-D FG model to reduce the influence of difference of RSSD measurement variances on positioning accuracy effectively by utilizing weighted least square (WLS). With the proposed RSSD-based 3-D WLSFG model and sum-product rule, positioning process of the proposed 3-D
RSSD-WLSFG algorithm is derived. To verify the feasibility of the proposed method, we also explores the effects of different signal receiver numbers and grid distances on positioning accuracy. The simulation experiment results show that the proposed algorithm can obtain the best positioning performance compared with the conventional K nearest neighbor (KNN) algorithm and RSSD-FG algorithm under different grid distances and signal receiver numbers.
Keywords: Radio transmitter, 3-D Position location, Received signal strength (RSSD), Weighted least square (WLS), Factor graph (FG)
1 Introduction
Currently, a variety of radio signals have been widely used and existed in our daily life. To strengthen the monitor-ing of illegal radio spectrum resources, protect the rights and interests of legitimate users, and combat the occupa-tion of illegal signal resources are related to the security and privacy of the nation, enterprises and individuals. A challenging issue is that realizing the accurate localization of an unknown radio transmitter (URT) is an important work in radio management.
A variety of the positioning techniques for the URT have been developed based on measurements obtained from signal receiver, which is also denoted as access point (AP). The measurements mainly include time of arrival (TOA) [1], time difference of arrival (TDOA) [2], frequency
*Correspondence:[email protected]
School of Artificial Intelligence, Hebei University of Technology, Hongqiao, Tianjin 300130, China
different of arrival (FDOA) [3], received signal strength (RSS) [4, 5], angle of arrival (AOA) [6], and hybrid of them [7–9]. Among all the measurement parameters, the RSS-based positioning techniques are widely used for the advantages of no extra antenna arrays, no time synchro-nization limitation, and low cost. A large number of RSS-based techniques have been developed in recent years. Due to the RSS information that can be converted to dis-tance estimates for constructing a set of linear equations, a well-known method was proposed by utilizing least square (LS) algorithm to estimate the optimal location of the target by minimizing the sum of squares of geo-metric distance errors between the target and AP [10]. Since the distance between the target and each AP is dif-ferent, the estimated geometric distance error is not the same when using the channel model to convert RSS to geometric distance. In order to improve the robustness to the errors in the estimation of the geometric distance, weighted least squares (WLS) estimators were proposed
in [11, 12]. However, due to serious signal attenuation and multi-path effect, the channel model used to convert RSS and geometric distance is not enough to accurately reflect the real distance between the target and AP in the actual scenario. Therefore, the positioning accuracy will be seriously affected. The RSS-based fingerprint posi-tioning technique does not require accurate signal prop-agation model and estimation of parameters such as the geometric distance between target and APs. The process of RSS-based fingerprint positioning method is mainly divided into two phases: the off-line training phase and the on-line positioning phase. In the off-line training phase, RSS measurements are collected from different access points (APs) deployed in the positioning area. Then, RSS and corresponding location coordinates construct off-line fingerprint database. In the on-line positioning phase, the positioning target location is estimated by collecting the real-time RSS measurements and matching the fin-gerprint database with appropriate positioning algorithm. Two typical RSS-based fingerprint positioning techniques are RADAR [13] and LANDMARC [14], which are based on K nearest neighbor (KNN) algorithm [15]. The basic principle of KNN approach is to calculate the location of positioning target by averaging locations of K reference points with the minimum RSS Euclidean distance found in the fingerprint database. But the techniques mentioned above do not fully take into account the stochastic prop-erties of measurement errors, and the Euclidian distance cannot reflect the geometric distance exactly. To solve this issue, the famous Maximum-likelihood (ML) [16] posi-tioning technique was proposed to process the measure-ment information in the form of probability. In this way, it not only directly reflects the stochastic properties of mea-surement information but also achieve higher accuracy compared with the deterministic positioning methods [17,18]. Nevertheless, the major problem of ML approach is hard to implement in practice because the ML cost function is highly nonlinear and contains multiple local minima and maxima [19]. Furthermore, ML-based algo-rithm is not feasible because of its high computational complexity.
Among all positioning techniques, the technique base on factor graph (FG) is famous for low computational complexity and high positioning accuracy [20]. Many kinds of FG positioning techniques based on the vari-ous measurements described above have been developed. The TOA-FG [21] technique used the signal propagation time between the radio transmitter and APs to estimate the distance, but this requires the clocks of both to be synchronous. In order to be free from the limitation of clock synchronization between the radio transmitter and APs, TDOA-FG method was proposed in [22]. It should be noted that radio transmitter and APs also need to be synchronized with the clock of the reference node.
However, TOA-FG and TDOA-FG are both more suitable for line of sight (LOS) positioning scenario. The RSS-FG [23] technique overcomes the requirement of clock synchronization and establishes the mathematical rela-tionship between RSS measurement and corresponding location coordinates. Moreover, RSS information contains the result information caused by the influence of envi-ronment and device hardware, and it is also suitable for LOS and non-line of sight (NLOS) positioning environ-ment. Yet, the RSS-FG algorithm has been proved to be unable to achieve the localization of the URT, because both transmitting frequency and power of the URT are unknown. After that, a robust fingerprint database based on received signal strength difference (RSSD) was first proposed to eliminate the influence caused by the differ-ence between the testing devices and training devices in [24]. Besides, it also mitigates the influence of hardware variations between the testing devices and the training devices. Taking advantage of this characteristic of RSSD information, Aziz et al. [25] proposed an RSSD-FG tech-nique to realize the detection of an URT. However, the mathematical model established in RSSD-FG algorithm is not accurate enough, because the model considers that the RSSD measurement variance of each selected ref-erence point is the same and ignores the diffref-erence of the RSS measurement variances among the selected ref-erence points. To attain higher positioning accuracy, a RSSD-AOA FG method with simulation was proposed in [26]. However, AOA measurements of the URT is easily affected by NLOS positioning scenario in practice.
The above positioning methods based on factor graph are all focus on 2-D scenario. To the best of our knowl-edge, there is no existing research in the literature to realize the localization of an URT in 3-D scenario. In this paper, we combine the RSSD-based FG fingerprint posi-tioning technique and WLS method to propose a new 3-D RSSD-WLSFG algorithm, and it is considered to be an effective method for detecting an URT in 3-D space.
The following are the contributions of this paper: 1) A more accurate RSSD-based 3-D WLSFG model was first constructed by combining the FG technique with WLS for an URT, which can effectively reduce the impact of differences in variance of RSSD at different reference points on positioning accuracy.
2) On the basis of the proposed model, a new 3-D RSSD-WLSFG algorithm was derived by using sum-product theorem and soft-information calculation.
3) In addition, we explored the effects of different grid distances and AP numbers on positioning accuracy and conducted simulation and experimental to verify our pro-posed approach.
Section 5, the results and discussion of simulation and experiment are presented respectively. Section6presents the conclusion and future directions for our research.
2 The principle and system model
2.1 Factor graph and sum-product algorithm
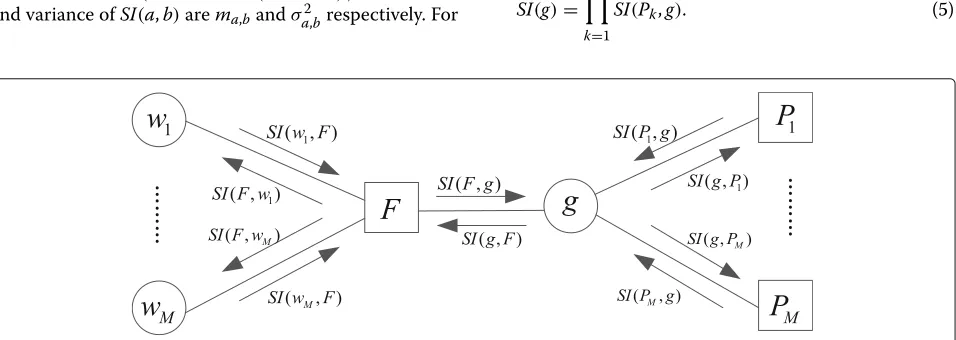
In this subsection, we introduce the spirit of factor graph and sum-product principle at first. The main idea of factor graph and sum-product algorithm is briefly summarized as in [27]. A factor graph is a bidirectional graph that describes how to decompose a multivariate global func-tion into the product of multiple local funcfunc-tions. On the basis of the factor graph, sum-product algorithm is devel-oped to calculate the edge distribution of global functions by soft-information transmission in the corresponding graph model. In general, a factor graph model consists of the variable nodes (g,w1, ... ,wM) and factor nodes (F,P1, ... ,PM) as shown in Fig.1. The factor node represents the
local function node in related to variable nodes. Consid-ering the fragment of factor graphs shown in Fig.1, the factor nodes can be separated with joint distribution into groups. Here, the problem of calculating local functions is solved by using sum-product algorithm. The sum-product algorithm works by collecting the soft-information trans-mission of local function product along the path in the fac-tor graph. The soft-information transported between the variable nodes and factor nodes represents the stochastic properties of the associated variable nodes. With sev-eral iterative processes of soft-information transported between the variable nodes and factor nodes, the solution of variables to a problem expressed by a factor graph can be easily obtained.
In this paper, we denoteSI(a,b)being the soft informa-tion transported from node a to node b, which represents the statistical properties of the variable nodes and mea-surement errors in the form of a Gaussian probability density function
SI(a,b)∼N
ma,b,σa2,b
. The mean
and variance ofSI(a,b)arema,bandσa2,brespectively. For
example, the soft information transported fromgtoFcan be expressed by:
SI(g,F)=
M
k=1
SI(Pk,g), (1)
wherePk isk-th factor node. The product of some
inde-pendent Gaussian distributions is still a Gaussian distri-bution. The mean and variance ofSI(g,F)can be obtained by:
mg,F =σg2,F· M
k=1 mPk,g
σ2
Pk,g
(2)
and
σ2
g,F =1/ M
k=1 1
σ2
Pk,g
. (3)
The soft information transported from the factor node to a variable node can be calculated from the product of a local function associated with the factor node and all the soft information of the other variable nodes as:
SI(F,g)=
w1
...
wM
f(g,w1, ...,wM) M
k=1
SI(Pk,g)
dw1...dwM,
(4)
wheref(g,w1, ...,wM)is the local function of factor node
Fassociated with all the variable nodes.
With the above sum-product update rules of (1)–(4), the variable node can be estimated through all the soft-information conveyed by the corresponding factor nodes. Thus, we can calculate the whole soft information of g with this method as follows:
SI(g)=
M
k=1
SI(Pk,g). (5)
2.2 Positioning system
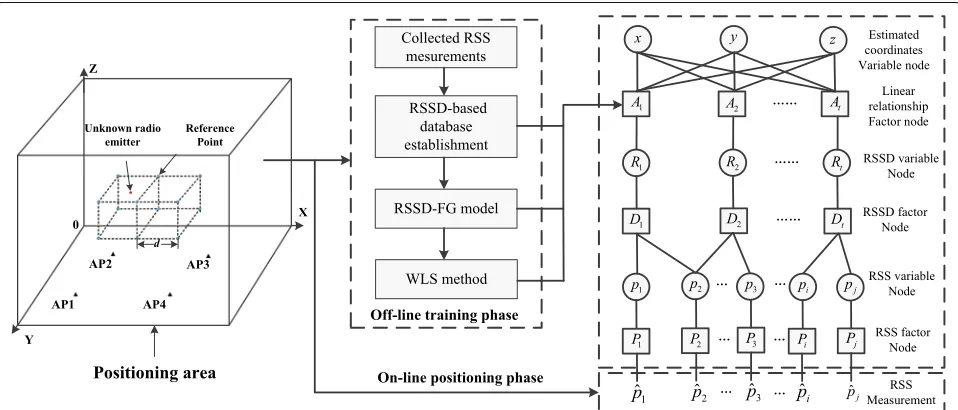
The proposed 3-D RSSD-based FG positioning system for a radio transmitter is described in Fig.2. First, we place APs in the positioning area to collect RSS measurements from the radio transmitter and the positioning area is divided into several cube sub-areas with equal side length. The vertex of the cube is denoted as the reference point, and the side of the cube is called grid distance represented by d. In the off-line training phase, A radio transmit-ter with a known fixed emission strength and frequency is used to traverse each reference point. Meanwhile, the RSSD measurements obtained from the sampling RSS and location coordinates of each reference point are recorded and stored to establish the fingerprint database. In our work, RSSD characteristic parameter is applied to adapt to the diversity of unknown radio emitters, since RSSD is not affected by the emission strength and frequency [28]. In this way, it greatly reduces the workload of RSS-based fingerprint positioning technique in construct-ing correspondconstruct-ing databases to match different targets. More importantly, RSS-based parameter cannot realize the localization of the URE. After that, the RSSD-FG model can be obtained as done in [25]. Combining the RSSD database and RSSD-FG model, we can obtain the proposed RSSD-based 3-D WLSFG model by using WLS method.
In the on-line positioning phase, real-time RSS mea-surements from the positioning target will be collected and used as the input values of the proposed RSSD-based 3-D WLSFG model. Finally, the estimated loca-tion of posiloca-tioning target can be calculated by the
sum-product algorithm and soft information transported back and forth in the model. The detailed process of our proposed algorithm will be introduced in the next section.
3 Proposed 3-D RSSD-WLSFG algorithm
3.1 RSSD-based 3-D WLSFG model
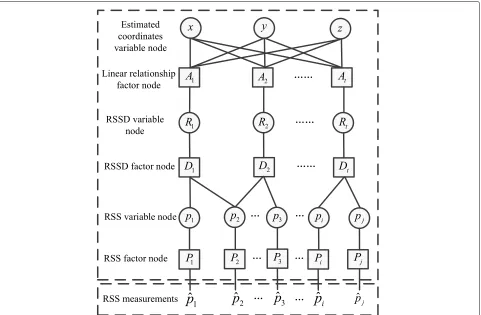
The proposed RSSD-based 3-D WLSFG model also con-sists two kinds of nodes as shown in Fig. 3, the factor nodes (A1,A2,At,D1,D2,Dt,P1,P2, Pi andPj) and the
variable nodes (p1,p2,pi,pj,R1,R2,Rt,x,yandz), where
i and j are the index number of AP (i = j and i,j = 1, 2, ...,N) and tis the index number of AP combination (t= 1, 2, ...,N). As shown in Fig.2, the AP combination is “ij= 12, 23, 34, 41”. First, RSS measurements of different APs are used as the input measurements (p1,p2, ... ,pi).
When an URT enters the positioning area, AP will collect RSS measurements and they can be expressed as:
pw,i=pw,i+ei, (6)
wherepw,i is the RSS error-free measurement of RSS in
units of watt (W) and it can be obtained by averaging a certain number of sampling measurements. The number of samples in this paper is set to 100.ei represents the
measurement error ofi-th AP in units of watt (W), and it can be expressed by zero-mean Gaussian distribution
ei∼N
0,σi2. In order to better reflect the local lin-earity characteristic of RSS, it is processed in logarithmic scale, wherepi = 10·log10
pw,i+ei
. The logarithmic RSS distribution is proved to be Gaussian approximation
Fig. 3Proposed RSSD-based 3-D WLSFG model. The model expresses the relationship betweenpand(x,y,z)in terms of variable nodes and factor nodes
[23]. Factor nodePiis to utilize the logarithmic RSS and
variance of RSS measurements to generate variable node pi with gaussian distribution
pi∼N
pi,σpi2
, where pi andσpi2 are the mean and variance of sampling
loga-rithmic RSS respectively. Factor nodeDt represents the
subtraction relationship of two different APs, and it can be expressed by:
Rt=pi−pj, (7)
where Rt represents the subtraction relationship of RSS
betweeni-th AP andj-th AP. Second, factor nodes trans-port the soft information from the variable nodes by using the simple local functions. Finally, the root variable nodes x and y combine with the soft information of all the connected factor nodes based on the sum-product algo-rithm. Thus, location of the URT will be estimated with a few iterative process among the source factor nodes and variable nodes.
As known from the log-normal shadowing model [29], RSS is related to the distance from AP. Thus, the relation-ship between the location coordinate(x,y,z)and logarith-mic RSSD (R) can formulate a linear equation, which can be expressed by:
kxx+kyy+kzz+krR=c, (8)
wherekx,ky,kz, andkrare the coefficients andcis a
non-zero constant usually set to one. Thus, we can utilize least square (LS) approach to obtain the coefficients of Eq. (8). In this paper, five reference points are selected by using pattern-recognition technique [23] and the positioning area consisted of these five reference points is defined as the sub-positioning area. Since the logarithmic RSSD and the location of the five reference points are known, five linear equations in matrix form fort-th AP combination are given by:
A·K=C, (9)
where
A=
⎡ ⎢ ⎢ ⎢ ⎢ ⎣
x1 y1 z1 Rt,1 x2 y2 z2 Rt,2 x3 y3 z3 Rt,3 x4
x5 y4 y5
z4 z5
Rt,4 Rt,5
⎤ ⎥ ⎥ ⎥ ⎥ ⎦,K=
⎡ ⎢ ⎢ ⎣
kx,t
ky,t
kz,t
kr,t
⎤ ⎥ ⎥ ⎦,C=
⎡ ⎢ ⎢ ⎢ ⎢ ⎣ 1 1 1 1 1
⎤ ⎥ ⎥ ⎥ ⎥ ⎦.
wherekx,t,ky,t,kz,tandkr,tare coefficients of the linear
equation corresponding to i-th AP combination, (xs,ys)
(s=1, 2, 3, 4, 5) is the location coordinate of s-th ref-erence point, andRt,s is the mean logarithmic RSSD of
s-th reference point fromt-th AP combination. Here, the mean logarithmic RSSD can be obtained by averaging 100 sampling logarithmic RSSD. According to Eq. (10), the coefficients can be calculated byK=AT·A−1·AT·C. Thus, the relationship between the location coordinates
(x,y,z)and mean logarithmic RSSDRtoft-th AP
com-bination within the selected sub-positioning area can be expressed as:
kx,tx+ky,ty+kz,tz+kr,tRt=1. (11)
Actually, the variances of RSSD measurements at dif-ferent reference points are various due to the chang-ing scenario, multi-path effect, measurchang-ing position, etc. Therefore, we utilize LS method to obtain a more accu-rate linear relationship between location coordinates and logarithmic RSSD, since we have acquired the relationship between the coordinates (xs,ys,zs) ofs-th reference point
and mean logarithmic RSSDRt,s
ofs-th reference point fromt-th AP combination, which is represented by:
kx,txs+ky,tys+kz,tzs+kr,tRt,s=1. (12)
Next, according to (12), we use (xs,ys,zs) to calculate the
estimated mean logarithmic RSSDRt,s
ofs-th reference point fromt-th AP combination and the stochastic error (Et,s) between the measured value and estimated value is
given by:
Et,s=Rt,s−R
t,s, (13)
Thus, the approximate estimator of the stochastic error is obtained by using LS method and construct the weighted matrix (W) given by:
W=DDT = equation can be obtained by:
K =
is the coefficient matrix of the new linear equation. Now that the sub-positioning area of the URT has been determined,Rtcan be replaced
by the variable nodeRtof target logarithmic RSSD. Thus,
the expected relationship between the location coordi-nates variable nodes(x,y,z) and RSSD variable nodeRt
within the choosing sub-positioning area is given by:
kx,tx+ky,ty+kr,tz+kr,tRt=1. (17)
The other linear equations corresponding to different AP combinations can also be obtained by using the same process above.
3.2 Soft-information calculation and iteration process
According to the sum-product algorithm, we introduces how to calculate soft information and deduce the iterative process of the proposed model in this subsection. The ini-tial soft information passing from variable nodesx,yand zto factor nodeAtshould be calculated at first. Utilizing
the sum-product rules, SI(x,At), SI(y,At), andSI(z,At)
At to variable nodex transporting the soft-information
mAt,x =
calculated with the similar manner. The soft-information transported from variable nodeRt to factor At is equal
to factor node Dt to variable node Rt, where mRt,At =
The factor nodesPiandPjdirectly transports the
soft-information to nodeDt, wherempi,Dt = mPi,pi,σpi2,Dt = σ2
Pi,pi and mpj,Dt = mPj,pj, σpj2,Dt = σPj2,pj, respectively.
According to (6),SI(Pi,pi) andSI(Pj,pj) can be directly
obtained. In the same way, the soft-information of other AP combinations can also be calculated. As mentioned above, all the soft information has been calculated with the sum-product algorithm and the entire iterative pro-cess will be repeated until the precise location of target is obtained. Finally, the soft information ofSI(x),SI(y), and
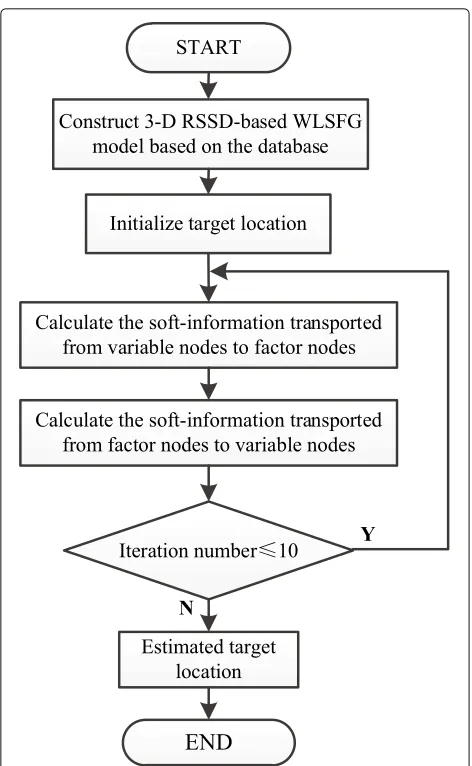
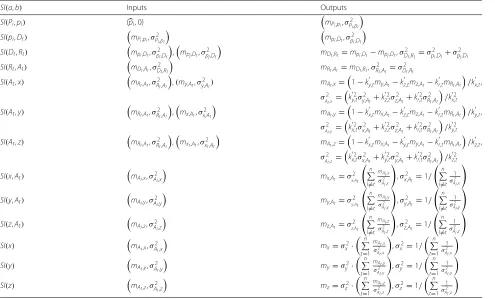
flow chart of the proposed algorithm. For better under-standing, we summarize the entire iteration process as shown in Table1. On the basis of the simulation experi-ence, the soft information can converge with 10 iterations. Although there is no mathematical proof of convergence in this paper, the simulation experiment results can prove it. This may be because the proposed algorithm takes the stochastic properties of measurement errors into account. Besides, the initialization of the target location does not have a critical impact on convergence and can be set to arbitrary value.
Fig. 4Flow chart of the proposed algorithm
4 Results and discussion
4.1 Simulation setup
To verify positioning performance of the proposed algo-rithm, computer simulations of different algorithms were conducted on the platform of MATLAB2014a. The sim-ulation scenario consists of 100 random target locations, four APs, and a positioning area of length (100m ), width (100m) and height (100m), respectively. Here, we chose a well-known and easily implemented logarithmic shadow model [29] to generate logarithmic RSS for random mea-surements, which is expressed by:
P(di,s)=P(d0)−10·α·log10
where di,s is the distance between s-th reference point
and i-th AP, d0 is the reference distance, P(d0) is the RSS in decibel at the reference d0, P(di,s) is the
Table 1The soft information processing of each node in Fig.3
measurement obeying zero-mean Gaussian distribution
χs∼N
0,σχ2s
. Then, the random RSS measure-ment pi,s can be considered as Gaussian distribution
multi-path effect, small-scale fading, system hardware influence, and measurement error,σχ2s is not the same at
different reference points. We denoteσχ21,σχ22, ...,σχ2s∈
σ2
χ, and the variable σχ2 is assumed as Gaussian distri-bution σχ2∼Nmχ,σh2. Here, we define that mχ is the mean variance of all reference points, where mχ = mance of proposed method,mχ varies from 5 to 30 dB andσh2is fixed at 5 dB in our simulation. The mimetic log-arithmic RSS of off-line database and on-line positioning target can be obtained with the method as in [23].
4.2 Performance comparison of different grid distances
and AP numbers
At first, we utilize four APs, 1.5-m grid distance, and one test target at (27, 45, 67)m to show the positioning tra-jectory of the proposed algorithm as shown in Fig. 5.
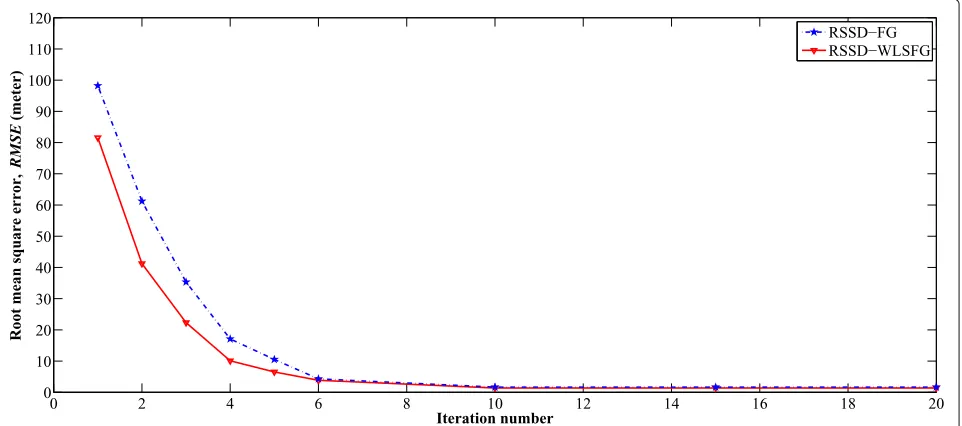
Location coordinates of four APs identified with black solid “” mark are (25, 25, 0)m, (75, 25, 0)m, (25, 75, 0)m and (75, 75, 0)m, respectively. It can be clearly seen from the result that with the increase of iteration number, the estimated location quickly approaches the real location of the target. Figure6shows the root mean square error (RMSE) of the proposed algorithm and RSSD-FG method. The 100 single test locations are randomly chosen from the positioning area. The RMSE rapidly decreases with the increasing number of the iterations. However, the pro-posed algorithm is more accurate than the conventional RSSD-FG algorithm. When iteration number approaches 10, the RMSE of RSSD-WLSFG tends to be stable at 1.47m. The proposed algorithm still has characteristic of fast convergence.
0 10 20
30 40 50
60 70 80
90 100
0 10 20 30 40 50 60 70 80 90 1000
10 20 30 40 50 60 70 80 90 100
X axis, (meter) Y axis, (meter)
Z axis, (meter)
AP Target RSSD−WLSFG
Fig. 5Localization trajectory of the proposed algorithm. The parameters are with 10 iterations, 1.5 m grid distance, target location at (27, 45, 67) m, target initialization at (1, 1, 1) m andmχ=20dB
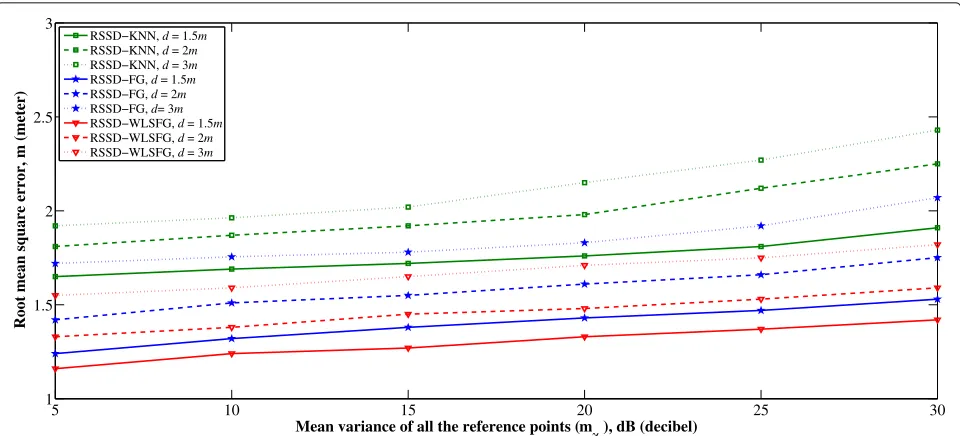
RSSD-FG algorithm and RSSD-KNN algorithm respec-tively in the case of three different grid distances. Taking mχ = 20 dB and 1.5 m grid distance as an example, the RMSE for each algorithm is 1.35 m for RSSD-WLSFG, 1.47 m for RSSD-FG, and 1.79 m for RSSD-KNN. From the trend of the curves, it can be concluded that the smaller the grid distance is, the higher positioning accu-racy is achieved. This is because the larger grid distance leads to fewer collected RSS information within the posi-tioning area, and it degrades the posiposi-tioning accuracy of
the proposed algorithm. Although the increasing mean variance of all reference points leads to increasing error in small scale, the higher signal strength will generally improve the positioning accuracy. These two indicators are not in the same category. The results verify that the proposed RSSD-WLSFG algorithm has the best position-ing performance under the condition of different mean variances.
Second, we explore the influence of different AP num-bers on the positioning accuracy of the three different
5 10 15 20 25 30 1
1.5 2 2.5 3
Mean variance of all the reference points (m
χ ), dB (decibel)
Root mean square error, m (meter)
RSSD−KNN, d = 1.5m
RSSD−KNN, d = 2m
RSSD−KNN, d = 3m
RSSD−FG, d = 1.5m
RSSD−FG, d = 2m
RSSD−FG, d= 3m
RSSD−WLSFG, d = 1.5m
RSSD−WLSFG, d = 2m
RSSD−WLSFG, d = 3m
Fig. 7RMSE comparison among RSSD-KNN, RSSD-FG, and proposed RSSD-WLSFG. The comparative grid distances are 1.5 m, 2 m, and 3 m respectively with four APs
algorithms. It is found that the RMSE becomes smaller as the number of APs increasing shown in Fig.8. Comparing with the RSSD-FG and RSSD-KNN algorithms, the RMSE of proposed RSSD-WLSFG algorithm with corresponding different APs is the smallest. However, with the increas-ing AP numbers, positionincreas-ing accuracy is not unlimited to be enhanced. For example, the RMSE of proposed algo-rithm with four APs is 1.42 m, and it approaches that with
five APs which is 1.35 m. Similarly, RMSE curves of four APs are also very close to RMSE curves of five APs. Con-versely, the less number of APs results in lower positioning accuracy. When three APs are used, the positioning accu-racy decreases so much that the positioning requirements cannot be met. Moreover, even with the use of four APs, the proposed algorithm still has a higher accuracy than the conventional RSSD-4NN algorithm with five APs.
5 10 15 20 25 30
1 1.5 2 2.5
Mean variance of all the reference points (mχ ), dB (decibel)
Root mean square error, m(meter)
RSSD−KNN, 3 APs RSSD−KNN, 4 APs RSSD−KNN, 5 APs RSSD−FG, 3 APs RSSD−FG, 4 APs RSSD−FG, 5 APs RSSD−WLSFG, 3 APs RSSD−WLSFG, 4 APs RSSD−WLSFG, 5 APs
Table 2Computational complexity comparison of different algorithms
Algorithm Mean location error Running time (s)
RSSD-KNN 1.62 m 0.623
RSSD-FG 1.37 m 0.372
RSSD-WLSFG 1.16 m 0.372
4.3 Computational complexity
Finally, we analyze and compare the computational com-plexity of different algorithms. Notation O(·) is defined as the computational complexity. As shown in Table 1, positioning result can be obtained only by simple arith-metic operations on each node of proposed algorithm. The computational complexity of the conventional 2-D RSSD-FG algorithm is linearly proportional to N (O(N)) as known in [25]. Although the proposed algorithm increases the dimension, it does not change the order of the local linear relationship and also only adds subtraction operation compared with RSS-FG algorithm. Therefore, the computational complexity of the proposed algorithm
is also linearly proportional to N (O(N)). The RSSD-KNN algorithm needs to calculate Euclidean distance with each reference point in the database, and the com-putational complexity is proportional to the number of reference points (n). So the computational complexity of KNN method is O(n). The statistical test results of the three algorithms are shown in Table2. It can be obtained that the proposed 3-D RSSD-WLSFG algorithm not only enjoys low time consumption the same as RSSD-FG algo-rithm but also achieve higher accuracy compared with RSSD-KNN algorithm.
5 Experimental
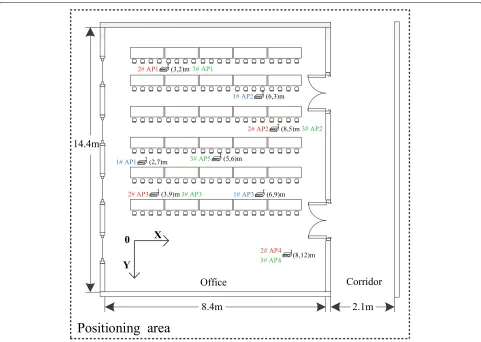
Finally, the proposed RSSD-WLSFG algorithm is vali-dated by field test, which is located on the first floor of the National Radio Monitoring Center, Beijing. The test field consists of an office and its adjacent corridor with an area of length (14.4 m), width (10.5 m), and height (4.8 m) respectively. Total plane area of the test field is 151.2 square meters. In addition, there are four windows on one wall of the office and two doors on the other wall adjacent to the corridor and there are no partitions or
Table 3Mean location errors of different grid distances with four APs
Grid distance RSSD-KNN RSSD-FG RSSD-WLSFG
1.5 m 1.57 m 1.31 m 1.18 m
2 m 1.79 m 1.52 m 1.33 m
compartments. The main items in the office are six rows of desks, chairs, and computers, and human beings are free to enter and leave frequently throughout the whole test. In order to embody the internal structure of the positioning area more intuitively, Fig.9shows the plane layout of test field.
In the off-line fingerprint database establishment phase, the positioning area is divided into two types of grid dis-tances: 1.5 m and 2 m. The SA44B (Signal Hound Co. Ltd.) model signal receivers are used as APs to collect RSS information. The number and layout of APs are selected with three types, which labels are “1#”, “2#”, and “3#” as shown in Fig. 9. Three APs’ locations labeled “1#” are (2, 7, 0) m, (6, 3, 0) m, and (6, 9, 0) m, respectively. Four APs labeled “2#” are deployed in the office at (3, 2, 0) m, (8, 5, 0) m, (3, 9, 0) m, and (8, 12, 0) m. Five APs labeled “3#” are (3, 2, 0) m, (8, 5, 0) m, (3, 9, 0) m, (8, 12, 0) m, and (5, 6, 0) m, respectively. In this experiment, the radio transmitter TFG6300 (SUING Co. Ltd.) model used to establish the fingerprint database and be as the URT is adjustable in transmitting “frequency/strength”. In order to better prove the adaptability of the pro-posed RSSD-WLSG algorithm for different frequency and strength, we choose “1GHz/20dB” off-line database and “300MHz/13dB” URT in the test. Here, the stored RSS
of each reference point in the fingerprint database are obtained by averaging 100 sampling RSS measurements from each AP. In the positioning area, 100 test locations are randomly selected for localization test.
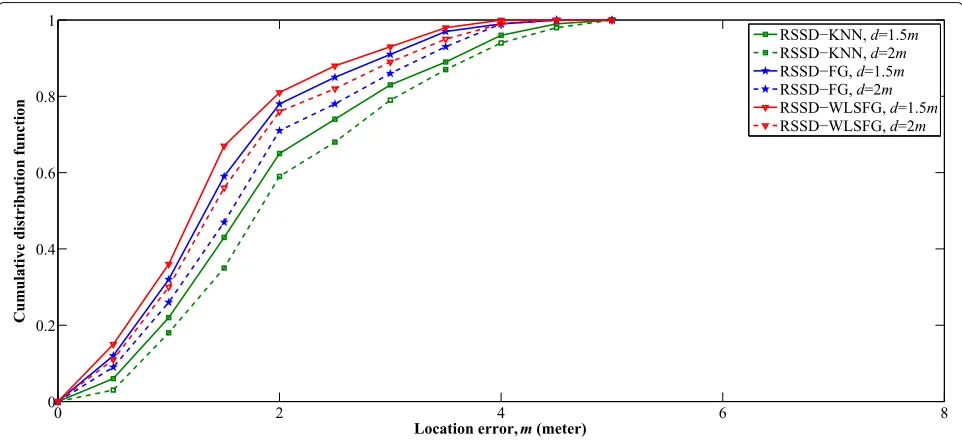
The mean location error and cumulative distribution function (CDF) of location errors are used as the key eval-uation indicators to compare the performance of RSSD-WLSFG, RSSD-FG, and RSSD-KNN. The mean location errors are characterized by the average deviation value of all the positioning targets that compared with the real location. CDF represents the distribution of the loca-tion errors expressed as percentage. First, comparisons of different grid distances among three algorithms are conducted in the positioning area, which are using 1.5-m grid distance and 2-1.5-m grid distance, respectively. The mean location error of different algorithms with four APs are as shown in Table 3. When the grid distance is 1.5 m, the mean location error by proposed RSSD-WLSFG algorithm is 1.18 m. In comparison, the mean location errors of RSSD-FG and RSSD-KNN are 1.57 m and 1.31 m, respectively. With the grid distance increas-ing to 2 m, the mean location errors of RSSD-KNN, RSSD-FG, and RSSD-WLSFG are 1.79 m, 1.52 m, and 1.33 m, respectively. The CDF of RSSD-KNN, RSSD-FG, and RSSD-WLSFG is as shown in Fig. 10. When the grid distance is 1.5 m or 2 m, the number of qualified testing points of the proposed algorithm within different location errors is larger than that of the other two algo-rithms. Considering the location error within 1.5 m, the CDF for each algorithm is 43% for RSSD-KNN, 59% for RSSD-FG, and 67% for RSSD-WLSFG when the grid dis-tance is 1.5 m. The CDF of RSSD-KNN, RSSD-FG, and
Table 4Mean location errors of different APs with 1.5-m grid distance
Number of APs RSSD-KNN RSSD-FG RSSD-WLSFG
3 APs 1.83 m 1.71 m 1.56 m
4 APs 1.51 m 1.35 m 1.12 m
5 APs 1.43 m 1.28 m 1.05 m
RSSD-WLSFG is 35%, 47%, and 58% respectively, when the the grid distance is 2 m and the location error is within 1.5 m. The results show that the positioning accuracy of proposed WLSFG algorithm is better than RSSD-FG and RSSD-KNN no matter the grid distance is 1.5 m or 2 m.
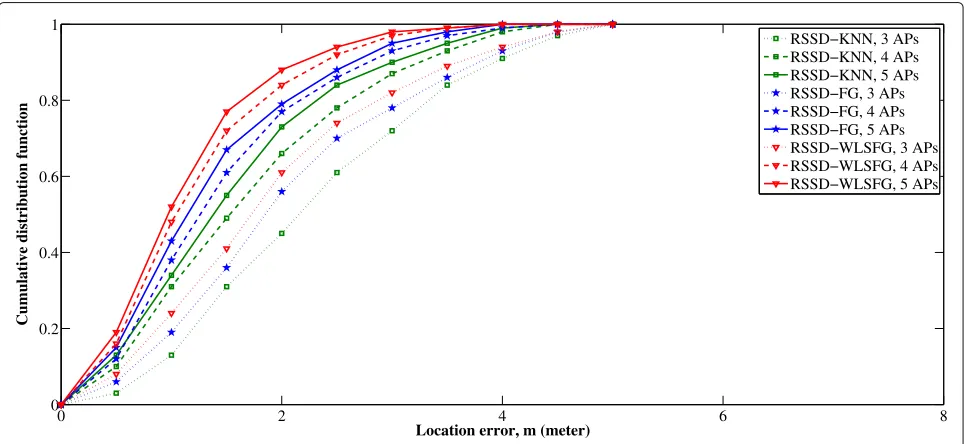
Next, we explore impact of the number of APs on the positioning accuracy through experiments. The 1.5-m grid distance is selected to evaluate the positioning performance of different algorithms when the number of APs changes from three to five. Comparison of the mean location errors among different algorithms with 1.5-m grid distance is as shown in Table4. The mean location errors of RSSD-KNN, RSSD-FG, and RSSD-WLSFG algo-rithms are 1.83 m, 1.71 m, and 1.56 m respectively when utilizing three APs. It can be observed from the com-parison of experimental results that the mean location errors of three algorithms are 1.51 m, 1.35 m, and 1.12 m respectively with four APs. While using five APs, the mean location error of proposed is 1.05 m. In comparison, the mean location errors of RSSD-KNN and RSSD-FG are 1.43 m and 1.28 m. Figure11shows the CDF comparison
of location errors with different numbers of APs. The CDF of RSSD-KNN, RSSD-LS, and RSSD-WLSFG is 42%, 56%, and 62% respectively, when the number of APs is three and location error within 1.5 m. When the number of APs is four, the CDF for each algorithm is 62% for RSSD-KNN, 68% for RSSD-FG, and 72% for RSSD-WLSFG when the location error is within 1.5 m. As the number increasing to five, CDF of the three algorithms are 55%, 67% and 77%, respectively. The results demonstrate that the increasing number of APs can improve the positioning accuracy. In the case of different number of APs, the positioning per-formance of proposed algorithm is superior to the other two algorithms. Considering hardware costs and precision requirements, a minimum number of APs is four, which is acceptable. The above experiment results show that the proposed RSSD-WLSFG algorithm has a higher position-ing accuracy than RSSD-KNN and RSSD-LS in different grid distances and AP numbers.
6 Conclusions
For localization requirement of the radio transmit-ter in 3-D scenario, this paper proposed a new 3-D RSSD-WLSFG algorithm to achieve accurate detection of an URT. With the Gaussian assumption of RSS n, a novel RSSD-based 3-D WLSFG model was estab-lished with WLS method to eliminate the influence from the variance diversity of reference points com-pared with the conventional 2-D RSSD-based FG model. Utilizing the proposed weight calculation method, the relationship between RSSD measured value and loca-tion coordinates is more reasonable and accurate, which
0 2 4 6 8
0 0.2 0.4 0.6 0.8 1
Location error, m (meter)
Cumulative distribution function
RSSD−KNN, 3 APs RSSD−KNN, 4 APs RSSD−KNN, 5 APs RSSD−FG, 3 APs RSSD−FG, 4 APs RSSD−FG, 5 APs RSSD−WLSFG, 3 APs RSSD−WLSFG, 4 APs RSSD−WLSFG, 5 APs
effectively mitigates the error caused by the reference point with larger variance of RSSD measurement and improves the positioning accuracy. The soft-information calculation and iterative process of the proposed algo-rithm were deduced by using the sum-product algoalgo-rithm. In addition, considering the main factors affecting the accuracy of fingerprint positioning technology in practical application, the positioning performance of the proposed algorithm under different grid distances and different AP numbers was explored respectively. Compared with the RSSD-FG and RSSD-KNN algorithms, numerical experi-ment results show that the proposed method effectively improves the positioning accuracy by about 22% and 13%, respectively. Hence, it not only meets the positioning requirements but also has a better application prospect. The effect of AP’s layout and localization of moving URT and multiple URTs will be involved in our future research.
Abbreviations
AP: Access point; FG: Factor graph; LS: Least square; RSSD: Received signal strength difference; URT: Unknown radio transmitter; WLS: Weighted least square
Funding
This research was funded by the Ministry of Industry and Information Technology of the People’s Republic of China (CN) (No. 12-MC-KY-14) and the Education Department of Hebei (No. ZD2017216).
Availability of data and materials
In our test, four SA44B (Signal Hound Co. Ltd.) measuring receivers as APs are utilized to collect the RSS measurements from the radio transmitter (TFG6300, SUING Co. Ltd.). The experimental environment is located on the first floor of National Radio Monitoring Center, Beijing.
Authors’ contributions
LZ proposed the main idea, derived the algorithm, and wrote the paper. TD review the work and versions. CJ wrote the simulation code, processed the experimental data, and revised the paper. All authors read and approved the final manuscript.
Competing interests
The authors declare that they have no competing interests.
Publisher’s Note
Springer Nature remains neutral with regard to jurisdictional claims in published maps and institutional affiliations.
Received: 24 September 2018 Accepted: 14 December 2018
References
1. S. Gao, F. Zhang, G. Wang, NLOS error mitigation for TOA-based source localization with unknown transmission time. IEEE Sensors J.17(12), 3605–3606 (2017)
2. Z. Su, G. Shao, H. Liu, Semidefinite programming for NLOS error mitigation in TDOA localization. IEEE Commun. Lett.22(7), 1430–1433 (2018) 3. Y. Wang, Y. Wu, D. Wang, Y. Shen, TDOA and FDOA based source
localisation via importance sampling. IET Sig. Process.12(7), 917–929 (2018)
4. S. Chang, Y. Li, H. Wang, W. Hu, Y. Wu, RSS-based cooperative localization in wireless sensor networks via second-order cone relaxation. IEEE Access. 6, 54097–54105 (2018)
5. S. Yan, G. W. Peters, I. Nevat, R. Malaney, Location verification systems based on received signal strength with unknown transmit power. IEEE Commun. Lett.22(3), 650–653 (2018)
6. X. Fang, J. Li, Frame theory for optimal sensor augmentation problem of aoa localization. IEEE Sig. Process. Lett.25(9), 1310–1314 (2018) 7. A. Noroozi, A. H. Oveis, S. M. Hosseini, M. A. Sebt, Improved algebraic
solution for source localization from TDOA and FDOA measurements. IEEE Wirel. Commun. Lett.7(3), 352–355 (2018)
8. S. Tomic, M. Beko, R. Dinis, 3-D target localization in wireless sensor networks using RSS and AOA measurements. IEEE Trans. Veh. Technol. 66(4), 3197–3210 (2017)
9. A. Coluccia, A. Fascista, On the hybrid toa/rss range estimation in wireless sensor networks. IEEE Trans. Wirel. Commun.17(1), 361–371 (2018) 10. Y. Xu, J. Zhou, P. Zhang, RSS-based source localization when path-loss
model parameters are unknown. IEEE Commun. Lett.18(6), 1055–1058 (2014)
11. P. Tarrio, A. M. Bernardos, J. A. Besada, J. R. Casar, inIEEE International Symposium on Wireless Communication Systems. A new positioning technique for RSS-based localization based on a weighted least squares estimator, (2008), pp. 633–637
12. S. Tomic, M. Beko, D. Rui, M. Tuba, N. Bacanin, inTelecommunications Forum. An efficient wls estimator for target localization in wireless sensor networks, (2017)
13. P. Bahl, V. N. Padmanabhan, inINFOCOM 2000. Nineteenth Joint Conference of the IEEE Computer and Communications Societies. Proceedings. IEEE. Radar: an in-building RF-based user location and tracking system, (2000), pp. 775–7842
14. L. M. Ni, Y. Liu, Y. C. Lau, A. P. Patil, inIEEE International Conference on Pervasive Computing and Communications. Landmarc: Indoor location sensing using active RFID, (2003), pp. 701–710
15. B. Abdelghani, Q. Gao, inIEEE International Conference on Control Science and Systems Engineering. Hybrid RSS-based fingerprinting positioning method with segmentation and KNN in cellular network, (2017), pp. 465–469
16. H. Sahota, R. Kumar, Maximum-likelihood sensor node localization using received signal strength in multimedia with multipath characteristics. IEEE Syst. J.12(1), 506–515 (2018)
17. M. T. Hoang, Y. Zhu, B. Yuen, T. Reese, X. Dong, T. Lu, R. Westendorp, M. Xie, A soft range limited k-nearest neighbors algorithm for indoor localization enhancement. IEEE Sensors J.18(24), 10208–10216 (2018)
18. X. Qu, L. Xie, W. Tan, Iterative constrained weighted least squares source localization using tdoa and FDOA measurements. IEEE Trans. Sig. Process. PP(99), 1 (2017)
19. C. H. Lin, Linear least squares approach for accurate received signal strength based source localization. IEEE Trans. Sig. Process.59(8), 4035–4040 (2011)
20. J. C. Chen, Y. C. Yeong-Cheng Wang, C. S. Maa, J. T. Chen, Network-side mobile position location using factor graphs. IEEE Trans. Wirel. Commun. 5(10), 2696–2704 (2006)
21. H. L. Jhi, J. C. Chen, C. H. Lin, C. T. Huang, A factor-graph-based toa location estimator. IEEE Trans. Wirel. Commun.11(5), 1764–1773 (2012) 22. C. Mensing, S. Plass, Positioning based on factor graphs. EURASIP J.
Advances Sig. Process.2007(1), 1–11 (2007)
23. C. T. Huang, C. H. Wu, Y. N. Lee, J. T. Chen, A novel indoor RSS-based position location algorithm using factor graphs. IEEE Trans. Wire. Commun.8(6), 3050–3058 (2009)
24. A. K. M. M. Hossain, Y. Jin, W. S. Soh, H. N. Van, SSD: A robust RF location fingerprint addressing mobile devices. IEEE Trans. Mob. Comput.12(1), 65–77 (2013)
25. M. R. K. Aziz, K. Anwar, T. Matsumoto, inEuropean Wireless 2016; European Wireless Conference; Proceedings Of. DRSS-based factor graph geolocation technique for position detection of unknown radio emitter, (2016) 26. L. Zhang, T. Du, C.-X. Wang, in2017 IEEE/CIC International Conference on
Communications in China, ICCC 2017, Qingdao, China, October 22-24, 2017. Detection of an unknown radio transmitter using joint RSSD and AOA information based on factor graph, (2017), pp. 1–5
27. F. R. Kschischang, B. J. Frey, H. A. Loeliger, inIEEE Trans. Inf. Theory. Factor graphs and the sum-product algorithm, (1998), pp. 498–519
28. Y. Hu, G. Leus, Robust differential received signal strength-based localization. IEEE Trans. Sig. Process.65(12), 3261–3276 (2017)