R E S E A R C H
Open Access
Analysis of synonymous codon usage in Hepatitis
A virus
Yiqiang Zhang
1,2†, Yongsheng Liu
1†, Wenqian Liu
1, Jianhua Zhou
1, Haotai Chen
1, Yin Wang
2, Lina Ma
1,
Yaozhong Ding
1and Jie Zhang
1*Abstract
Background:Hepatitis A virus is the causative agent of type A viral hepatitis, which causes occasional acute hepatitis. Nevertheless, little information about synonymous codon usage pattern of HAV genome in the process of its evolution is available. In this study, the key genetic determinants of codon usage in HAV were examined. Results:The overall extent of codon usage bias in HAV is high inPicornaviridae. And the patterns of synonymous codon usage are quite different in HAV genomes from different location. The base composition is closely
correlated with codon usage bias. Furthermore, the most important determinant that results in such a high codon bias in HAV is mutation pressure rather than natural selection.
Conclusions:HAV presents a higher codon usage bias than other members ofPicornaviridae. Compositional constraint is a significant element that influences the variation of synonymous codon usage in HAV genome. Besides, mutation pressure is supposed to be the major factor shaping the hyperendemic codon usage pattern of HAV.
Background
Hepatitis A virus (HAV), the causative agent of type A viral hepatitis, is an ancient human virus that was first identified in the stools of infected people in 1973 [1]. HAV is a non-enveloped, single-stranded positive-sence RNA virus which belongs to orderPicornavirales, family Picornaviridae, the genus Hepatovirusin virus taxonomy [2-4]. The genome of HAV is approximately 7500 nucleotide in length and contains a large open-reading frame (ORF) encoding a polyprotein in which the major capsid proteins represent the amino-terminal third, with the remainder of the polyprotein comprising a series of nonstructural proteins required for HAV RNA replica-tion: 2B, 2C, 3A, 3B, 3Cproand 3Dpol. Based on the stu-dies of genetics, HAV was proposed to divide into six different genotypes [5]. However, there is only one known serological group of human HAV [6,7]. Although HAV causes occasional, dramatic disease outbreaks of
acute hepatitis with fatal outcomes in otherwise healthy adults as well as isolated severe cases of hepatitis, it has never been associated with chronic liver disease [8].
As we all know, the genetic code chooses 64 codons to represent 20 standard amino acids and stop signals. These alternative codons for the same amino acid are termed as synonymous codons. Synonymous mutations tend to occur in the third base position, but the cases can be interchanged without altering the primary sequence of the polypeptide product. Some reports indi-cate that synonymous codons are not chosen equally both within and between genomes [9-13]. In general, codon usage variation may be the product of natural selection and/or mutation pressure for accurate and effi-cient translation in various organisms [14-21]. It is well known that codon usage variation is considered as an indicator of the forces shaping genome evolution. In addition, compared with natural selection, mutation pressure plays an important role in synonymous codon usage pattern in some RNA viruses [18,22,23].
Nevertheless, little information about codon usage pattern of HAV genome including the relative synon-ymous codon usage (RSCU) and codon usage bias (CUB) in the process of its evolution is available. In this * Correspondence: [email protected]
†Contributed equally
1State Key Laboratory of Veterinary Etiological Biology, Lanzhou Veterinary Research Institute, Chinese Academy of Agricultural Sciences, Lanzhou 730046, Gansu, China
Full list of author information is available at the end of the article
study, the key genetic determinants of codon usage index in HAV were examined.
Results
Synonymous codon usage in HAV
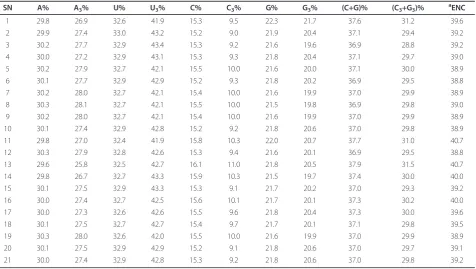
The values of nucleotide contents in complete coding region of all 21 HAV genomes were analyzed (Table 1). Evidently, (C+G)% content fluctuated from 36.9 to 37.9, with a mean value of 37.15 and S.D of 0.28, indicating that nucleotides A and U were the major elements of HAV genome. Comparing the values of A3%, U3%, C3%
and G3%, it is clear that U3% was distinctly high, and
C3% was the lowest of all. The (C3+G3)% in complete
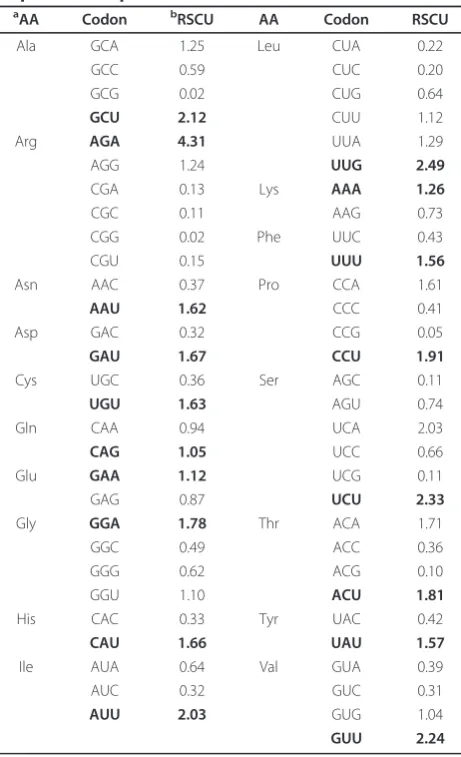
coding region of each HAV genome fluctuated from 28.8 to 31.5, with a mean value of 29.92 and S.D of 0.62. And the effective number of codons (ENC) values of these HAV genomes fluctuated from 38.8 to 40.7, with a mean value of 39.34 and S.D. of 0.58. The ENC values for these HAV genomes were a little low indicat-ing that the there is a particular extent of codon prefer-ence in HAV genome. The details of the overall relative synonymous codon usage (RSCU) values of 59 codons in 21 HAV genomes were analyzed (Table 2). Most pre-ferentially used codons in HAV are A-ended or U-ended codons except the Gln and Leu whose optimized codons are CAG and UUG ending by G, respectively. Interestingly, HAV prefers U-ended optimized codons to A-ended codons.
Correspondence analysis (COA)
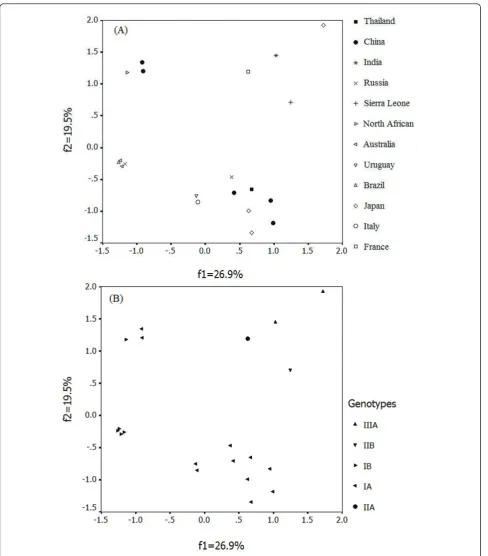
To investigate the major trend in codon usage variation among HAV, COA was used for all 21 HAV complete coding regions selected for this study. COA detected one major trend in the first axis (ƒ’1) which accounted
for 26.98% of the total variation, and another major trend in the second axis (ƒ’2) which accounted for
19.50% of the total variation. A plot of the first and sec-ond principal axes of the complete coding region of each gene was shown in Figure 1. It is clear that coordi-nate of each gene is relatively isolate except the Austra-lia isolates, Brazil isolate and one Russia isolate. Nevertheless, these relatively isolated spots tend to clus-ter into several groups according to the same genotype. But MBB which isolated from North Africa had a spe-cial codon usage pattern contrasting with the other IB strains. All above imply that these strains of HAV iso-lated from different places, even the same genotype, have different trend in codon usage variation. Interest-ingly, the pattern of codon usage in vaccine strain H2 change to MBB-like pattern after continuous culturing in a human diploid cell line (KMB17), i.e. H2K5 and H2K20, suggesting that host was an element that could dramatically influence the codon usage pattern.
Compositional properties of HAV genomes
In order to analyze whether the codon usage variation of HAV genome was regulated by natural selection or Table 1 Identified nucleotide contents in complete coding region (length >250 bps) in hepatitis A virus (21 isolates) genome
mutation pressure, the A%, U%, C%, G% and (C+G)% were respectively compared with A3%, U3%, C3%, G3%
and (C3+G3)% (Table 3). There was a complex
correla-tion existing in nucleotide composicorrela-tions. In detail, A3%,
C3% and G3% have a significant negative correlation
with C%, U% and A%, respectively. These data suggest that the nucleotide constraint may influence synon-ymous codon usage. However, A3% has non-correlation
with U%, and U3% has non-correlation with A%, C%, G
% and (C+G)%, respectively, which haven’t indicated any peculiarity about synonymous codon usage. Further-more, C3% and G3% have non-correlation with G% and
C% respectively, indicating these data probably don’t reflect the true feature of synonymous codon usage as well. Therefore, linear regression analysis was imple-mented to analyze the correlation between synonymous codon usage bias and nucleotide compositions. Details
of correlation analysis between the first two principle axes (ƒ’1 and ƒ’2) of each HAV genome in COA and
nucleotide contents were analyzed (Table 4). In surprise, only A3% has a significant correlation with both
princi-ple axes which represent the major trend in codon usage variation, suggesting that nucleotide A is the major factor influencing the synonymous codon usage pattern of HAV genome. However, interestingly, although the (ƒ’2) value has non-correlation with base
nucleotide C and G contents on the third codon posi-tion respectively, it is observably related to (C3+G3)%,
suggesting that codon usage patterns in HAV probably be correlated with (C3+G3)% to a specific extent.
Over-all, compositional constraint is a factor shaping the pat-tern of synonymous codon usage in HAV genome.
Mutational bias is another main factor leading to codon usage variation
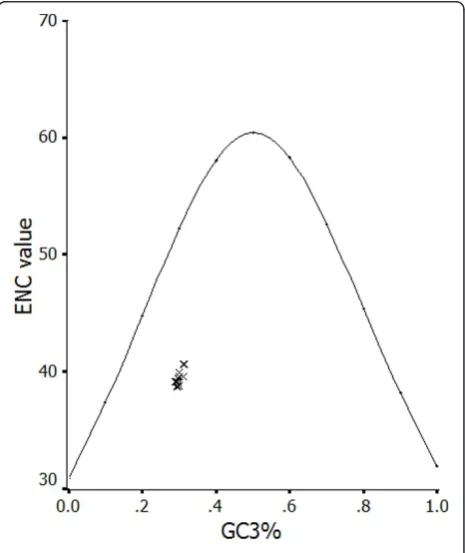
ENC-plot was considered as a part of the general strat-egy to investigate patterns of synonymous codon usage. The ENC-plots of the genes, whose codon choice is constrained only by a C3+G3composition, will lie on or
just below the curve of the predicted values (Wright, 1990). ENC values of each HAV genome were plotted against its corresponding (C3+G3)%. All of the spots lie
below the curve of the predicted values, as shown in Figure 2, suggesting that the codon usage bias in all these 21 HAV genomes is principally influenced by the mutational bias.
Discussion
Overtime, there have been more and more features that are unique to HAV within the family Picornaviridae, including its tissue tropism, its virion morphogenesis, its genetic distance from other members of this family, the important details of the processing of the viral polypro-tein and the interactions of the virus with host cells [24]. After we analyzed synonymous codon usage in HAV (Table 2), we found that comparing with other viruses of Picornaviridae, such as Coxsackievirus A9 (ENC = 55.6), Enterovirus 71 (ENC = 56.6), Poliovirus type 3 (ENC = 54.2), Rhinovirus type 89 (ENC = 45.9) [23] and Food-and-Mouth Disease virus (mean ENC = 51.53) [21], the ENC values for HAV are a little low (mean ENC = 39.34). Although the ENC values for Cox-sackievirus, Enterovirus, Poliovirus and Rhinovirus are not the mean value, it is also suggesting that the overall extent of codon usage bias in HAV genomes is rather high inPicornaviridae. In fact, Sánchez et al. have pre-viously reported that HAV presents a higher codon usage bias than other members of the family, which conveys in the adaptation to use abundant and rare codons [25]. As a result, HAV codon usage has evolved to be complementary to that of human cells, never Table 2 Synonymous codon usage of the whole coding
sequence in hepatitis A virus
a
AA Codon bRSCU AA Codon RSCU
Ala GCA 1.25 Leu CUA 0.22
GCC 0.59 CUC 0.20
GCG 0.02 CUG 0.64
GCU 2.12 CUU 1.12
Arg AGA 4.31 UUA 1.29
AGG 1.24 UUG 2.49
CGA 0.13 Lys AAA 1.26
CGC 0.11 AAG 0.73
CGG 0.02 Phe UUC 0.43
CGU 0.15 UUU 1.56
Asn AAC 0.37 Pro CCA 1.61
AAU 1.62 CCC 0.41
Asp GAC 0.32 CCG 0.05
GAU 1.67 CCU 1.91
Cys UGC 0.36 Ser AGC 0.11
UGU 1.63 AGU 0.74
Gln CAA 0.94 UCA 2.03
CAG 1.05 UCC 0.66
Glu GAA 1.12 UCG 0.11
GAG 0.87 UCU 2.33
Gly GGA 1.78 Thr ACA 1.71
GGC 0.49 ACC 0.36
GGG 0.62 ACG 0.10
GGU 1.10 ACU 1.81
His CAC 0.33 Tyr UAC 0.42
CAU 1.66 UAU 1.57
Ile AUA 0.64 Val GUA 0.39
AUC 0.32 GUC 0.31
AUU 2.03 GUG 1.04
GUU 2.24
a
AA is the abbreviation of amino acid. b
RSCU values are mean values. c
adopting codons those abundant for the host cell, even in some instances using these abundant codons as rare codons [26].
Since the variation and evolution of virus generally appear in the changes of virus genome composition, compositional constraint was assumed to be closely cor-related with the synonymous codon usage pattern [18,19,27-30]. Nucleotide U content was the highest, and the ratio of U3% was much higher than the other
base composition on the third codon position (Table 3), which interpreted why most of the preferentially used codons are U-ended codons (Table 2). Despite the ratio of U3% was the highest, the major compositional
con-straint, which shaping the synonymous codon usage pat-tern of HAV genome, was from the percent of nucleotide A on the third codon position (Table 4). Moreover, two principle axes (ƒ’1and ƒ’2) are not
corre-lated with the other base compositions except nucleo-tide A (Table 4). This discovery was different from many reports which suggest that C+G compositional constraints were the major factor influencing codon usage bias in virus genome [18,29,30]. Therefore, we supposed that the compositional constraint was from not only C+G contents but also A and/or U contents. In addition, we found that A3% has a remarkable
correla-tion with (C+G)% (Table 3). Hence, we could infer that A3% could influence the synonymous codon usage
pat-tern through coordinating the contents of (C+G)%.
Moreover, each composition was closely correlated with one of the other compositions, and each composition has a striking negative correlation with the other com-positions. The (C3+G3)% was correlated with all the
base compositions especially U and C contents. All these data suggest that there were kinds of complex and fantastic interrelations existing among these base com-positions to regulate the codon usage bias. In brief, compositional constraint can indeed determine the var-iation of synonymous codon usage in virus genome.
Mutational pressure and natural selection are gener-ally thought to be the main factors that account for codon usage variation between genes in different Table 3 Summary of correlation analysis between the A, U, C, G contents and A3, U3, C3, G3contents in all selected samples
A3% U3% C3% G3% (C3+G3)%
A% r = 0.965** r = -0.160NS r = -0.328NS r = -0.555** r = -0.679** U% r = 0.357NS r = 0.691** r = -0.853** r = -0.164NS r = -0.825** C% r = -0.622** r = -0.191NS r = 0.926** r = -0.140NS r = 0.662**
G% r = -0.532* r = -0.181NS r = -0.139NS r = 0.945** r = 0.580**
(C+G)% r = -0.844** r = -0.270NS r = 0.687** r = 0.462* r = 0.907**
a
r value in this table is calculated in each correlation analysis. NS means non-significant (p > 0.05).
* means 0.01 < p < 0.05. **means p < 0.01.
Table 4 Analysis of correlation between the first two principle axes and nucleotide contents in samples
Base compositions f1’(26.98%) f2’(19.50%)
A3% r = -0.714** r = -0.573** U3% r = 0.302NS r = 0.151NS C3% r = 0.274NS r = 0.332NS G3% r = 0.178NS r = 0.433* (C3+G3)% r = 0.361NS r = 0.589**
a
r value in this table is calculated in each correlation analysis. NS means non-significant.
* means 0.01 < p < 0.05. **means p < 0.01.
organisms [14-21]. We wished to determine which should be responsible for the extreme codon usage bias in HAV. In the present study, the mutational pressure was determined to be the more important factor for the codon usage bias in HAV, which is shown in Figure 2, indicating that the codon usage in HAV genome is influenced by the C+G content which is usually assumed to be the result of mutational pressure. Actu-ally, it is previously reported that mutation pressure rather than natural selection is the most important determinant of the codon bias in human RNA viruses [23]. Since mutation rates in RNA viruses are much higher than those in DNA viruses [31], it is understand-able that mutational pressure is the major factor of shaping codon usage pattern in the 21 HAV strains included in our study. Despite this, HAV does not appear to undergo the rapid accumulation of genetic changes seen in many RNA viruses. Because HAV exploits a very low translation rate and a very low repli-cation rate to promote and ensure its survival [26,32], it shows a quite low mutation rate than other members of the familyPicornaviridae [24,33].
Since HAV mutation rate is much lower than other members of the familyPicornaviridae, how does it form such a higher codon usage bias than other members of the family? Furthermore, how does it form kinds of trends in codon usage variation among different stains (Shown in Figure 1) in the condition of the similar nucleotide contents (Table 2)? This could be ascribed to the distinct endemicity of HAV, which is speculated from the result of COA. Early comparative studies of the nucleotide sequences of different human HAV strain suggested that sequence correlation could be correlated with the geographical origin of viruses [34,35]. It is well known that quasispecies dynamics is characterized by continuous generation of variant viral genomes, compe-tition among them, and selection of the fittest mutant distributions in any given environment. As other RNA viruses, HAV exists in vivo as distributions of closely related variant referred to as quasispecies [25,32]. HAV strains maintained their low rate of accumulating muta-tions over a long period of time so that it developed specific ecological niches [33]. Because of surviving in different geographical area, different human race and different rounds of replication, the extreme codon usage bias of HAV was established over a long time. More-over, in the context of a very low mutation rate, the extreme codon usage bias of HAV was conserved so that a distinct endemicity was generated.
Conclusions
HAV presents a higher codon usage bias than other members ofPicornaviridae. The most important deter-minant of the high codon bias in HAV is mutation
pressure which is also the main element shaping the hyperendemic codon usage pattern of HAV despite the mutation rate of HAV is quite low. Besides, composi-tional constraint is another factor influencing the synon-ymous codon usage in HAV. Although basic knowledge of codon usage patterns of HAV and the factors regulat-ing the synonymous codon usage are demonstrated in our present study, more comprehensive analysis is necessary for revealing the deeper characteristic of synonymous codon usage in HAV genome.
Materials and methods Sequences
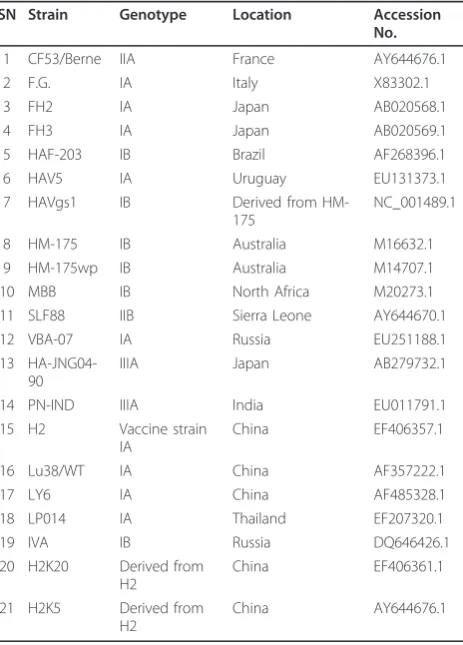
The 21 available complete RNA sequences of HAV were obtained from GenBank randomly in October 2010. The serial number (SN), GenBank number, genotype and other detail information are listed in Table 5.
Measures of relative synonymous codon usage
Relative synonymous codon usage values of each codon in a gene were calculated to investigate the characteris-tics of synonymous codon usage without the confound-ing influence of amino acid composition of different
Table 5 Information of hepatitis A virus genomes used in this study
SN Strain Genotype Location Accession No.
1 CF53/Berne IIA France AY644676.1
2 F.G. IA Italy X83302.1
3 FH2 IA Japan AB020568.1
4 FH3 IA Japan AB020569.1
5 HAF-203 IB Brazil AF268396.1
6 HAV5 IA Uruguay EU131373.1
7 HAVgs1 IB Derived from HM-175
NC_001489.1
8 HM-175 IB Australia M16632.1
9 HM-175wp IB Australia M14707.1
10 MBB IB North Africa M20273.1
11 SLF88 IIB Sierra Leone AY644670.1
12 VBA-07 IA Russia EU251188.1
13 HA-JNG04-90
IIIA Japan AB279732.1
14 PN-IND IIIA India EU011791.1
15 H2 Vaccine strain IA
China EF406357.1
16 Lu38/WT IA China AF357222.1
17 LY6 IA China AF485328.1
18 LP014 IA Thailand EF207320.1
19 IVA IB Russia DQ646426.1
gene sample [14]. The RSCU value of theith codon for thejth amino acid was calculated as:
RSCU= gniij·ni
j gij
Where gijis the observed number of the ith codon for jth amino acid which has nitype of synonymous codons.
When the codon with RSCU values close to 1.0, it means that this codon is chosen equally and randomly.
The ENC was calculated to quantify the codon usage bias of an ORF [36], which is the best estimator of abso-lute synonymous codon usage bias [37]. The larger extent of codon preference in a gene, the smaller the ENC value is. And the index GC3s was used to calculate the fraction of the nucleotides G+C at the synonymous third codon position (excluding Met, Trp, and the ter-mination codons).
Correspondence analysis
Multivariate statistical analysis can be used to explore the relationships between variables and samples. In this study, correspondence analysis was used to investigate the major trend in codon usage variation among genes. In this study, the complete coding region of each gene was represented as a 59 dimensional vector, and each dimension corresponds to the RSCU value of one sense codon (excluding Met, Trp, and the termination codons) [38].
Correlation analysis
Correlation analysis was used to identify the relationship between nucleotide composition and synonymous codon usage pattern [39]. This analysis was implemented based on the Spearman’s rank correlation analysis way.
All statistical processes were carried out by with statis-tical software SPSS 11.5 for windows.
Acknowledgements
This work was supported in parts by grants from National Key Technologies R&D Program (2009ZX08007-006B), International Science & Technology Cooperation Program of China (No.2010DFA32640) and Science and Technology Key Project of Gansu Province (No.0801NKDA034). This study was also supported by National Natural Science foundation of China (No.30700597 and No. 31072143).
Author details
1
State Key Laboratory of Veterinary Etiological Biology, Lanzhou Veterinary Research Institute, Chinese Academy of Agricultural Sciences, Lanzhou 730046, Gansu, China.2Laboratory of Animal Quarantine, College of Animal Medical, Sichuan Agricultural University, Ya’an 625014, Sichuan, China.
Authors’contributions
YQZ conceived of the study, downloaded these sequences, calculated the data, analyzed the results and drafted the manuscript; YSL conceived of the study, supervised the research, analyzed the results and helped draft the manuscript; JHZ calculated and visualized the data; WQL, HTC, YW, LNM and
YZD assisted with data analysis; JZ supervised the research and helped draft the manuscript. All authors read and approved the final manuscript.
Competing interests
The authors declare that they have no competing interests.
Received: 10 December 2010 Accepted: 16 April 2011 Published: 16 April 2011
References
1. Feinstone SM, Kapikian AZ, Purcell RH:Hepatitis A: detection by immune electron microscopy of a virus-like antigen associated with a cute illness.
Science1973,182:1026-1028.
2. Melnick JL:Classification of hepatitis A virus as enterovirus type 72 and of hepatitis B virus as hepadnavirus type I.Intervirology1982,l8:105-106. 3. Gust ID, Coulepis AG, Feinstone SM, Locarnini SA, Moritsugu Y, Najera R,
Siegl G:Taxonomic classification of hepatitis A virus.Intervirology1983, 20:1-7.
4. Minor PD:Picornaviridae.InClassification and Nomenclature of Viruses: Fifth Report of the International Committee on Taxonomy of Viruses, Archives of Virology, Supplementum. Volume 2.Edited by: Francki RIB, Fauquet CM, Knudson DL, Brown F. Wien: Springer Verlag; 1991:320-326.
5. Costa-Mattioli M, Ferre V, Casane D, Perez-Bercoff R, Coste-Burel M, Imbert-Marcille BM, Andre EC, Bressollette-Bodin C, Billaudel S, Cristina J:Evidence of recombination in natural populations of hepatitis A virus.Virology
2003,311:51-59.
6. Rakela J, Fay OH, Stevenson K, Gordon I, Mosley JW:Similarities of two hepatitis A virus strains.WHO Bulletin1976,54:561-564.
7. Lemon SM, Binn LN:Antigenic relatedness of two strains of hepatitis A virus determined by cross-neutralization.Infection and Immunity1983, 42:418-420.
8. Martin A, Lemon SM:Hepatitis A virus: from discovery to vaccines.
Hepatology2006,43:S164-S172.
9. Grantham R, Gautier C, Gouy M, Mercier R, Pave A:Codon catalog usage and the genome hypothesis.Nucleic Acids Res1980,8:49-62.
10. Martin A, Bertranpetit J, Oliver JL:Variation in G+C content and codon choice: differences among synonymous codon groups in vertebrate genes.Nucleic Acids Res1989,17:6181-6189.
11. Lloyd AT, Sharp PM:Evolution of codon usage patterns: the extent and nature of divergence betweenCandida albicansandSaccharomyces cerevisiae.Nucleic Acids Res1992,20:5289-5295.
12. Xie T, Ding D, Tao X, Dafu D:The relationship between synonymous codon usage and protein structure.FEBS Lett1998,434:93-96. 13. Dittmar KA, Goodenbour JM, Pan J:Tissue-specific differences in human
transfer RNA expression.PLoS Genet2006,2:2107-2115.
14. Sharp PM, Li WH:Codon usage in regulatory genes inEscherichia coli
does not reflect selection for‘rare’codon.Nucleic Acids Res1986, 14:7737-7749.
15. Sharp PM, Tuohy TM, Mosurski KR:Codon usage in yeast: cluster analysis clearly differentiates highly and lowly expressed genes.Nucleic Acids Res
1986,14:5125-5143.
16. Karlin S, Mrázek J:What drives codon choices in human genes?J Mol Biol
1996,262:459-472.
17. Lesnik T, Solomovici J, Deana A, Ehrlich R, Reiss C:Ribosome traffic inE.coli
and regulation of gene expression.J Theor Biol2000,202:175-185. 18. Gu WJ, Zhou T, Ma JM, Sun X, Lu ZH:Analysis of synonymous codon
usage in SARScoronavirusand other viruses in theNidovirales.Virus Res
2004,101:155-161.
19. Zhou T, Gu WJ, Ma JM, Sun X, Lu ZH:Analysis of synonymous codon usage in H5N1 virus and other influenza A viruses.Biosystems2005, 81:77-86.
20. Zhou T, Sun X, Lu ZH:Synonymous codon usage in environmental Chlamydia UWE25 reflects an evolution divergence from pathogenic chlamydiae.Gene2006,368:117-125.
21. Zhong JC, Li YM, Zhao S, Liu S, Zhang Z:Mutation pressure shapes codon usage in the GC-rich genome of foot-and-mouth disease virus.Virus Genes2007,35:767-776.
22. Levin DB, Whittome B:Codon usage in nucleopolyhedroviruses.J Gen Virol2000,81:2313-2325.
24. Cristina J, Costa-Mattioli M:Genetic variability and molecular evolution of Hepatitis A virus.Virus Res2007,127:151-157.
25. Sánchez G, Bosch A, Pintó RM:Genome variability and capsid structural constraints of hepatitis A virus.J Virol2003,77:452-459.
26. Pintó RM, Aragonès L, Costafreda MI, Ribes E, Bosch A:Codon usage and replicative strategies of hepatitis A virus.Virus Res2007,127:158-163. 27. Bernardi G, Bernardi G:Codon Usage and Genome Composition.J Mol
Evol1985,22:363-365.
28. Bernardi G, Bernardi G:Compositional Constraints and Genome Evolution.
J Mol Evol1986,24:1-11.
29. Das S, Paul S, Dutta C:Synonymous codon usage in adenoviruses: Influence of mutation, selection and protein hydropathy.Virus Res2006, 117:227-236.
30. Zhao S, Zhang Q, Liu XL, Wang XM, Zhang HL, Wu Y, Jiang F:Analysis of synonymous codon usage in 11 Human Bocavirus isolates.BioSystems
2008,92:207-214.
31. Drake JW, Holland JJ:Mutation rates among RNA viruses.Proc Natl Acad Sci USA1999,96:13910-13913.
32. Costa-Mattioli M, Domingo E, Cristina J:Analysis of sequential hepatitis A virus strains reveals coexistence of distinct viral subpopulations.J Gen Virol2006,87:115-118.
33. Robertson BH, Jansen RW, Khanna B, Totsuka A, Nainan OV, Siegl G, Widell A, Margolis HS, Isomura S, Ito K, Ishizu T, Moritsugu Y, Lemon SM: Genetic relatedness of hepatitis A virus strains recovered from different geographical regions.J Gen Virol1992,73:1365-1377.
34. Jansen RW, Siegl G, Lemon SM:Molecular epidemiology of human hepatitis A virus defined by an antigen-capture/polymerase chain reaction method.Proc Natl Acad Sci USA1990,87:2867-2871.
35. Robertson BH, Khanna B, Nainan OV, Margolis HS:Epidemiologic patterns of wild-type hepatitis A virus determined by genetic variation.J Infect Dis1991,163:286-292.
36. Wright F:The‘effective number of codons’used in a gene.Gene1990, 87:23-29.
37. Comeron JM, Aguade M:An evaluation of measures of synonymous codon usage bias.J Mol Evol1998,47:268-274.
38. Mardia KV, Kent JT, Bibby JM:Multivariate analysisNewYork, Academic press; 1979.
39. Ewens WJ, Grant GR:Statistical Methods in BioinformaticsNewYork, Springer; 2001.
doi:10.1186/1743-422X-8-174
Cite this article as:Zhanget al.:Analysis of synonymous codon usage in Hepatitis A virus.Virology Journal20118:174.
Submit your next manuscript to BioMed Central and take full advantage of:
• Convenient online submission
• Thorough peer review
• No space constraints or color figure charges
• Immediate publication on acceptance
• Inclusion in PubMed, CAS, Scopus and Google Scholar
• Research which is freely available for redistribution