R E S E A R C H
Open Access
A dynamic geo-based resource selection
algorithm for LTE-V2V communications
Xinyu Gu and Yi Ding
*Abstract
The geography-based (geo-based) resource selection algorithm is one of the feasibility schemes of third-generation partnership project (3GPP). However, most researches about it ignore the impacts of boundary interference and vehicle density. Therefore, this paper firstly puts forward an enhanced geo-based resource selection algorithm (EGRSA). This algorithm can eliminate the boundary interference through randomizing subframes of each sub resource pool. On the basis of EGRSA, the dynamic geo-based resource selection algorithm (DGRSA) is proposed to guarantee the reliability of communication when vehicle density is nonuniform. In DGRSA, mapping relationships are changed dynamically by grouping and optimal matching, and the size of each sub resource pool can also be adjusted. The system level simulation results indicate that the EGRSA is able to improve the packet reception ratio (PRR) and reduce the number of boundary collisions. Meanwhile, the proposed DGRSA further promotes the PRR when vehicle density is in a non-uniformity distribution because of traffic jam.
Keywords: LTE-V2V, Dynamic, Geo-based, Resource selection
1 Introduction
With the development of telecommunication technolo-gies and sensor techniques, intelligent transportation sys-tem (ITS) is regarded as a major development direction in the transportation field. In order to support the real-time, accuracy and efficiency of ITS, an early form of the Internet of Vehicles is proposed, which is called vehicular ad hoc network (VANET). VANET is a type of mobile ad hoc network (MANET). It provides communication ser-vice among vehicles or between vehicles and road side units (RSUs) without the help of any infrastructure [1,2].
In recent years, the Internet of Vehicles is offi-cially identified as a typical scene in fifth-generation (5G). So, the third-generation partnership project (3GPP) intends to implement it based on the long-term evo-lution (LTE) network, which is known as long-term evolution-vehicle (LTE-V). The LTE-V supports multiple types of application including vehicle-to-vehicle (V2V), to-infrastructure/network (V2I/N), and vehicle-to-pedestrian (V2P) [3]. 3GPP accepts the project pro-posal for LTE-V in 2015, which indicates the beginning
*Correspondence:[email protected]
Beijing University of Posts and Telecommunications, Xitucheng Road, 100876 Beijing, China
of standardization work. The fundamental part of V2I/N and V2P standardization has been finished in March 2017. As a core of LTE-V, the standardization of V2V has been almost completed in September 2016 and will be totally finished in 2018.
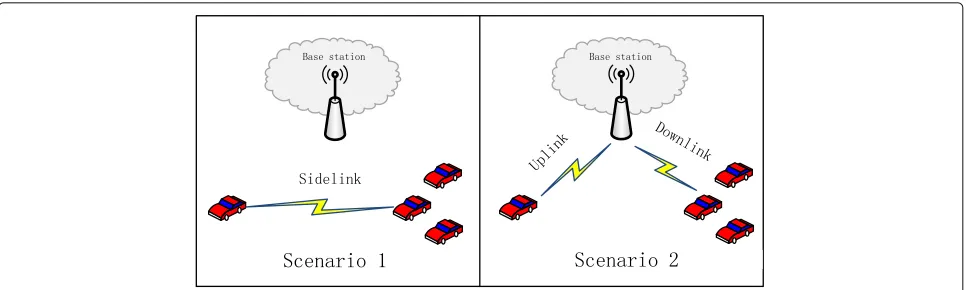
During the standardization of V2V, two major commu-nication scenarios and two operating modes of vehicle user equipment (VUE) are put forward. As shown in Fig.1, VUE transmits data directly to others by a sidelink way without the participation of base station (BS) in sce-nario 1. On the other hand, VUE transmits data to BS firstly and then the BS forwards data to other VUEs in scenario 2. As for two operating modes, one is that all VUEs autonomous select time-frequency resource block to transmit data packets, another is that BS allocates resource for every VUE. Obviously, the VUE selecting resource block autonomously is suitable for communica-tion scenario 1. However, packet collision will be extended because of the less control from BS in this situation. The packet collision means that there are several users select a same time-frequency resource block to transmit data packets. Hence, a proper autonomous resource selection algorithm needs to be designed to help VUEs avoid col-lisions. If every VUE selects a reasonable resource, the probability of different VUEs transmit data at the same
Fig. 1Two communication scenarios for V2V. In scenario 1, data packets are transmitted directly between vehicles. In scenario 2, data packets are transferred by base station
time and in the same sub frequency band is going to be reduced. So, the interference between VUEs will drop steeply and most receivers have a high probability to decode signals successfully.
At the 83rd meeting of 3GPP’s RAN1 group, the autonomous resource selection algorithms are classified into three sets. First, random selection algorithm. Sec-ond, energy sensing algorithm. Third, geography-based (geo-based) selection algorithm [4]. As for energy sens-ing algorithm, some concrete schemes are discussed and proposed. In [5], an algorithm that every VUE detects the average received energy on every resource block before it is ready to transmit a message is proposed. Another energy sensing algorithm based on schedule assignment (SA) decoding is discussed in [6, 7] and is standardized in [8].
The geo-based resource selection algorithm is not specifically determined. There are two types of it, which are called fine geo knowledge selection algorithm and coarse geo knowledge selection algorithm respectively. In fine geo knowledge selection algorithm, as long as the location of a VUE is acquired, the resource block selected by this VUE is also determined [9, 10]. Some contribu-tions introduce serial interference cancellation (SIC) into the fine geo knowledge selection algorithm [11, 12]. In coarse geo knowledge selection algorithm, VUE cannot determine the resource block only by location. It can just determine a sub resource pool instead. Some other resource selection algorithms need to work in coopera-tion to help the VUE select a proper resource block in the corresponding sub resource pool [9, 10, 13–15]. In [16], a novel algorithm that combines the energy sens-ing algorithm and the geo-based algorithm together is proposed and the paper modifies the energy sensing algo-rithm to settle the near-far problem caused by in-band emission. The work in [17] continues to use the resource selection algorithm in device-to-device (D2D) and adds geographic information into this algorithm to apply in
V2V broadcast communication. In [18], the destinations of resource allocation are maximizing the number of con-current transmissions and improving spectrum efficiency in the context of guaranteeing the quality of transmis-sion. The author in [19] intends to utilize the dynamic clustering mechanism to group VUEs in zones and then transforms the resource allocation in each zone into a many-to-one matching game. The optimal matching pro-cedure of bipartite graph has been used in D2D resource allocation in contribution [20,21].
All of above researches for the geo-based resource selec-tion algorithm point out that this type of algorithm can solve the problem of hidden node, save power consump-tion, and so on. The problem of hidden node is indicated in Fig. 2, it means that the VUEs who cannot discover each other have the possibility to select the same resource block. Thus, collision happens and interference raises up. Just like the red VUE and the blue one select a same resource block to send signals to the yellow VUE. Because they cannot find each other on account of the building block and the distance.
However, most contributions above design and analyze their geo-based algorithms in a single special scene, such as Manhattan urban scene which is standardized in [3]. So, they ignore the interference at the boundary when there are several scenes simultaneously. In the meanwhile, none of above researches consider the impact of vehicle den-sity on geo-based algorithms. The size of each geographic area and each sub resource pool in their algorithms is con-stant. When traffic jams take place so that vehicle density is nonuniform, all the existing geo-based algorithms above will perform not good enough in the aspect of reliabil-ity. Therefore, the study of geo-based resource selection algorithm in LTE-V is not sufficient.
Fig. 2The problem of hidden node due to existing buildings. Arrays in this figure represent signals
in the aspect of reliability compared to energy sensing algorithm, and it can be commonly used in various scenes. But we find that the proposed EGRSA is also easy to be impacted by vehicle density and then performs poorly like most existing geo-based algorithms, so we put for-ward the dynamic geo-based resource selection algorithm (DGRSA) to promote the reliability in development. The DGRSA inherits all the advantages of EGRSA and guar-antees a significant possibility for VUEs to decode data packets successfully when vehicle density is nonuniform.
The remainder of this paper is organized as follows. In Section2, we introduce the definition of resource pool and review some resource selection algorithms. The EGRSA and the DGRSA are demonstrated detailed in Sections3
and4, respectively. Experimental method is described in
Section5. Section6 presents the simulation results and discussions. Finally, Section7is the conclusion.
2 Related work
2.1 Resource pool
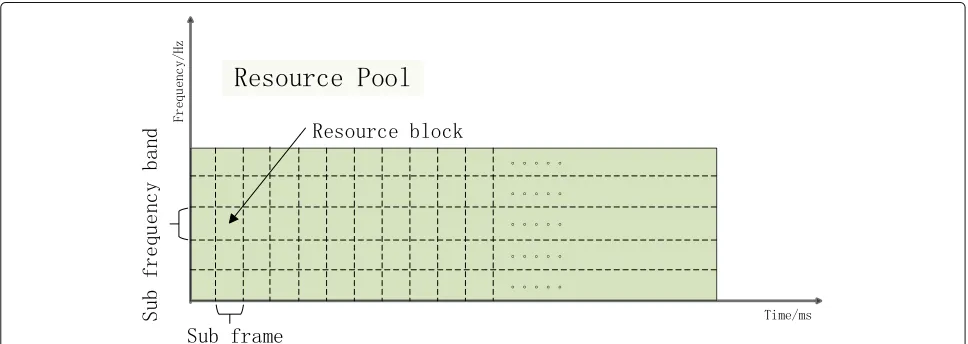
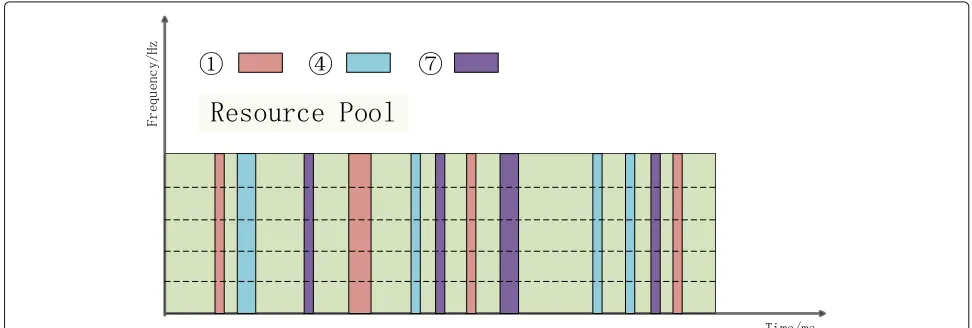
Figure3indicates the model of a time-frequency resource pool. A resource pool consists of lots of resource blocks. A specific subframe and a specific sub frequency band determine a resource block together as can be seen in the figure. When a VUE is ready to transmit a data packet, it has to decide when to transmit and in which frequency band to transmit, namely selecting a resource block in the resource pool. When there are several VUEs select the same resource block, collision happens and these VUEs will interfere with each other. So, the destination of all the
resource selection algorithms is to prevent several VUEs from selecting the same resource block.
2.2 Sensing algorithm
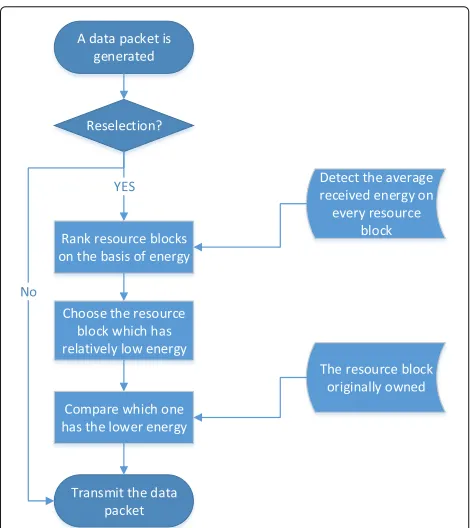
The energy sensing algorithm in contribution [5] can make VUEs avoid collisions effectively. We call it sensing algorithm for short. The main idea of sensing algorithm is that each VUE will detect the average received energy on every resource block, and then rank resource blocks on the basis of energy. The VUE is apt to choose the resource block which has relatively low energy. The resource block with relatively low energy has two explanations, one case is that there is no or just few VUEs use this resource block, another case is that although other VUEs are using this resource block, they are far away from the detect-ing VUE. Both cases are beneficial for the detectdetect-ing VUE to select this resource block to transmit. After that, the VUE compares the resource block selected through rank-ing and the resource block originally owned. Final result is determined according to which one has the lower energy. This algorithm is a distributed procedure, because all of the VUEs have to detect average received energy in the resource pool before transmitting. At the same time, this algorithm profits from the semi-persistent transmission of V2V regulated by 3GPP so that it can avoid collisions and improve the reliability. The process of sensing algorithm is summarized in Fig.4.
Fig. 4Demonstration of every step in the process of sensing algorithm
2.3 Geo-based resource selection algorithm
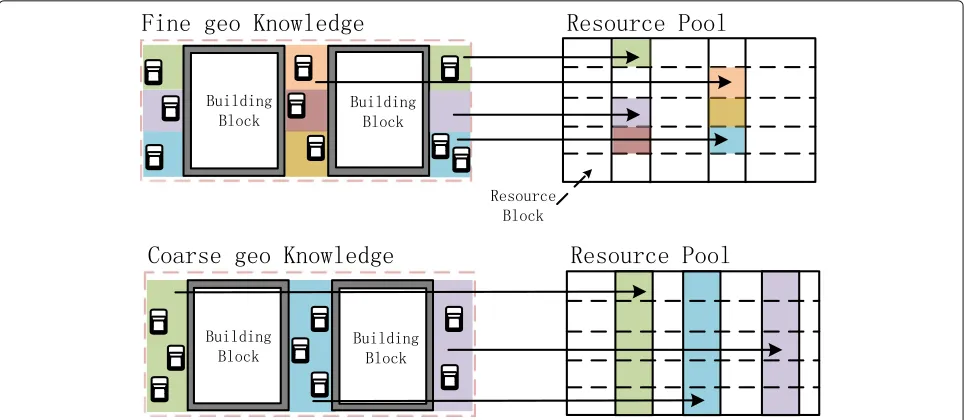
As shown in Fig.5, the main ideas of geo-based resource selection algorithm are dividing the whole region into separate geographic areas and mapping every area into a resource block or a sub resource pool. The partition of the region and the mapping relationships are always pro-vided by BS or other infrastructures. After a VUE gets the information above from BS, it will firstly find which geographic area it is belonging to and then autonomous select a proper resource block through the mapping relationships.
2.3.1 Fine geo knowledge selection algorithm
If every geographic area is partitioned small enough, each area can map into a single resource block, namely fine geo knowledge. In this situation, the VUE decides to select a resource block as soon as it determines the geographic area which it is located in. However, if there are two VUEs located so close to each other that they belong to the same geographic area, it is certain that they select the same resource block and the collision happens. In order to eliminate interference between such two VUEs who are located in one area, the technology of SIC can be used.
2.3.2 Coarse geo knowledge selection algorithm
On the other hand, if every geographic area is partitioned large enough which includes a quantity of VUEs, such area may map into a number of resource blocks. In other words, it maps into a sub resource pool. This way is called coarse geo knowledge. However, the VUE just can deter-mine a sub resource pool only by location in this way. So, it needs to use some extra resource selection algorithms like the sensing algorithm above to select a resource block in the corresponding sub resource pool.
All of our geo-based resource selection algorithms in this paper concentrate in coarse geo knowledge selec-tion algorithm because it is more flexible. The coarse geo knowledge selection algorithm can address the prob-lem of hidden node, save energy consumption, and increase the rate of convergence. These advantages will be demonstrated detailed in combination with our pro-posed algorithms. In addition, this paper uses the stan-dardized Manhattan urban scene [3] to illustrate and simulate our algorithms, but the main ideas and advan-tages of our proposed algorithms are applicable to any scene.
3 The enhanced geo-based resource selection
algorithm
Fig. 5Geo-based resource selection algorithm. Figure5describes the main idea of geo-based resource selection algorithm including fine geo knowledge selection algorithm and coarse geo knowledge selection algorithm. Arrays in this figure represent mapping relationships between geographic areas and resource blocks
3.1 General process of the EGRSA
The general process of EGRSA can be divided into the following steps.
3.1.1 Step 1: partition of urban scene and resource pool
As can be seen in Fig. 6, the Manhattan urban scene consists of nine same-sized blocks. In order to decrease interference, the distance between areas which map into the same sub resource pool should be larger than double vehicle communication distance. By the way, vehicle com-munication distance is around 300 m. Because the size of
Manhattan urban scene is 1299 m×750 m, the amount
of areas which reuse the same sub resource pool is suit-able set to 2. So, we partition the whole scene into 16 geographic areas according to intersections like in Fig.6. The size of each area is marked in red. The numbers in Fig.6 represent the mapping relationships from geo-graphic areas to sub resource pools. For example, both the area which the blue VUE located in and the area which the green VUE located in map into the fourth sub resource pool. It means that the VUEs in these two areas use the same sub resource pool.
The resource pool is divided into eight sub resource pools. Because when we partition the urban scene above, the amount of areas which reuse the same sub resource pool is equal to 2. And there are 16 geographic areas totally in the urban scene. The partition of resource pool follows time division multiplex (TDM) rules as can be seen in Fig. 7. Each sub resource pool randomly rather than sequently occupies a certain amount of subframes in the time domain.
So far, the partition work is finished and the many-to-one mappings from geographic areas to sub resource pools are built successfully. BS or other infrastructures will broadcast these information to VUEs.
3.1.2 Step 2: VUEs autonomous select resource blocks
After receiving the partition information and the map-ping relationships successfully, the VUE gets the loca-tion of itself by global posiloca-tion system (GPS) or other positioning technologies and then judges which area it is in. According to the mapping relationship of this area, the VUE should find out the correspond-ing sub resource pool. Finally, the VUE can select a suitable resource block to transmit data in the sub resource pool through the sensing algorithm described in Section2.
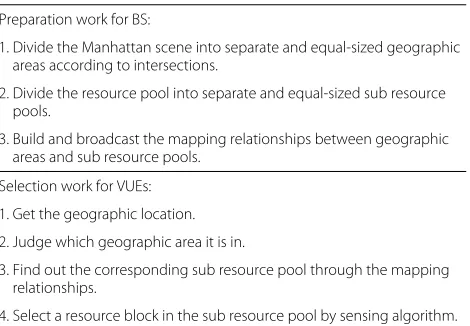
Here, we list the EGRSA procedure in Table 1. The
preparation work is always done by BS or other infrastruc-tures to provide mapping relationships for VUEs. On this basis, VUEs run selection work to select an appropriate resource block in the sub resource pool.
3.2 Advantage analysis
Fig. 6The way of geographic area partition in the urban scene. The red rectangle shows the size of each geographic area. Every number in this figure represents the label of the corresponding sub resource pool of a geographic area
3.2.1 Solve the problem of hidden node
First, the EGRSA can solve the problem of hidden node. In Fig.6, the blue VUE cannot hear the red one because of the severe path loss between different sides of a build-ing. Therefore, the blue one will consider that the resource
block used by red VUE is unoccupied when sensing algo-rithm is used. So, if the blue one selects this resource block, collision takes place in this way. Actually, the blue user and the red user are not far apart, so the VUE like the yellow one may not decode the blue VUE’s messages
Table 1The EGRSA procedure
Preparation work for BS:
1. Divide the Manhattan scene into separate and equal-sized geographic areas according to intersections.
2. Divide the resource pool into separate and equal-sized sub resource pools.
3. Build and broadcast the mapping relationships between geographic areas and sub resource pools.
Selection work for VUEs:
1. Get the geographic location.
2. Judge which geographic area it is in.
3. Find out the corresponding sub resource pool through the mapping relationships.
4. Select a resource block in the sub resource pool by sensing algorithm.
in right on account of the interference from the red user and vice versa.
On the contrary, the problem is easy to be settled in EGRSA. It is obvious that the blue one and the red one use different sub resource pools, so that they would not select the same resource block when EGRSA is utilized. The VUE who may be in collision with the blue one is in the same area with it, or in the area where the green VUE located. If there is a VUE in the same area with the blue one, the resource block it uses will have a high level of energy in certain. Consequently, the blue VUE is not going to select this resource block, so the collision is avoided. In another case, the VUEs in the same area with the green vehicle are possible to collide with the blue one, because they use the same sub resource pool with blue VUE and they cannot hear it in such a distance. However, these VUEs are far apart more than double vehicle communi-cation distance to the blue one so that the interference from them can be neglected although collision happens. Therefore, the problem of hidden node is addressed.
3.2.2 Save energy consumption and accelerate convergence
Second, if a VUE uses the sensing algorithm, it has to detect the entire resource pool. But the VUE only needs to detect a sub resource pool instead when it performs the EGRSA. This algorithm saves energy consumption. In addition, sensing algorithm is a selfish procedure. Every VUE tries best to select the most suitable resource block from its own point of view, but the simulation result proves that all of VUEs can find a proper resource block after some time. In other words, the sensing algorithm needs time to converge. Hence, the smaller the resource pool is, the shorter convergence time of the algorithm needs.
3.2.3 Eliminate the boundary interference
Third, we consider a more practical scene where there are several Manhattan urban scenes simultaneously. It’s
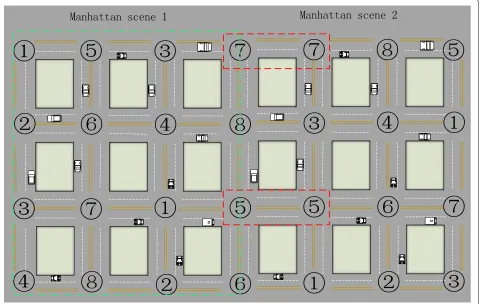
improper that the partition of all scenes is managed by a same BS. Hence, when there are two Manhattan scenes adjacent to each other and the partition of these two scenes is done by different BSs, the problem in Fig.8is generated. Both the two areas belong to different Man-hattan scenes mapped into the same fifth sub resource pool coincidentally, and the distance between them is quite close. So, if the VUEs in these two areas select the same one resource block, a severe interference will appear, namely the boundary interference. The problem is also indicated in the situation of the seventh sub resource pool in this figure.
In order to settle this issue, the subframes are deter-mined randomly rather than sequently in one sub resource pool in our proposed EGRSA. If the partition work of two Manhattan scenes is done by different BSs as shown in Fig.8, subframes selected in these two scenes to form the fifth sub resource pool are also different. Therefore, although the two areas are mapped into the same fifth sub resource pool, they use different subframes actually. Col-lisions are avoided efficiently in this way so that boundary interference is eliminated.
With eliminating the boundary interference, we can divide any scene into several sub scenes like the Man-hattan urban scene and use the EGRSA in every sub-scene separately. Therefore, although the EGRSA is designed and illustrated in Manhattan urban scene, it is able to be used in any scene actually. This advan-tage makes the EGRSA applicable in more general scenes.
4 The dynamic geo-based resource selection
algorithm
4.1 Demand analysis
The EGRSA and other geo-based resource selection algo-rithms are easy to be impacted by vehicle density. In these schemes, all the sub resource pools are equal-sized, and the size cannot be adjusted. This will lead to some troubles as follows when traffic jams take place.
• The number of VUEs in a jam area may be much larger than the amount of resource blocks in the corresponding sub resource pool. The resource blocks are not enough, so collisions are bound to be generated in this situation no matter what kind of algorithm is performed.
• There may be few VUEs in an unblocked geographic area. If this unblocked area still maps into a
normal-sized sub resource pool, most of resource blocks in this sub resource pool are unoccupied so that resource blocks are wasted.
Fig. 8System model for several urban scenes. Description of the problem of boundary interference when there are several urban scenes. Each number in this figure represents the label of the corresponding sub resource pool of a geographic area. Boundary interference exists in the geographic areas with red markers
need such many resource blocks with respect to the jam area. So, resource wasting still exists.
These problems will increase the possibility of collision and reduce the utilization efficiency of resource. As we know, traffic jams are common in our daily life, so the problems above should be addressed. Thus, this paper proposes the DGRSA to guarantee the reliability when vehicle density is in a non-uniformity distribution because of traffic jam.
4.2 General process of the DGRSA
The DGRSA is modified from EGRSA, and it is an opti-mized version. So, the geographic division of Manhattan scene is the same as that of the EGRSA. We just add some extra steps in the preparation work of EGRSA to adjust the mapping relationships and the size of each sub resource pool. Table2lists the procedure of DGRSA and the dif-ference in preparation work can be reflected clearly. The newly added steps will be demonstrated in detail after Table2.
4.2.1 Divide geographic areas into two groups dynamically
In EGRSA, we mention that the number of areas which reuse the same sub resource pool is suitable set to 2
because of the vehicle communication distance and the size of Manhattan urban scene. Therefore, all of geo-graphic areas are also divided into two same-sized groups here. We define that the size of each group is M and Mis equal to 8 obviously. Every area will find a partner
Table 2The DGRSA procedure
Preparation work for BS:
1. Divide the Manhattan scene into separate and equal-sized geographic areas according to intersections.
2. Divide geographic areas into two groups dynamically.
3. Decide the geographic area pair to reuse the same sub resource pool by optimal matching.
4. Adjust the size of each sub resource pool according to the density of VUEs.
5. Build and broadcast the mapping relationships between geographic areas and sub resource pools.
Selection work for VUEs:
1. Get the geographic location.
2. Judge which geographic area it is in.
3. Find out the corresponding sub resource pool through the mapping relationships.
4. Select a resource block in the sub resource pool by sensing algorithm.
in another group to become the geographic area pair to reuse the same sub resource pool. The grouping rules are indicated below.
• The areas in a same group should distribute concentrated and close to each other. Because they will map into different and orthogonal sub resource pools.
• The number of jam areas in two groups should be roughly equal so as to decrease the possibility of the jam area and the unblocked area mapping into a same sub resource pool.
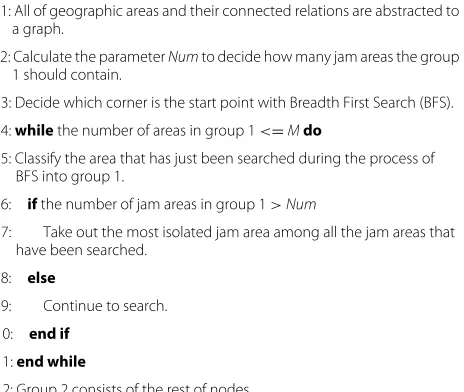
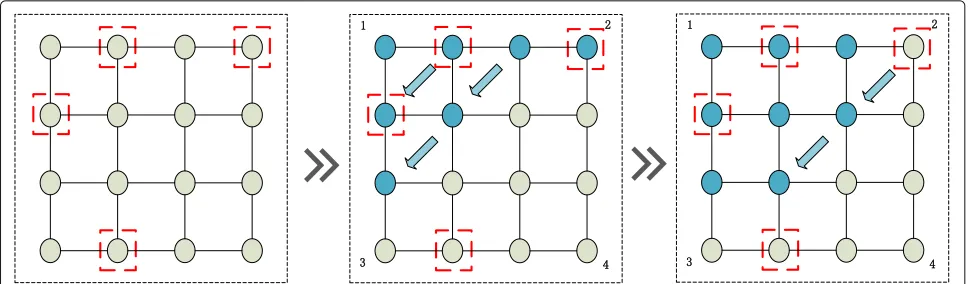
On the basis of these rules, we put forward a dynamic grouping method which is listed in Table3and an example of this grouping method is demonstrated in Fig.9.
First, all the geographic areas and their connected rela-tions are abstracted to a graph. As can be observed in Fig. 9, every node represents a geographic area. Nodes with red markers are the jam areas; hence, there are four jam areas in our example. Second, a parameterNumis cal-culated to decide how many jam areas the group 1 should contain.
Num= Numtotal/2 (1)
Numtotalis the total number of jam areas, and is the
top integral function. In Fig.9, theNumis equal to 2 obvi-ously. In other words, every group is going to contain two jam areas in this example.
After that, the breadth first search (BFS) is used to ensure areas in the same group close to each other. The BFS is a common search strategy of the connected graph and it searches nodes in a radial way from a start point. So, we have to decide a start point of BFS, four corners of the abstracted graph are ideal candidates. Meanwhile, in order to search for more jam areas in our method, one of
Table 3The dynamic grouping method
1: All of geographic areas and their connected relations are abstracted to a graph.
2: Calculate the parameterNumto decide how many jam areas the group 1 should contain.
3: Decide which corner is the start point with Breadth First Search (BFS).
4:whilethe number of areas in group 1<=Mdo
5: Classify the area that has just been searched during the process of BFS into group 1.
6: ifthe number of jam areas in group 1>Num
7: Take out the most isolated jam area among all the jam areas that have been searched.
8: else
9: Continue to search.
10: end if
11:end while
12: Group 2 consists of the rest of nodes.
the four corners is determined based on the distribution of jam areas. A simple voting system is built. Every jam area has four votes for the four corners. The distance between a jam area and a corner is closer, the value of the vote is larger. In our case, the top left corner is selected through the voting system.
Then, the process of BFS begins and every area that has just been searched is classified into group 1. The nodes are gradually colored in corresponding in Fig.9. When the number of jam areas in group 1 is larger thanNum, the most isolated jam area will be taken out. The most isolated jam area is calculated as:
arg max
Ntemp is the amount of jam areas that have been
searched.iandjare the index of jam areas. So,xiandyi
represent the horizontal and vertical coordinate respec-tively of theith jam area. The most isolated jam area is the farthest area to others.
The BFS process will continue until the size of group 1 is equal toM. And group 2 consists of the rest of areas. The grouping result of our case is also indicated in Fig.9.
All in all, this method will classify all of areas into two same-sized groups during the process of BFS, and the number of jam areas in each group is roughly equal.
4.2.2 Decide the geographic area pair to reuse the same sub resource pool by optimal matching
After dividing geographic areas into two groups, the next thing is to make every area in group 1 find out a unique area in group 2 to reuse the same sub resource pool, namely deciding geographic area pairs between two groups. The areas which reuse the same sub resource pool have to obey the rules as follows:
• If areai reuses with area j, they belong to different groups.
• If areai reuses with area j, it is not allowable that another areak reuses with i or j.
On this basis, we transform the problem of deciding geographic area pairs between two groups into a matching game in a bipartite graph like in Fig.10.
Fig. 9The process of the proposed dynamic grouping method. Each node represents a geographic area. Nodes with red maker are jam areas. Two geographic area groups are distinguished with different colors finally
be used to search out an optimal matching result. The result tells us which two areas are most suitable to reuse the same sub resource pool.
To set the weight rationally, two factors are considered. One is distance factor, another is vehicle density factor.
The distance factor is considered firstly. The distance between areas which reuse the same sub resource pool should be as far as possible to weaken the impact of hidden node. So, when the distance between two areas is far, the weight between corresponding nodes ought to be large. To facilitate calculation, the normalization has to be done
Fig. 10An example of a matching in a bipartite graph. Each node represents a geographic area in a geographic area group. Green lines are one of the matching results
meanwhile. Therefore, we define the weight for distance:
Lij1=
Distanceij
Distancemax
(3)
Lij1represents the weight for distance between node i
and nodej.Distanceijis the distance between areaiand
areaj,Distancemaxis the maximal distance between
geo-graphic areas. The distance between areas is greater, the according weight is larger in this equation. Only the areas which are located far enough to each other can become the geographic area pair, because the weight between them is large enough.
Secondly, vehicle density factor should also be consid-ered in order to avoid wasting resource blocks. We hope that the areas matched successfully are not only far from each other but also having approximately the same vehi-cle density. So, when the vehivehi-cle density of two areas is close, the weight between corresponding nodes ought to be large. The weight for density is presented:
Lij2=
min(densityi,densityj)
max(densityi,densityj)
(4)
Lij2 represents the weight for density between node i
and nodej,densityianddensityjare the vehicle density in
areaiand areaj, respectively. If the vehicle density of area iand areajis similar, theLij2approaches 1. This weight is
useful to prevent a jam area and an unblocked area from mapping into a same sub resource pool. Because the vehi-cle density of them is very different, the according weight approaches 0.
The final weight between nodeiand nodejis proposed below:
Lij=w1∗Lij1+w2∗Lij2
i∈ {1, 2, 3. . .M} j∈ {1, 2, 3. . .M}
w1 and w2 are the proportion of distance factor and
vehicle density factor. The optimal matching result is com-puted through the classical KM algorithm in graph theory:
arg max
This optimal result is a group of node pairs which can maximize the sum of each pair’s weight. Hence, this result is also a group of geographic area pairs and the areas in each pair are the most suitable to reuse a same sub resource pool in a global perspective. ik–jk represents
the kth geographic area pair, and M is the amount of geographic pairs which is equal to the size of every group. In a word, every area in group 1 can find out a global optimal area in group 2 to become a geographic area pair and reuse the same sub resource pool after this step. And the areas in each pair have approximately the same vehicle density and are as far apart as possible.
4.2.3 Adjust the size of each sub resource pool according to the density of VUEs
As mentioned above, the areas which map into a same sub resource pool are adjusted by grouping and matching. Although the density of VUEs in the two areas matched together is similar, the density of VUEs between geo-graphic area pairs is different. Obviously, if two jam areas become a geographic area pair, this pair needs a bigger sub resource pool than other pairs. So, we adjust the size of each sub resource pool according to the vehicle density in each pair next. First, we calculate the maximum value of vehicle density in each area pair:
Nk =max(densityik,densityjk)
k∈ {1, 2, 3. . .M} (7)
densityik anddensityjk are the vehicle density in areaik
and area jk, respectively. And the geographic pair ik–jk
consists of areaikand areajk. It is easy to understand that
if the sub resource pool is big enough for the area inclu-sive of more vehicles, it is enough for the another area certainly. So, we use the maximum value to divide the resource pool. The size of each sub resource pool is given as:
Rk denotes the number of subframes occupied by sub
resource pool k which is corresponding to geographic area pair ik–jk, and Ttotal is the number of total
sub-frames in the resource pool. The division of resource pool still obeys TDM rules and every sub resource pool ran-domly occupies different amounts of subframes in the time domain.
So far, the mapping relationships and the size of each sub resource pool are adjusted based on vehicle density. The BS can broadcast these information to VUEs after these steps.
4.3 Advantage analysis
The DGRSA inherits all the advantages of EGRSA. It can also be used in any scene as long as divide the scene into subscenes like the Manhattan scene and use DGRSA in each sub scene separately. Besides, if vehi-cle density in a subscene is nonuniform, the DGRSA is still expected to perform well in the aspects of reliabil-ity and resource utilization. Because it can adjust the areas which reuse the same sub resource pool and the size of corresponding sub resource pool based on vehicle density.
The newly added steps have their advantages respec-tively.
• If all jam areas distribute in a same group, each jam area will surely select an unblocked area to reuse the same sub resource pool so that resource blocks are wasted. Hence, we design the dynamic grouping method to make sure the number of jam areas in each group roughly equal to avoid this problem.
• When we set the weight between nodes to calculate optimal matching result, the weight for distance makes the areas which are close to each other cannot become the geographic pair so that the problem of hidden node is addressed. In the meanwhile, the weight for density can avoid a jam area reusing with an unblocked area so that the problem of resource wasting is addressed.
• By adjusting the size of each sub resource pool based on vehicle density in each matched geographic area pair, the possibility of collisions will be decreased and the utilization of resource blocks is also more reasonable.
5 Experimental
The proposed EGRSA and DGRSA are illustrated and analyzed detailed in above sections. It is necessary to eval-uate the performance of them through building a system level simulation platform.
Fig. 11System model for a Manhattan urban scene. Numbers in this figure are the labels of geographic areas
or 2400 VUEs and 15 km/h. All the VUEs are deployed in urban scene according to spatial Poisson process and should obey traffic rules. A VUE goes straight with a prob-ability of 0.5 and turns left or right with a probprob-ability of 0.25, respectively.
As for channel modeling, Winner+ Channel Model is utilized [3]. We choose the B1 case in this channel model, and the antenna height is set to 1.5 m. The channel fad-ing and the position of VUEs are updated every 100 ms. All of VUEs transmit data packets periodically with the period of 100 ms, and the message sequence is a 300-bytes message followed by four 190-bytes messages. The ini-tial message production time of every VUE is generated randomly.
The total frequency bandwidth is 10 MHz. In our sim-ulation, the total bandwidth is divided into five sub fre-quency bands. In the time domain, a subframe represents
1 ms, so there are 100 subframes in one transmit period. Obviously, the total amount of resource blocks is 500 in this way. Other parameters are listed in Table4.
Algorithms related to EGRSA are simulated and com-pared in a normal Manhattan urban scene as introduced above, with the pattern of 600 VUEs and 60 km/h. In order to simulate the scene which is similar to daily life, a modified Manhattan urban scene which includes some traffic jams is designed and realized. Algorithms related to DGRSA are emulated and compared in the modified one.
Table 4Simulation parameters
Carrier frequency 6 GHz
Bandwidth 10 MHz
Number of carriers Single carrier
Maximum transmit power 23 dBm
Antenna height 1.5 m for vehicles
Antenna pattern Omni 2D
Antenna gain 3 dBi for vehicle UE
Number of antennas 1 TX and 2 RX antennas
Shadowing distribution Log-normal
Shadowing standard deviation 3 dB for LOS and 4 dB for NLOS
Decorrelation distance 10 m
Power spectral density of white
gaussian noise −174 dBm
Number of lanes 2 in each direction (4 lanes in total in
each street)
Vehicle density 2.5 s×absolute vehicle speed
6 Simulation results and discussions
In the following, the system level simulation results are presented.
6.1 Results and discussions for EGRSA
Figure 12 presents the PRR curve that changes with
distance for EGRSA in a Manhattan urban scene. We select the sensing algorithm mentioned above and random selection algorithm as comparisons. In random selection algorithm, each VUE selects a resource block randomly.
0 50 100 150 200 250 300
Fig. 12The PRR of EGRSA. The packet reception ratio (PRR) curve changes with distance. Sensing algorithm and random selection algorithm are selected as comparisons. The line with blue circles represents the proposed enhanced geo-based resource selection algorithm (EGRSA). The line with red stars represents the sensing algorithm. The line with yellow triangles represents the random selection algorithm
As can be observed in this figure, both sensing algo-rithm and EGRSA are capable of increasing PRR with respect to random selection algorithm. This can be explained that both of them can avoid collisions by energy sensing. Meanwhile, the EGRSA obtains a stable gain about 2–3% than sensing algorithm because it can solve the problem of hidden node according to the analysis in Section3. It means that the VUE which uses EGRSA is more likely to decode a data packet successfully. The gain between EGRSA and sensing algorithm can be ampli-fied further if the detecting precision of sensing algorithm decreases. In our simulation, detecting precision is decu-ple than noise. When the power of signal is decudecu-ple than noise, the detecting VUE will consider the resource block is occupied.
Boundary interference is not a universal phenomenon, and it only involves a part of VUEs on the boundary of each scene. Hence, it cannot be reflected in PRR obviously because PRR is calculated based on all VUEs. In order to prove that EGRSA can eliminate boundary interference, we calculate out the distribution of boundary collision pairs during the simulation in Fig.13.
Because boundary interference is a typical issue in geo-based algorithm, two geo-geo-based algorithms in the follow-ing are selected as comparison schemes. In [9], a resource block is determined randomly in a sub resource pool when geo-based resource selection algorithm is utilized. We call it random geo-based resource selection algorithm
1 2 3 4
The number of boundary collision pairs on a resource block
0
The number of each case during the simulation
SGRSA RGRSA EGRSA
(RGRSA). Intel [14] discusses the combination of sensing algorithm and geo-based algorithm but it does not take the boundary interference into consideration. We call it sensing geo-based resource selection algorithm (SGRSA). We implement them in a Manhattan urban scene.
A boundary collision pair represents two VUEs satis-fying the three conditions below. First, they are located on the boundary of different scenes. Second, they use the same resource block so that they collide with each other. Third, the distance between them is smaller than double vehicle communication range. The vehicle communica-tion range is equal to 300 m in urban. Thus, if a boundary collision pair exists, a severe interference between the two VUEs in this pair will appear.
The numbers on horizontal axis of Fig.13indicate how many boundary collision pairs exist on a resource block. The vertical axis represents the number of each case which occurred during the simulation. In this figure, the number of boundary collision pair occurrence is reduced obviously when EGRSA is used. EGRSA and SGRSA are superior to RGRSA because some boundary collisions are avoided based on energy sensing. And EGRSA shows a better performance than SGRSA on account of random-izing each sub resource pool. Therefore, the EGRSA can reduce boundary collisions and eliminate boundary inter-ference to some degree but most of geo-based algorithms cannot.
6.2 Results and discussions for DGRSA
For the sake of simulating traffic jams in urban, vehicles are deployed centralized in some specific areas as shown in Fig. 14. It is observed that traffic jams take place in areas 1, 2, 7, and 8. The red line in this figure represents
0 2 4 6 8 10 12 14 16
Index of areas 0
20 40 60 80 100 120 140 160
Amount of VUEs
Traffic jam scene
The size of each sub resource pool in EGRSA
Fig. 14Calculation of the amount of VUEs in every geographic area in the traffic jam scene. The red line in this figure represents the size of each sub resource pool when sub resource pools are divided equally just like in enhanced geo-based resource selection algorithm (EGRSA)
the size of each sub resource pool when EGRSA is used. As mentioned above, each sub resource pool is divided equally in EGRSA. There are 500 resource blocks and 8 sub resource pools in the simulation, so the size is roughly equal to 62. The amounts of VUEs in the above four areas are much larger than the red line. It means that colli-sions must be generated among VUEs in these four areas when EGRSA is performed because resource blocks are not enough. This is a major problem of EGRSA as well as some other geo-based resource selection algorithms when vehicle density is nonuniform. The proposed DGRSA can solve this problem efficiently.
In Fig. 15, there are 16 stars representing our 16 geo-graphic areas. And the stars around with a red circle are the jam areas in Fig. 14. Indexes of them are 1, 2, 7, and 8 in accordance with the above. After performing the proposed dynamic grouping method, two geographic area groups are distinguished with different colors in the figure. We can find that every group contains two jam areas and the areas in the same group are close to each other. The design intension of our dynamic grouping method is achieved.
The PRR of DGRSA in different cases is presented in Figs.16, 17, and18. Three geo-based algorithms are selected as comparisons, namely EGRSA, RGRSA, and SGRSA.
In the three figures, the PRR of EGRSA is always roughly equal to the PRR of SGRSA. This is because the difference between EGRSA and SGRSA is that EGRSA can eliminate boundary interference, but the boundary interference is not able to be reflected obviously in PRR as we explained
0 50 100 150 200 250 300
Fig. 16The PRR of DGRSA when the number of VUEs is 600 in the jam scene. The packet reception ratio (PRR) curve changing with distance when jam areas are areas 1, 2, 7, and 8 and the number of vehicle user equipments (VUEs) is 600. Four geo-based algorithms, namely random geo-based resource selection algorithm (RGRSA), sensing geo-based resource selection algorithm (SGRSA), the proposed enhanced geo-based resource selection algorithm (EGRSA), and the proposed dynamic geo-based resource selection algorithm (DGRSA) are compared in this figure. The line with red circles represents the proposed DGRSA. The line with blue stars represents the proposed EGRSA. The line with purple triangles represents the SGRSA. The line with yellow triangles represents RGRSA
0 50 100 150 200 250 300
Fig. 17The PRR of DGRSA when the number of VUEs is 900 in the jam scene. Figure17shows the packet reception ratio (PRR) curve changing with distance when jam areas are areas 1, 2, 7, and 8 and the number of vehicle user equipments (VUEs) is 900. Four geo-based algorithms, namely random geo-based resource selection algorithm (RGRSA), sensing geo-based resource selection algorithm (SGRSA), the proposed enhanced geo-based resource selection algorithm (EGRSA), and the proposed dynamic geo-based resource selection algorithm (DGRSA), are compared in this figure. The line with red circles represents the proposed DGRSA. The line with blue stars represents the proposed EGRSA. The line with purple triangles represents the SGRSA. The line with yellow triangles represents RGRSA
0 50 100 150 200 250 300
Fig. 18The PRR of DGRSA when the number of VUEs is 1200 in the jam scene. The packet reception ratio (PRR) curve changes with distance when jam areas are areas 1, 2, 7, and 8 and the number of vehicle user equipments (VUEs) is 1200. Four geo-based algorithms namely random geo-based resource selection algorithm (RGRSA), sensing geo-based resource selection algorithm (SGRSA), the proposed enhanced geo-based resource selection algorithm (EGRSA), and the proposed dynamic geo-based resource selection algorithm (DGRSA) are compared in this figure. The line with red circles represents the proposed DGRSA. The line with blue stars represents the proposed EGRSA. The line with purple triangles represents the SGRSA. The line with yellow triangles represents RGRSA
before. And the performance of DGRSA, EGRSA, and SGRSA has the advantage with respect to RGRSA due to energy sensing.
In Fig.16, we find that the performance of EGRSA and SGRSA drops rapidly. The PRR at 100 m is around 85% in the jam scene when there are 600 VUEs totally. It sug-gests that if there is a VUE located 100 m away from the transmitter, the probability of this VUE to decode the data packet correctly is only around 85%, which is not good enough for the Internet of Vehicles as lots of safety mes-sages need to be sent. While in DGRSA, the PRR can approach 95% when the communication distance is 100 m and the VUEs’ amount is equal to 600. Most of VUEs can communicate with each other normally and regularly when DGRSA is utilized. The similar result is also found in Figs.17 and18. DGRSA keeps a relatively high per-formance, and the other three schemes does not perform good enough.
growing total amount, and these geographic area pairs are allocated with more resource blocks. The efficiency of resource blocks rises up in DGRSA.
By the way, the jam areas in Fig. 15are concentrated so that traffic congestion is extremely serious especially when quite a lot of VUEs are deployed in the scene. In this situation, VUEs near from each other in jam areas will achieve a similar result once they detect the average received energy on resource blocks in EGRSA or SGRSA. Collisions among these VUEs take place because all of these VUEs are likely to select a resource block which has relatively low energy based on the similar result. There-fore, the PRR of EGRSA and SGRSA decreases and is lower than the PRR of RGRSA when the communication distance is less than 50 m in Fig.18.
All in all, the DGRSA performs better than other geo-based algorithms in the jam scene because vehicle density is taken into account in DGRSA. The PRR of it maintains in a good condition. Most of data packets are likely to be decoded successfully.
For guaranteeing the universality of the simulation, the number of jam areas is increased to 5 and we choose the areas 1, 3, 6, 12, and 13 to become jam areas instead. The PRR of DGRSA and other geo-based algorithms is calculated again.
In Fig.19, the 16 geographic areas are also divided into 2 groups. But because the number of jam areas is an odd number, a jam area has to match with an unblocked area. Some resource blocks are wasted. This is a defect of DGRSA.
Fig. 19The grouping result of the proposed dynamic geo-based resource selection algorithm (DGRSA) when jam areas are area 1, 3, 6, 12, and 13. There are 16 stars representing our 16 geographic areas. And the stars around with red circle are the jam areas. After performing the proposed dynamic grouping method, two geographic area groups are distinguished with different colors in the figure
Figure20shows the same trend with Fig.16in which the DGRSA achieves a gain with respect to other geo-based algorithms in the jam scene. When the communication distance is 100 m and the amount of VUEs is 600, the PRR of DGRSA is still close to 95% which is larger than the PRR of other schemes. With the increasing num-ber of VUEs, the PRR of DGRSA keeps in a high level as shown in Figs. 21and22. The crushing resistance of DGRSA remains meanwhile. The DGRSA still can make VUEs keep a high probability of decoding data packets successfully.
Besides, the jam areas in Fig. 19are dispersive, which is different with those in Fig.15. The PRR of EGRSA and
SGRSA is not lower than the PRR of RSRSA in Fig. 22
because traffic congestion is relatively assuasive when quite a lot of VUEs are deployed.
7 Conclusions
The paper puts forward an enhanced geo-based resource selection algorithm firstly. In this algorithm, each VUE can autonomous select a resource block by location after receiving partition information and mapping relationships from the base station. To compensate its weakness when traffic jams take place, the dynamic geo-based resource selection algorithm is proposed which utilizes the theory of optimal matching in a bipartite graph and adjusts the
0 50 100 150 200 250 300
0 50 100 150 200 250 300
Fig. 21The PRR of DGRSA when the number of VUEs is 900 in the jam scene. The packet reception ratio (PRR) curve changes with distance when jam areas are areas 1, 3, 6, 12, and 13 and the number of vehicle user equipments (VUEs) is 900. Four geo-based algorithms, namely random geo-based resource selection algorithm (RGRSA), sensing geo-based resource selection algorithm (SGRSA), the proposed enhanced geo-based resource selection algorithm (EGRSA) and the proposed dynamic geo-based resource selection algorithm (DGRSA), are compared in this figure. The line with red circles represents the proposed DGRSA. The line with blue stars represents the proposed EGRSA. The line with purple triangles represents the SGRSA. The line with yellow triangles represents RGRSA
0 50 100 150 200 250 300
Fig. 22The PRR of DGRSA when the number of VUEs is 1200 in the jam scene. The packet reception ratio (PRR) curve changes with distance when jam areas are areas 1, 3, 6, 12, and 13 and the number of vehicle user equipments (VUEs) is 1200. Four geo-based algorithms, namely random geo-based resource selection algorithm (RGRSA), sensing geo-based resource selection algorithm (SGRSA), the proposed enhanced geo-based resource selection algorithm (EGRSA), and the proposed dynamic geo-based resource selection algorithm (DGRSA), are compared in this figure. The line with red circles represents the proposed DGRSA. The line with blue stars represents the proposed EGRSA. The line with purple triangles represents the SGRSA. The line with yellow triangles represents RGRSA
size of each sub resource pool based on vehicle density. The simulation results suggest that the enhanced geo-based resource selection algorithm obtains a stable gain than sensing algorithm in PRR, and it can reduce the num-ber of boundary collisions. So, the VUE which uses the enhanced geo-based resource selection algorithm is more likely to decode a data packet successfully and this algo-rithm can be used in more general scenes. Meanwhile, the dynamic geo-based resource selection algorithm is superior to the enhanced geo-based resource selection algorithm as well as some other geo-based algorithms in the performance of PRR especially when traffic jams come up. And this dynamic algorithm has a kind of crushing resistance. So, it is able to guarantee the com-munication quality between VUEs even if vehicle density is nonuniform. In addition, the geo-based resource selec-tion algorithms have the fast rate of convergence and the low energy consumption. All of our algorithms are pro-posed and simulated in a Manhattan urban scene which is regulated by 3GPP. The corresponding schemes which are designed and simulated in real map are left for our future work.
Abbreviations
3GPP: Third-generation partnership project; 5G: Fifth generation; BFS: Breadth first search; BS: Base station; D2D: Device-to-device; DGRSA: Dynamic geo-based resource selection algorithm; EGRSA: Enhanced geo-based resource selection algorithm; GPS: Global position system; ITS: Intelligent transportation system; KM: Kuhn-Munkres; LTE: Long-term evolution; LTE-V: long-term evolution-vehicle; MANET: Mobile ad hoc network; PRR: Packet reception ratio; RSU: Road side unit; SA: Schedule assignment; SIC: Serial interference cancellation; TDM: Time division multiplex; V2I/N: vehicle-to-infrastructure/network; V2P: Vehicle-to-pedestrian; V2V: Vehicle-to-vehicle; VANET: Vehicular ad hoc network; VUE: Vehicle user equipment
Funding
This work has been sponsored by the National Science Foundation of China (61601043).
Availability of data and materials
Please contact the corresponding author at [email protected].
Authors’ contributions
Both authors read and approved the final manuscript.
Author’s information
Gu Xinyu received her Ph.D. degree in Signal and Information Processing from Beijing University of Posts and Telecommunications, Beijing, China, in 2005. From July 2005 to April 2013, she was a senior research engineer in Ericsson Research Institute for the research on wireless communication. She had more than 20 patents. She is currently an Associated Professor of the School of Information and Telecommunication Engineering, Beijing University of Posts and Telecommunications. Her research interests are in the areas of future network modeling and intelligent optimization. Her research is granted by the Young Scientist Fund of the Natural Science Foundation of China, the State Major Science and Technology Special Projects, and industry companies China Mobile, ZTE, and others.
Competing interests
The authors declare that they have no competing interests.
Publisher’s Note
Springer Nature remains neutral with regard to jurisdictional claims in published maps and institutional affiliations.
Received: 6 January 2018 Accepted: 3 July 2018
References
1. L Bariah, D Shehada, E Salahat, CY Yeun, inVehicular Technology Conference. Recent advances in vanet security: a survey, (2016), pp. 1–7 2. K Snehal, AR Deshmukh, SS Dorle, A survey of routing protocols for
vehicular ad-hoc networks. Int. J. Comput. Appl.139, 34–37 (2016) 3. 3GPP, inRelease 14 V14.0.0. Tr 36.885 Study on LTE-based V2X services,
(2016).http://www.3gpp.org/ftp
4. 3GPP, in3GPP TSG RAN WG1 #83. R1-160236 Final report of 3GPP TSG RAN WG1 #83 v1.0.0, (2015).http://www.3gpp.org/ftp
5. I Qualcomm, in3GPP TSG RAN WG1 #85. R1-164419 Details of sensing for V2V, (2016).http://www.3gpp.org/ftp
6. 3GPP, in3GPP TSG RAN WG1 #85. R1-166056 Final report of 3GPP TSG RAN WG1 #85 v1.0.0, (2016).http://www.3gpp.org/ftp
7. 3GPP, in3GPP TSG RAN WG1 #86. R1-1608562 Final report of 3GPP TSG RAN WG1 #86 v1.0.0, (2016).http://www.3gpp.org/ftp
8. 3GPP, inRelease 14 V14.4.0. Ts 36.213 Evolved universal terrestrial radio access (e-utra); physical layer procedures, (2017).http://www.3gpp. org/ftp
9. C Intel, in3GPP TSG RAN WG1 #84. R1-160431 Support of geo-based transmission schemes for V2V communication, (2016).http://www.3gpp. org/ftp
10. ZTE, in3GPP TSG RAN WG1 #85. R1-164961 Geo-based resource allocation for V2V, (2016).http://www.3gpp.org/ftp
11. M General, in3GPP TSG RAN WG1 #84. R1-161195 Geo based resource scheduling for V2V communication, (2016).http://www.3gpp.org/ftp 12. M General, in3GPP TSG RAN WG1 #84bis. R1-163308 Geo based resource
scheduling for V2V with accurate geographical information, (2016). http://www.3gpp.org/ftp
13. C Intel, in3GPP TSG RAN WG1 #83. R1-156688 On support of geo-based transmission for V2V communication, (2015).http://www.3gpp.org/ftp 14. C Intel, in3GPP TSG RAN WG1 #84bis. R1-162933 On combination of
sensing and geo-based transmission techniques for sidelink V2V communication, (2016).http://www.3gpp.org/ftp
15. H HiSilicon, in3GPP TSG RAN WG1 #84. R1-160307 UE autonomous resource selection, (2016).http://www.3gpp.org/ftp
16. J Yang, B Pelletier, B Champagne, inVehicular NETWORKING Conference. Enhanced autonomous resource selection for LTE-based V2V communication, (2017), pp. 1–6
17. X Zhang, Y Shang, X Li, J Fang, inVehicular Technology Conference. Research on overlay D2D resource scheduling algorithms for V2V broadcast service, (2017), pp. 1–5
18. S Zhang, Y Hou, X Xu, X Tao, inIEEE International Symposium on Personal, Indoor, and Mobile Radio Communications. Resource allocation in D2D-based V2V communication for maximizing the number of concurrent transmissions, (2016), pp. 1–6
19. MI Ashraf, M Bennis, C Perfecto, et al, inGLOBECOM Workshops. Dynamic proximity-aware resource allocation in vehicle-to-vehicle (V2V) communications (IEEE, 2016), pp. 1–6
20. X Gu, M Zhao, L Ren, D Wu, S Nie, A two-stages relay selection and resource allocation with throughput balance scheme in relay-assisted D2D system. Mob. Networks Appl.22, 1–13 (2017)