Article
3D Microstructure Reconstruction of
Al
−
La
Microstructure
using Diffraction Contrast Tomography and Lifted Multicut
Ya Su1,*, Zhe Liu1,†
1 School of Computer & Communication Engineering, University of Science and Technology Beijing,
Beijing 100083, China, [email protected]
†
These authors contributed equally to this work.
Abstract:It is important for researchers in material domain to reconstruct and visualize the microstructure of alloy, which helps discover morphologies and properties that can only be found in three dimensional and microscopic space. However, because of the limitation of state-of-the-art sensors, the internal microstructure of the material is not easy to obtain. In this paper, a novel automatic 3D reconstruction method is proposed using diffraction contrast tomography technology to capture the 3D microstructure ofAl −Laalloy. The pipeline of the proposed method starts from the imaging ofAl−Laalloy with the LabDCT technique from Carl Zeiss AG, which produces a sequence of 2D microstructure sections. Then, a segmentation algorithm based on superpixel and lifted multicut is proposed to extract the 2D microstructure in an image section. Finally, 2D segmentations are joined together to reconstruct and visulize the 3D microstructure. As a result, a novel morphology ofAl−La
alloy is recovered with both dendrite and lamellar morphologies. The proposed method has the advantage of the ability to losslessly recover the internal microstructure.
Keywords: diffraction contrast tomography; Al − La dendrite; lamellar eutectic; lifted multicut
1. Introduction
It is important for researchers in materials domain to analyze the the microstructures, which play an important role in the properties and performance of materials [1]. This analysis includes not only visualization but also quantitative evaluation of varying microstructures of materials. As a result, many researchers have discussed related topics in this area. For example, Rowenhorst and Spanos [2] focused on grain topology and interface curvature in a β-titanium alloy, as well as the related grain
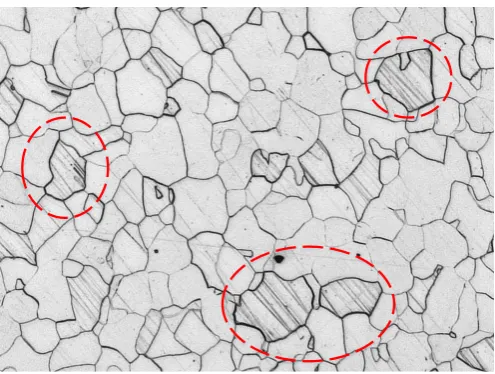
Figure 1. Examples of scratches produced by the serial sectioning technique.
coarsening theories. They used serial sectioning techniques and the full 3-D morphology to recover the 3D microstructure. Wang et al. [3] performed Monte Carlo Potts model simulation based onβ-titanium grains to describe the Topology-dependent description. Wang et al. [3,4] also investigated the topological correlations of grains by using the Monte Carlo-Potts model simulation.
However there are two limitations in most of above stuties. First, the 3D data of grains are often captured using the serial sectioning technique, which suffers from information lost. Since the serial sectioning technique obtains images in an interval of approximate tens of micrometers, and hardly keeps parallel between two layers, much information is lost. Moreover, with the mechanical polishing working on each layer, it is unavoidable to produce scratches, which leads to confusion with grain boundaries, c.f. Fig. 1.
Therefore, scientists have been always looking forward to a technique that is able to extract the complete microstructrue of grains losslessly. Actually, diffraction contrast tomography has been applied in material domain. Marrow et al. [5] used DCT to map the three-dimensional microstructure of a ceramic. McDonald et al. [6] made use of DCT to help understand how the densification of a powder body was affected by various factors, such as particle rearrangement, rotation, local deformation and diffusion, and grain growth. However, this technique has not been widely employed in material domain due to limitation of accuracy and inconvenience. Moreover, lack of automatic segmentation algorithm also hinders the development of microstructure analysis. Generally, the microstructures of most grains are in a scale of micrometer, while a thousandfold microscope produces large and high-resolution images in a scale of millimeter. As a result, microscopic images often contain tens of thousands of grains, which is infeasible for manual labeling. Therefore, it increases the demand for efficient segmentation algorithms.
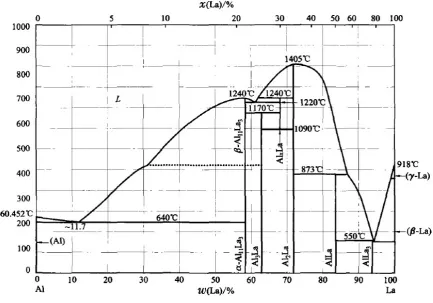
Figure 2. The phase diagram ofAl−Laalloy
was followed by a watershed algorithm and Geodesic transformation to obtain the 3D segmentation. Later, Waggoner et al. [9] presented an interactive propagating method to improve the segmenting quality. Their idea is to partition an image with help of the prior of the previous segmentation result, namely “information propagation". As a result, a sequence of images can be segmented by repeatedly propagating this kind of segmentation from one slice to another. Hence, an interactive graphcut algorithm was introduced. However, human labeling was still necessary.
In this paper, the 3D microstructure of theAl−Ladendrite is investigated. Actually, many researchers have paid much attention to the microstructure of dendrites inAl−Laalloy. The basic idea is to model the relationship between the microstructure and the properties ofAl−Laalloys. Zheng and Wang [10] reported a novel microstructure, periodic diphase dendrite inAl−35%Labinary alloy. They found that there is a discontinuous microstructure in Al −35%La, which appears as a section plan crossed over some branches of tree-like structure. Then, Zheng et al. [11] experimentally studied the microstructure evolution of Al − La alloys with varying La contents. By ways of X-ray diffraction, field-emission scanning electron microscope, energy dispersive spectrometer and tensile test, the variation of 2D microstructure of Al11La3 under different temperatures are discovered. Yang et al. [12] has reported
that the appropriate addition of La had an advantages in refining grain size, removing harmful impurity, improving tensile strength and elongation rate of aluminum alloys. Then, He et al. [13] looked into the progress of microstructure evolution of Al−La alloys with varying La contents. They found that the
Al11La3 phase has an obvious influence on tensile strength, and La content has a greater effect on the
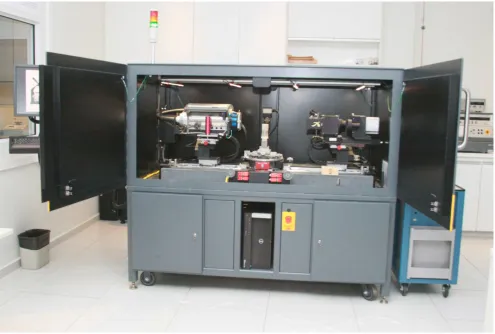
Figure 3. Xradia 510 Versa
For the purpose of analyzing microstructures of Al11La3, the DCT technology is introduced in
company with a lifted multicut segmentation algorithm. As a result, a complete 3DAl11La3 grain is, for
the first time, reconstructed non-destructively. With help of the visualization of the reconstructed grain we find that the dendrite structure, different from common dendrite of single phase, possess a novel 3D morphology. This is the reason why the chemical composition crossing the arms of the diphase dendrite changes in discontinuous and periodic oscillatory, which is consistent with the conclusion drawn by [10,11].
The remaining of the paper is organized as following. Section2 describes experiments conducted with DCT, as well as the resulted dataset. It is followed by introduction of the segmentation algorithm in section3. Subsequently, analysis of the segmentation algorithm and the resulted 3D microstructures are presented in section4. Conclusions are drawn in the final section5.
2. Experimental Methods and Results
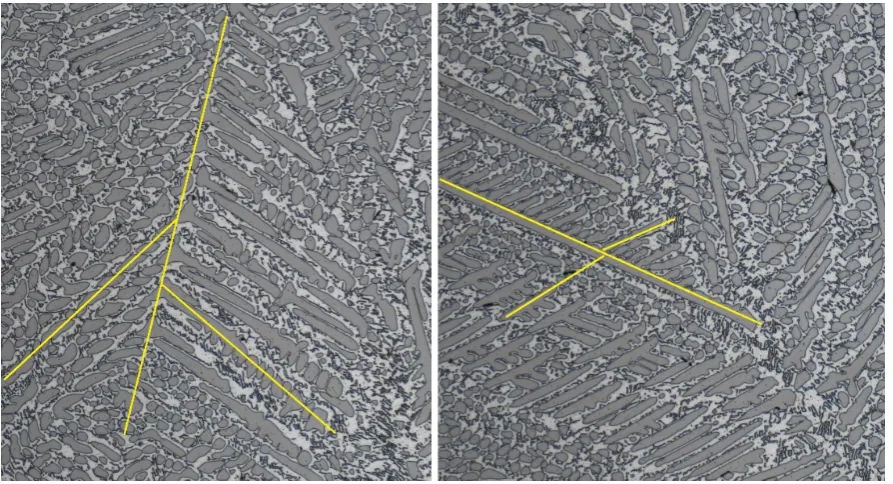
Figure 4. Images captured by optical microscopy at a magnification of 500×
Subsequently, the surfice of the sample is polished with a grinder polisher, providing a smooth 2D plain. Then, an optical microscopy at a magnification of 500×is utilized to capture the microstructure of the sample.
To capture the material structure non-destructively, this paper makes use of the diffraction contrast tomography (DCT) technique. The LabDCT technique from Carl Zeiss AG, Xradia 510 Versa (c.f. 3), is utilized to perform non-destructive detection in three-dimensions. It enables us to non-destructively quantify, map, and visualize numerous small grains, as well as interrelationship between grains in three-dimensional microcosmic space.
Fig. 4 shows the images captured by a optical microscopy. These figures demonstrate the 2D microstructure of dendrite, which consists of light and dark regions, distributing in a uniform matrix of the alloy of Al −35%La. It indicates that the composition of Al and La in the dendrites is under a periodic variation along with its growth directions. So this kind of solidification structure in 2D was named as the periodic diphase dendrite [10]. It is well known that the microstructure of eutecticAlLa
alloy at room temperature is composed ofAlandAl11La3eutectic and first phaseAl11La3according to
the phase diagram, which is shown in Fig. 2. Actually, Zheng and Wang [10] looked into the change of chemical composition in the dendritic arm and proved that the dendrites are composed of two phases, i.e.,
Al andAl11La3. Later, Zheng et al. [11] further discussed the formation mechanism of this two-phase
pattern. However, their discussion has not been supported by experimental results.
In constrast, diffraction contrast tomography technique is able to capture the 3D microstructure of the
Al11La3 alloy. A series of DCT section images of the Al −La alloy are exhibited in Fig. 5. Fig. 6
shows the surface of this cubic alloy in two different views. According to the mechanism of diffraction contrast tomography technique, different colors qualitatively indicate densities of different phases. In another word, the brighter the color, the greater the density. After measurement of the two phases in Fig. 6, their densities are listed in table 1. It indicates that the bright dendrite in Fig. 6 is Al11La3.
Figure 5. Image sections of 3dAl−Laalloy.
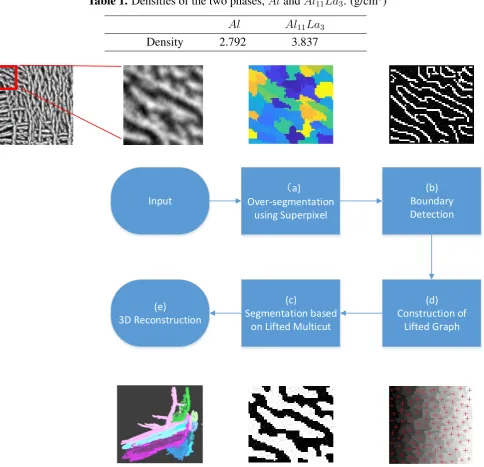
Table 1.Densities of the two phases,Al andAl11La3. (g/cm3)
Al Al11La3
Density 2.792 3.837
(a)
Over-segmentation using Superpixel
(b) Boundary Detection
(c)
Segmentation based on Lifted Multicut Input
(e)
3D Reconstruction
(d) Construction of
Lifted Graph
Figure 7. Illustration of the pipeline of the Lifted Multicut segmentation and reconstruction
capture the shapes of dendrites according to the contrast of densities between the two phases, i.e., Al
and Al11La3. Therefore, it also allows us to recover the microstructure of Al11La3 phase using image
analysis techniques.
3. Segmentation based on Lifted Multicut
From the DCT image sequences of Fig. 5we find that the 2D grains in a section appears like long strips crossing each other. Moreover, there is remarkable interval between two grains. Therefore, it is reasonable to employ segmentation algorithms in computer vision domain to separate different grains. In this paper, we formulate the segmentation of microstructure as a lifted multicut problem.
The minimum cost multicut problem (MP) is often used in image decomposition problem and it is equivalent to the graph decomposition problem. However, it models only pairs of neighboring nodes in the graph, which has difficulty in case of ambiguous boundaries. As an extension of MP, minimum cost lifted multicut problem (LMP) [14] explicitly involves relation between nodes that are not adjacent to each other. This distinct makes feasible the segmentation of images with vague edges.
Before the introduction of LMP, we first give some parameters of LMP as follows.
• a connected graphζ = (V, E)withV the set of vertices, andE the set of edges associating with two neighbor vertices inV.
• a graphζ0 = (V, E0), which is called the lifted graph ofζ, satisfies thatE ⊂ E0, andD =E0\E
contains edges associating only with vertices that are not neighboring. It is remarkable that the graph ζ0 is an extension of ζ. In fact, whenζ0\ζ = ∅, there is no edge associating with vertices that are not neighboring. The LMP is reduced to MP problem. On the other hand whenζ0\ζ 6=∅, LMP is not equivalent to MP. In this case, however, the solutions of MP and LMP are one-to-one corresponding.
• a cost ce is assigned to every edge e ∈ E0, where e = uv connects two nodes u and v that are
belong to distinct components.
Subsequently, the minimum cost lifted multicut problem is defined as [14]
min b∈BE0
X
e∈E0
cebe (1)
s.t. ∀C∈cycles(G),∀e∈C :be ≤
X
¯
e∈C\{e}
be¯ (2)
∀uv ∈E0\E,∀P ∈uv −paths(ζ) :be ≤
X
uv∈P
be (3)
∀uv ∈E0\E,∀C ∈uv−cuts(ζ) : 1−be ≤
X
uv∈C
1−be, (4)
whereb ∈ B is a configuration of all the edge labeling inE0 thatbe ∈ {0,1}, andB ⊆ {0,1}E 0
is the feasible set of the labeling configurations. In this optimization problem, the constrant (2) guarantees that the solution is feasible. It means that any solution set{e ∈ E|be = 1}of (1) corresponds to a multicut
or decomposition ofG. While the constraints (3) and (4) ensure that for any edgee ∈E0, be = 0if and
only there is a path inζ with all edges labeled 0;be = 1 if and only if there is a cut inζ with all edges
labeled 1.
3.2. Implementation
The pipeline of the segmentation and reconstruction is shown in Fig.7.
complexity of the following segmentation procedure. As images captured from DCT are always of high resolution, super-pixel algorithms improves the feasibility of the multicut problem. Based on the super-pixel algorithm, an image is decomposed into a graphζ.
2. Boundary Detection. It helps LMP determine the feature of an edge. Given{diuv}, i = 1, . . . , n
the set of detected boundaries between u andv, with di the strength of the i-th boundary point.
The boundary feature can be determined by
fuv =
Pn i=1di
n (5)
3. Construction of Lifted Graph. Moreover, a feature vectorf is calculated for each node inζ, which consists of the size, the gray histogram, skewness, kurtosis, maximum, minimum, sum, variance, etc.
According to the Bayesian Network, the cost ce depends on the conditional probability of y ∈
{0,1}E0 with respect to the feature vectorxof an edge that [14]
ce =log
1−py|x(1, x)
py|x(1, x)
. (6)
in which py|x can be estimated by logistic regression. However, there are two cases to consider
the feature vectorx. For the first case, an edgee ∈E connects two neighboring nodesuandv of two different components. The feature vector of an edge is constructed by concatenating feature vectors of two nodes and the boundary feature between them.
As a result, the feature vector of an edge connectinguandvis constructed asxuv = [fu, fv, fuv].
Then, logistic regression is conducted based onxuv, which outputs the probabilitypy|xthat
py|x =
1
1 + exp−{β0+β1x} (7)
whereβ0andβ1 can be learnt from the training set.
For the other case, the two nodes of an edgee0 are not neighbors. It is equivalent to find a path that “best" connects these two nodes. However, it is different from and more difficult than the first case that it has to enumerate all paths connecting the two nodes. In this paper, the Dijkstraâ ˘A ´Zs algorithm is used to find this path. After the path is obtained, its probability can be determined by
py|x0(0, x0) = max P∈uv−paths(ζ)
Y
e∈P
py|x(0, x). (8)
4. 3D Reconstruction. To construct the 3D microstructure ofAl−Ladendrite, it is necessary to join together all the 2D segmentation results. For this purpose, a 3D graph is introduced as following. Given two neighboring graphs ζl = (Vl, El) and ζl+1 = (Vl+1, El+1) of thel-th layer and the
l + 1-th layer respectively, the cross-layer edge set can be defined asF = {euv|u ∈ Vlandv ∈
Vl+1}. Moreover, the 3D graph can be defined as
Γ = (Υ,Ξ)
0 200 400 600 800 1000 1200 1400 Number of Superpixels
0.3 0.4 0.5 0.6 0.7 0.8 0.9 1 Rec SLIC NC Reg
0 200 400 600 800 1000 1200 1400 Number of Superpixels
0.05 0.1 0.15 0.2 0.25 0.3 0.35 0.4 0.45 UE SLIC NC Reg
Figure 8. Qualitative evaluation of superpixel algorithms on the DCT image dataset.
As far as the authors know, there have been many algorithms to obtain the solution of 3D graph [14,17]. In the situation of DCT sequential images of Al −La dendrite, however, due to the tiny interval between two neighbor layers, the movement of a dendrite is always so slow that it is easy to interrelate two cross-layer dendrite according to the euclidean distance. Therefore, the cross-layer edge set is constructed as
F ={euv|
P
u∩v1
P
u∪v1
> , u∈Vlandv ∈Vl+1}. (10)
wheredenotes the threshold that can be determined by experiments.
4. Segmentation Results
4.1. Dataset
To capture the microstructure of the alloy, this paper conducts diffraction constrast tomography experiments for Al −La alloy described in Section 2. The Xradia 510 Versa from Carl Zeiss AG is used in this test. As a result, a total number of 400 DCT sections are captured with interval of 2 microns between adjacent layers. The size of each section is800×800and each pixel has a resolution of2×2
square microns. Example sections are shown in Fig. 5. To reduce the computational cost, each section is cropped into 4 images of200×200. Therefore, a dataset of 6400 images is constructed for evaluation. For each image, theAl11La3 phase is manually labeled. Furthermore for all experiments in this section,
the leave-one-out strategy is used and the dataset is split into 10 subsets.
4.2. Evaluation of Superpixel
segmentation isGi and from the superpixel algorithm isSj. Then, the “leakage" is used here to describe
the overlap of superpixels with multiple, nearby ground truth segments. It can be evaluated by
U E= 1
|G| X
Gi
(P
Sj∩Gi6=∅|Sj|)− |Gi|
|Gi|
(11)
where the normalized â ˘AIJleakageâ ˘A˙I of superpixel Sj with respect to Gi is denoted by
(P
Sj∩Gi6=∅|Sj|)−|Gi|
|Gi| . A high value of U E means that the superpixels do not tightly fit the ground truth result. Rec evaluates the boundary with repect to the ground truth that
Rec(G, S) = T P(G, S)
T P(G, S) +F N(G, S) (12)
whereT P(G, S)means the number of true positive boundary pixels F N(G, S)denotes the number of false negative boundary pixels. Therefore, a high Rec indicates better boundary detection.
We compare three superpixel algorithms, i.e., NC[20], Reg [21], and SLIC [18]. The evaluation results of these algorithms are shown in Fig. 8, from which we can draw three conclusions. Firstly, with the increase of number of superpixels, Rec results of the three algorithms are improved consistently. This is in tune with intuition that more superpixels lead to a less â ˘AIJleakageâ ˘A˙I and a better â ˘AIJfitâ ˘A˙I. Secondly, SLIC obtains the best results over the other two algorithms. Finally and most importantly, the cut-off number of superpixel, with satisfied performance, can be determined to be 1000. Actually, the Rec result of SLIC tends to be 1 when the number superpixels is more than 1000. NC get a similar Rec with SLIC when the number of superpixels is more than 1300. In contrast, Reg obtains the worst result. Similarly, the UE curve of SLIC decreases nearly to the minimum, 0.72, after the number superpixels reaches 1000. While the best UE results of Reg and NC are 0.105 and 0.13 respectively.
4.3. Evaluation of Boundary Detection
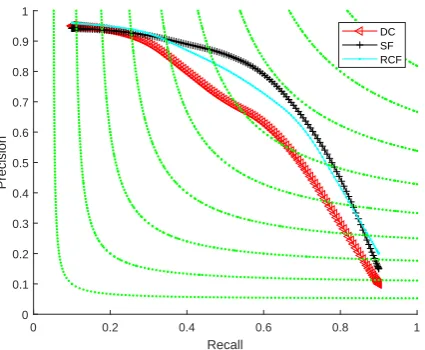
Similar to superpixel, boundary also plays an important role in the cost of LMP (7). This section evaluates and chooses the most appropriate boundary detector for DCT images. Three boundary detectors are involved for comparison, i.e., DeepContour (DC) [22], Structure Forest (SF) [23]) and RCF[24]. The precision-recall curve is introduced to evaluate the performance of the three algorithms. Precision/recall curves are shown in Fig. 9. It indicates that the SF outperforms all the other two methods. In fact, SF obtains an F-score approximate to 0.69, while the F-scores of DC and RCF are 0.62 and 0.66 respectively.
It should be noted that Fig. 9does not mean disappointed performance of DeepContour and RCF. On other dataset, BSDS500 for example, we also obtain different results which support RCF. However, comprehensive evaluation of these algorithms is beyond the scope of this paper. Therefore, the objective conclusion is that the Structure Forest algorithm performs the best on our DCT dataset.
4.4. Performance of Segmentation
0 0.2 0.4 0.6 0.8 1 Recall 0 0.1 0.2 0.3 0.4 0.5 0.6 0.7 0.8 0.9 1 Precision DC SF RCF
Figure 9. Precision-recall curve.
detection, to the segmentation. The idea is to evaluate one procedure by fixing the other. Particularly, we choose structure forest as boundary detection method when assessing superpixel algorithms, because structure forest obtains the best performance in section4.3. Similarly, SLIC is employed as superpixel method when assessing boundary detection algorithms. As a result, a total of five combinations are compared: 1) NC[20] + SF [23], 2) Reg [21] + SF [23], 3) SLIC [18] + SF [23], 4) SLIC [18] + DC [22], 5) SLIC [18] + RCF[24]. The number of superpixels is fixed to be 1000 due to the best performance in Fig. 8. All above combinations are followed by the logistic regression and the lifted multicut algorithm. We introduce three indicators [25] in this evaluation, i.e., the segmentation covering (SC), the probabilistic Rand index (RI), and the variation of information (VI).
• SC measures averaged matching between proposed segments with a ground truth labeling, defined as
SC(S, G) = X si∈S
|si|
|G|maxgj∈G
si∩gj
si∪gj
(13)
• RI evaluates the labeling distance between two regions, which is defined as
RI(S, G) = X i<j
γij
, |G|
2
!
(14)
where
γij =
1 if there existkandk0 such that bothxiandxj are in bothskandgk0
1 if there existkandk0 such that bothxiis in bothskandgk0, andxj is in neithersknorgk0
0 otherwise
(15)
• VI measures the relative entropy between two segmentation sets,SandG, and is defined as
V I(S, G) = H(S|G) +H(G|S) (16)
whereH(S|G)andH(G|S)are conditional image entropies that can be defined as
H(S|G) = X ls∈{0,1}
X
lg∈{0,1}
P(ls, lg) log
P(lg)
P(ls, lg)
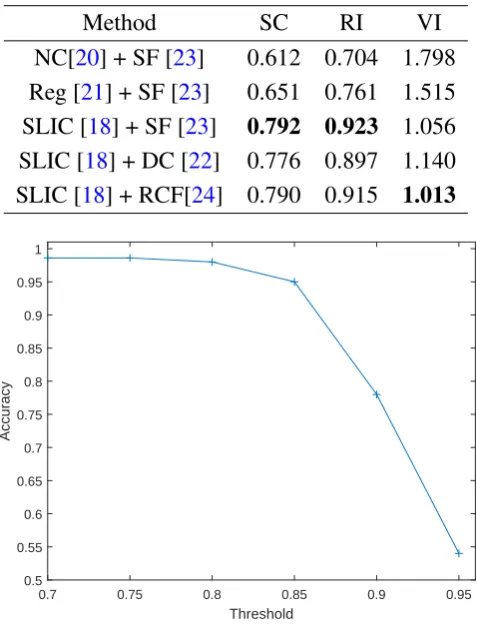
Table 2. Comparison of segmentation results
Method SC RI VI
NC[20] + SF [23] 0.612 0.704 1.798 Reg [21] + SF [23] 0.651 0.761 1.515 SLIC [18] + SF [23] 0.792 0.923 1.056 SLIC [18] + DC [22] 0.776 0.897 1.140 SLIC [18] + RCF[24] 0.790 0.915 1.013
0.7 0.75 0.8 0.85 0.9 0.95
Threshold 0.5
0.55 0.6 0.65 0.7 0.75 0.8 0.85 0.9 0.95 1
Accuracy
Figure 10. Accuracy of cross-layer construction along with variation of the threshold.
wherelsandlgare labels inS andGrespectively. H(G|S)can be defined similarly.
The segmentation results using these three indicators are shown in table 2. We can draw two conclusions. Firstly, the influence of superpixel is greater than that of boundary detector. The max deviation of SC is 0.18 (NC+SF) when alternating superpixel algorithms and 0.26 (SLIC+RCF) when alternating boundary detectors. Similar results can also be found in RI (0.219 vs 0.008) and VI (0.742 vs 0.043). This is reasonable because the accuracy of superpixel is the precondition of segmentation. Secondly, SLC + SF obtains the best performance in both SC and RI, and a similar performance with the best one (SLC + RCF). Therefore, this paper considers the combination SLC + SF as the best pipeline.
Subsequently, this paper analyzes the construction of the 3D graph. The only parameter in this procedure to be considered is the thresholdin10. For this evaluation, the cross-layer correspondences are manually labeled to construct the cross-layer edge setFg. Given the cross-layer edge setFsfrom the
segmentation algorithm, the accuracy can be evaluated by
acc=T P/GT (18)
where T P denotes the number of edges in Fg ∩Fs, and GT denotes the number of edges in Fg. The
results are shown in Fig. 10. It indicates that the accuracy keeps higher than 0.98 until >0.8. Therefore in this paper, the threshold is set to be 0.8.
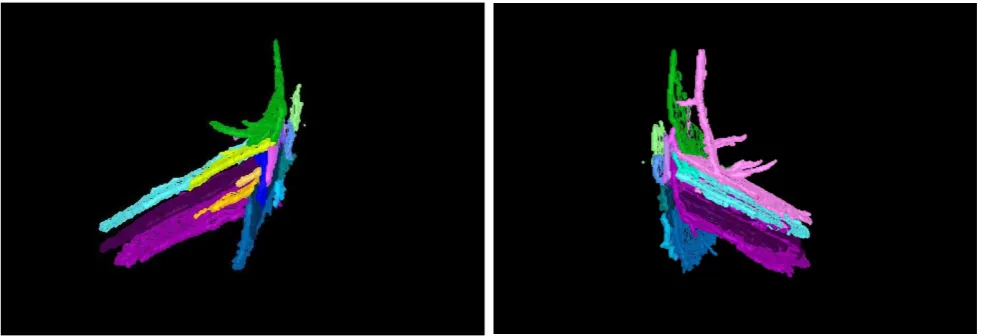
Figure 11. Different views of the dendrite of the phase Al11La3 inAl−Laalloy. Different
colors denote different connected components.
two features. First, the whole microstructure is well developed in the form of dendrite. For example in the left of Fig. 11, the dendrite structure appears as the base of the whole microstructure. On the other hand, the dendrite arm acts as lamellar eutectic morphology.
The reconstructed three-dimentional microstructure in Fig. 11 is novel and different from the tree-structure described in [11]. Through 2D imaging methods of X-ray diffraction and SEM, Zheng et al. [10,11] found the diphase morphology in 2D images, which is predicted to produced by cross-sectioning the alloy vertical to dendrite arms (c.f. Fig. 4 in [11]). However, they did not verify this prediction without the complete three-dimentional microstructure. With help of the reconstructed three-dimentional microstructure in this paper, nevertheless, the 2D "diphase" dendrites named by [11] are formulated by cross-sectioning the dendrites arms in lamellar eutectic microstructure.
5. Conclusion
While many researches focused on the variation of microstructure evolution [13] and properties of the alloy [12,26] according to varying components, there has been little experimental verification of these microstructures in three dimension. For the Al − 35La alloy prepared by free solidification experiment, the 3D dendritic microstructure of Al11La3 phase has been captured and analyzed based
on the diffraction contrast tomography (DCT) technique and the lifted multicut algorithm.
The pipeline of the segmentation of DCT images consists of four procedures. The first one is the superpixel method, which greatly reduces the burden of segmentation. Then, the lifted graph is constructed based on the superpixels and boundary detection algorithms. It is followed by the lifted multicut algorithm which solves the image segmentation problem. After the experimental evaluation, the combination of SLIC [18] and SF [23] is selected to obtain the best segmenting accuracy. Finally, with help of the cross-layer correspondence and 3D visualization, the whole microstructure ofAl11La3
is reconstructed from the DCT image sequence. As a consequence, a novel morphology of theAl11La3
phase is observed through the visualization of the 3D microstructure.
technique as well as the LMP segmentation algorithm is able to recover the microstructure losslessly. Therefore, it is our future work to study the 3D microstructures of other kinds of alloys as well as their relationship to mechanical properties [13].
Acknowledgments
This work was partially supported by National Key Research and Development Program of China (No. 2016YFB0700500)
Author Contributions
The work presented here was carried out in collaboration with all authors. Ya Su made the research theme, designed the methods and wrote the paper. Zhe Liu carried out the experiments, analyzed the data, interpreted the results and prepared the draft.
References
1. Feng, M.n.; Wang, Y.c.; Wang, H.; Liu, G.q.; Xue, W.h. Reconstruction of three-dimensional grain structure in polycrystalline iron via an interactive segmentation method. International Journal of Minerals, Metallurgy, and Materials2017,24, 257–263.
2. Rowenhorst, D.; Lewis, A.; Spanos, G. Three-dimensional analysis of grain topology and interface curvature in aβ-titanium alloy. Acta Materialia2010,58, 5511–5519.
3. Wang, H.; Liu, G.Q.; Song, X.Y.; Luan, J.H. Topology-dependent description of grain growth.
EPL (Europhysics Letters)2011,96, 38003.
4. Wang, H.; Liu, G.; Ullah, A.; Luan, J. Applied Physics Letters2012,101, 041910.
5. Marrow, T.J.; King, A.; Reischig, P.; Rolland Du Roscoat, S.; Ludwig, W. Diffraction contrast tomography of polycrystalline alumina. Materials Science and Technology Conference and Exhibition2009,1, 489–499.
6. McDonald, S.A.; Holzner, C.; Lauridsen, E.M.; Reischig, P.; Merkle, A.P.; Withers, P.J. Microstructural evolution during sintering of copper particles studied by laboratory diffraction contrast tomography (LabDCT). Scientific Reports2017,7.
7. Ullah, A.; Liu, G.; Luan, J.; Li, W.; ur Rahman, M.; Ali, M. Three-dimensional visualization and quantitative characterization of grains in polycrystalline iron. Materials Characterization2014,
91, 65–75.
8. Ullah, A.; Liu, G.; Wang, H.; Khan, M.; Khan, D.F.; Luan, J. Optimal approach of three-dimensional microstructure reconstructions and visualizations. Materials Express 2013,
3, 109–118.
9. Waggoner, J.; Zhou, Y.; Simmons, J.; De Graef, M.; Wang, S. 3D materials image segmentation by 2D propagation: A graph-cut approach considering homomorphism. IEEE Transactions on Image Processing2013,22, 5282–5293.
11. Zheng, Y.H.; Wang, Z.D.; Zhang, S.M. Microstructure of diphase dendrite in Al-35%La alloy during solidification. Journal of Crystal Growth2013,362, 33–37.
12. Yang, Q.; Bu, F.; Meng, F.; Qiu, X.; Zhang, D.; Zheng, T.; Liu, X.; Meng, J. The improved effects by the combinative addition of lanthanum and samarium on the microstructures and the tensile properties of high-pressure die-cast Mg-4Al-based alloy. Materials Science and Engineering A 2015,628, 319–326.
13. He, Y.; Liu, J.; Qiu, S.; Deng, Z.; Zhang, J.; Shen, Y. Microstructure evolution and mechanical properties of Al-La alloys with varying La contents. Materials Science and Engineering: A2017,
701, 134–142.
14. Keuper, M.; Levinkov, E.; Bonneel, N.; Lavoue, G.; Brox, T.; Andres, B. Efficient decomposition of image and mesh graphs by lifted multicuts. International Conference on Computer Vision, 2015, Vol. 2015 Inter, pp. 1751–1759.
15. Stutz, D.; Hermans, A.; Leibe, B. Superpixels: An evaluation of the state-of-the-art. Computer Vision and Image Understanding2018,166, 1–27.
16. Wang, M.; Liu, X.; Gao, Y.; Ma, X.; Soomro, N.Q. Superpixel segmentation: A benchmark.
Signal Processing: Image Communication2017,56, 28–39.
17. Liu, T.; Zhang, M.; Javanmardi, M.; Ramesh, N.; Tasdizen, T. SSHMT: Semi-supervised Hierarchical Merge Tree for Electron Microscopy Image Segmentation. European Conference on Computer Vision, 2016, pp. 144–159.
18. Achanta, R.; Shaji, A.; Smith, K.; Lucchi, A.; Fua, P.; Su?sstrunk, S. SLIC Superpixels Compared to State-of-the-Art Superpixel Methods. IEEE Transactions on Pattern Analysis and Machine Intelligence2012,34, 2274–2282.
19. Martin, D.R.; Fowlkes, C.C.; Malik, J. Learning to detect natural image boundaries using local brightness, color, and texture cues. IEEE Transactions on Pattern Analysis and Machine Intelligence2004,26, 530–549.
20. Mori, G. Guiding model search using segmentation. International Conference on Computer Vision, 2005, Vol. II, pp. 1417–1423.
21. Fu, H.; Cao, X.; Tang, D.; Han, Y.; Xu, D. Regularity preserved superpixels and super voxels.
IEEE Transactions on Multimedia2014,16, 1165–1175.
22. Shen, W.; Wang, X.; Wang, Y.; Bai, X.; Zhang, Z. DeepContour: A deep convolutional feature learned by positive-sharing loss for contour detection. Computer Vision and Pattern Recognition, 2015, Vol. 07-12-June, pp. 3982–3991.
23. Dollar, P.; Zitnick, C.L. Structured forests for fast edge detection. International Conference on Computer Vision, 2013, pp. 1841–1848.
24. Liu, Y.; Cheng, M.M.; Hu, X.; Wang, K.; Bai, X. Richer convolutional features for edge detection. Computer Vision and Pattern Recognition, 2017, pp. 5872–5881.
25. Arbeláez, P.; Maire, M.; Fowlkes, C.; Malik, J. Contour detection and hierarchical image segmentation. IEEE Transactions on Pattern Analysis and Machine Intelligence 2011,
33, 898–916.
Ce, 3.1 wt.% La) alloy processed by severe plastic deformation. Materials & Design 2016,