PERFORMANCE EVALUATION OF NEW PRIVATE SECTOR BANKS USING CAMEL RATING MODEL
Gurmeet Singh Research Scholar,
University School of Applied Management, Punjabi University Patiala.
Dr. Ravi Singla Assistant Professor,
University School of Applied Management, Punjabi University Patiala.
Abstract
In a developing country like India, banking system plays a very important role. Banking system is considered as a backbone of an economy. Therefore, Performance evaluation of banking sector is necessary to ensure financial stability of an economy. This paper attempts to analyse the performance of selected new private sector banks in India, by using CAMEL rating model. It is observed that the private sector banks which were established somewhat earlier in comparison to others have reported better capital adequacy, better management efficiency, and better liquidity position and new entrants have displayed lagged performance both in the area of capital adequacy and liquidity.
Keywords: CAMEL rating model, capital employed, new private sector banks, performance evaluation.
Introduction
2015 from .67% in 2014 whereas it was 1.02% in 2013 (reported in Business Standard on 16th July, 2015). Thus, there is a strong need of performance evaluation of the banks from time to time. Performance evaluation of a bank is concerned with analysing the performance of a bank over a period of time from various angles like profitability, liquidity etc. Performance evaluation of banks is highly necessary because the health of the economy depends upon sound banking system. After the reform process in banking sector during 1991, many studies have been done in order to measure and compare the performance of banks in India. These studies have measured the performance by using various profitability measures like return on capital employed (ROCE), return on assets (ROA), net interest margin (NIM) etc. Over the past years the bank regulators have introduced a number of measures to access the level of risk involved and financial viability of the banks. Most of the regulators suggest the CAMEL rating model to evaluate the performance of the banks. CAMEL rating system was introduced by U.S. supervisory authorities as a system of rating in early 1980s. CAMEL approach has been adopted to evaluate the financial viability of banks since July 1997. CAMEL rating model is a subjective model which indicates the financial strength of a bank whereas CAMEL rating indicates the bank’s relative position with reference to other banks. These ratings are assigned on the basis of ratio analysis of the financial statements of the bank. Ratings are not released to public but only to the top management to manage the risk and to prevent the financial problems. Thus CAMEL rating model measures the current overall financial, managerial and operational performance of the banks. CAMEL rating model is based on following five components:
a) Capital adequacy b) Assets quality
c) Management capability d) Earnings
e) Liquidity
Studies conducted in the past on the performance evaluation of banks in India are reviewed below.
Literature Review
Anurag et al. (2012) conducted a study to compare financial performance of SBI and ICICI Bank on the basis of ratios such as credit deposit, net profit margin from the year 2007-08 to 2011-12. The study found that SBI is performing well and financially sound than ICICI Bank but in case of deposits and expenditure ICICI Bank has better efficiency than SBI. This study also concluded that customers have more trust on public sector banks as compared to private sector banks.
Kumar et al. (2012) analysed the performance of 12 public and private sector banks for the period of eleven years. The study found that there is a need of government’s focus towards public sector banks in order to increase profitability because private sector banks are at the top positions in terms of soundness. The study also concluded that private sector banks are growing faster than public sector banks.
Misra and Aspal (2013) investigated the financial soundness of SBI group for the period 2009-11. The study reveals that in terms of capital adequacy ratio parameter SBBJ and SBP were at top position, while SBI got lowest rank. In terms of assets quality parameters SBBJ held the top rank while SBI held the lowest rank. According to management efficient parameters SBT got top position while SBBJ lowest. In terms of earning quality parameters SBM got the top position, while SBP got lowest rank. In terms of liquidity parameters SBI stood on the top position and SBM at the lowest position. They conclude that though the ranking of ratios is different for different banks but there is no significant difference between the CAMEL ratios which indicates that the overall performance of the SBG is same.
Padma and Arulmati (2013) conducted a comparative study of State Bank of India and ICICI Bank. Various ratios have been used to compare the financial performance of the banks. According to analysis both banks have maintained required standards and are running profitably. This study also indicated the significant difference between performance of SBI and ICICI in terms of deposits, advances, investments, net profit and total assets.
Gupta (2014) analyze the financial position and performance of public sector banks in India by using CAMEL model. The study was conducted on 26 public sector banks. The study reveals that there is a significant difference between CAMEL ratios of all public sector banks in India. On the basis of CAMEL model analysis Andhra Bank stood at first position followed by Bank of Baroda and State bank of Hyderabad while United Bank of India secured last position in context of overall performance.
Dr. Mukund (2014) examined and compared the financial performance of 16 public sector banks and 16 private sector banks. This study is based on primary hypothesis that public sector banks performs better than private sector banks. The overall ranking shows that 67% of private sector banks have better ranks whereas 90% of public sector banks have better ranking. This shows that public sector banks perform better than private sector banks.
Biswas (2014) evaluated the performance of Andhra Bank and Bank of Maharashtra. This study reveals that in terms of management efficiency and earnings quality Andhra Bank is better than Bank of Maharashtra but in case of assets quality and liquidity position Bank of Maharashtra is better than Andhra Bank. Overall position of both the banks is found on par with each other.
Karri et al. (2015) examined the financial performance of two public sector banks that are Bank of Baroda and Punjab National Bank for five year period by applying CAMEL model. It is concluded in the study that the Bank of Baroda has maintained highest capital adequacy position and have performed better than Punjab National Bank.
Most of these studies were conducted either on public sector banks or on comparison of two or three private sector banks. There are very few studies which are related to evaluation of private sector banks in recent time period. The present study aims at performance evaluation of new private sector banks over a recent five year period.
Data and Methodology
The purpose of the study is to measure the financial performance of the new private sector banks with regard to capital adequacy, assets quality, management efficiency, earnings and liquidity. The new private sector banks are those that have got their banking license in the post liberalisation era of 1990’s. The study is conducted on a sample of seven new private banks established on or before 2005 (See Appendix –I). The study covers five years period from 2011-2015. The data used for the study is of secondary nature. It is collected from the RBI’s website, the annual reports of respective banks and money control website. CAMEL rating model is used to analyse the financial performance of the selected new private sector banks.
Results and Analysis
The performance analysis using CAMEL Rating Model is done on the basis of five parameters.
(i) Capital Adequacy
It is important for a bank to prevent it from going to bankrupt and to maintain the confidence of the depositors in the bank. We use the debt equity ratio and capital adequacy ratio in order to evaluate the capital adequacy position of banks:
1. Debt Equity ratio: Debt Equity ratio indicates how much of the bank business is financed through debt and how much through equity. In other words this ratio represents the degree of leverage of the bank.
Table: 1 Group ranking on the basis of capital adequacy
BANK Average Debt
Equity ratio (1)
Average Capital Adequacy ratio (2)
Average of (1) and (2)
Rank
HDFC Bank 8.07 14.48 11.28 2
Axis Bank 8.36 16.89 12.63 6
IndusInd Bank 7.99 14.20 11.09 1
Development Credit Bank 8.86 14.23 11.54 5
ICICI Bank 4.35 18.30 11.33 3
Kotak Mahindra Bank 4.93 17.90 11.42 4
YES Bank 10.48 16.54 13.51 7
Source: Authors’ computations
Table no. 1 indicates that the IndusInd Bank maintained high capital adequacy position followed by HDFC bank and ICICI bank while YES bank secured last position in terms of capital adequacy.
(ii) Assets Quality
Assets quality is used to gauge the strength of bank. We use Gross NPA ratio and Net NPA ratio in order to measure the assets quality of
banks:-1. Gross NPA ratio: This measures the overall quality of banks loan regarding its recovery.
2. Net NPA ratio: This measures the non performing assets as a percentage of net advances. It is calculated by reducing balance of provisions from gross NPA.
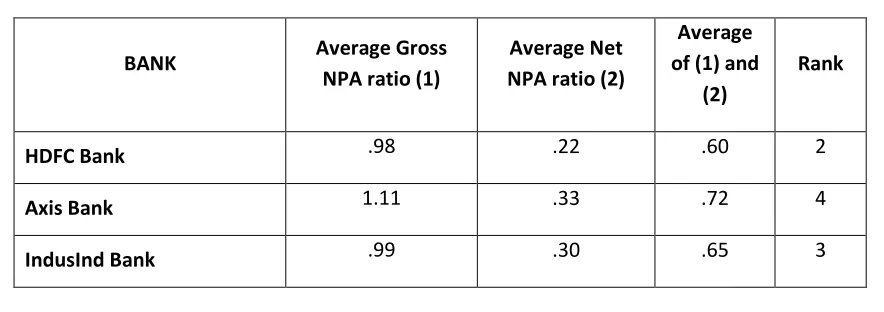
Table: 2 Group ranking on the basis of assets quality
BANK Average Gross
NPA ratio (1)
Average Net NPA ratio (2)
Average of (1) and
(2)
Rank
HDFC Bank .98 .22 .60 2
Axis Bank 1.11 .33 .72 4
Development Credit Bank 1.85 1.05 1.45 6
ICICI Bank 3.62 1.04 2.33 7
Kotak Mahindra Bank 1.79 .79 1.29 5
YES Bank .27 .05 .16 1
Source: Authors’ computations
Table no. 2 shows that YES bank secured first position followed by HDFC bank and IndusInd bank while ICICI bank secured last position in terms of assets’ quality.
(iii) Management Efficiency
Management efficiency component of CAMEL model is related to measure the efficiency and effectiveness of management. We use Total Advances to Total Deposits ratio and Return on Equity as the measures of management’s efficiency.
1. Total Advances to Total Deposits ratio: This ratio indicates the ability of the bank to convert the deposits into high yielding advances.
2. Return on Equity (ROE): ROE is the measure of the profitability of the bank. Here, Profit after tax is expressed as a percentage of average net worth.
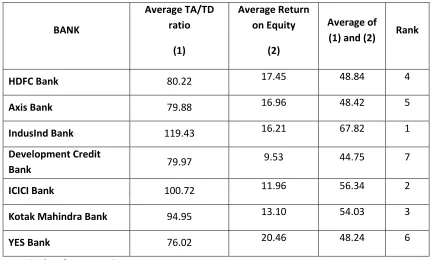
Table: 3 Group ranking on the basis of management efficiency
BANK
Average TA/TD ratio
(1)
Average Return on Equity
(2)
Average of
(1) and (2) Rank
HDFC Bank 80.22 17.45 48.84 4
Axis Bank 79.88 16.96 48.42 5
IndusInd Bank 119.43 16.21 67.82 1
Development Credit
Bank 79.97
9.53 44.75 7
ICICI Bank 100.72 11.96 56.34 2
Kotak Mahindra Bank 94.95 13.10 54.03 3
YES Bank 76.02 20.46 48.24 6
IndusInd bank has better efficient management in comparison of other new private sector banks and Development Credit Bank has poor management as shown in table 3. IndusInd bank secured first rank and Development Credit Bank is at last position.
(iv) Earnings Quality
It determines the ability of the bank to earn consistently and explain the growth of earnings in future. We use Interest Income to Total Income and Net Profit to Total Assets as base to access the earnings quality of the banks.
1. Interest Income to Total Income: This ratio indicates the capability of the bank in generating income from its lending.
2. Net Profit to Total Assets: This ratio measures the extent of utilization of assets. In other words it measures the return on capital employed.
Table: 4 Group ranking on the basis of earnings quality
Source: Authors’ computations
Kotak Mahindra Bank secured first position in terms of earnings quality which indicates that profitability position of Kotak Mahindra Bank is better in comparison to other banks while Development Credit Bank has poor profitability position because it is at last position in terms of earnings as shown in table 4.
(v) Liquidity
Liquidity parameter of CAMEL model assesses the ability of the bank to pay its short term liabilities towards its deposit holders. We have taken Liquid Assets to Total Assets ratio and Liquid Assets to Total
Bank
Average Interest Income to Total
Income (1)
Average Net Profit to Total Assets (2)
Average of
(1) and (2) Rank
HDFC Bank .836 .160 .498 3
Axis Bank .798 .152 .475 6
IndusInd Bank .824 .144 .484 4
Development Credit Bank
.878 .008 .443 7
ICICI Bank .812 .150 .481 5
Kotak Mahindra Bank .852 .168 .51 1
1. Liquid Assets to Total Assets ratio: This ratio measures the overall liquidity position of the bank. 2. Liquid Assets to Total Deposits ratio: This measures the liquidity available for the depositors for
payment.
Table: 5 Group ranking on the basis of liquidity
S o u r c e :
Authors’ computations
Table no 5 reveals that IndusInd bank has better liquidity position followed by ICICI bank and HDFC bank while YES bank has poor liquidity position.
During the evaluation it is observed that different new private banks obtained different ranks with regard to capital adequacy, assets quality, management efficiency, earnings and liquidity (See Table 6). With regard to capital adequacy IndusInd Bank secured the first rank
Table: 6 Overall performance rating
Bank C A M E L Average Ranking
HDFC Bank 11.28 .60 48.84 .498 8.86 14.01 5
Axis Bank 12.63 .72 48.42 .475 8.18 14.08 4
IndusInd Bank
11.09 .65 67.82 .484 10.87 18.18 1
Development Credit Bank
11.54 1.45 44.75 .443 6.44 12.92 7
Bank
Average Liquid Assets to Total Assets ratio (1)
Average Liquid Assets to Total Deposits ratio (2)
Average of
(1) and (2) Rank
HDFC Bank 7.58 10.15 8.86 3
Axis Bank 6.97 9.39 8.18 4
IndusInd Bank 9.12 12.63 10.87 1
Development Credit Bank 5.12 7.76 6.44 6
ICICI Bank 7.54 13.53 10.53 2
Kotak Mahindra Bank 5.20 8.20 6.7 5
ICICI Bank 11.33 2.33 56.34 .481 10.53 16.20 2
Kotak Mahindra Bank
11.42 1.29 54.03 .51 6.7 14.79 3
YES Bank 13.51 .16 48.24 .5 6.30 13.74 6
Source: Authors’ computations
followed by HDFC and ICICI bank while YES bank obtained last rank. But in case of asset quality YES Bank is at top position followed by HDFC Bank and IndusInd Bank while ICICI Bank is at last position. IndusInd Bank also secured top position in terms of management efficiency and Kotak Mahindra Bank is at last. But in case of Earnings Kotak Mahindra Bank is at first place and Development Credit Bank is at last. With regard to liquidity IndusInd Bank secured top position while YES Bank obtained bottom place. Finally combining all the five factors of CAMEL rating model it found that IndusInd Bank performed best amongst the group during the period 2011-2015. Development Credit Bank has shown the worst overall performance based on CAMEL for the period 2011-2015.
Conclusion
The present study helps in comparing the performance of selected private banks in terms of liquidity, earnings, assets quality, management efficiency and capital adequacy. It can be identified from the ratings that which bank is better in terms of all parameters of CAMEL individually and collectively. According to CAMEL ratings overall performance of the IndusInd Bank is better in comparison to other banks and performance of Development Credit Bank is not satisfactory. As per CAMEL rating, IndusInd Bank secured first rank followed by ICICI Bank while Development Credit Bank is at last place. It is quite interesting to observe that the private sector banks which are established somewhat earlier in comparison to others report better capital adequacy, better management efficiency, and better liquidity position. For instance, IndusInd bank performs well in the latter areas and YES bank being a new entrant has displayed lagged performance in the area of capital adequacy and liquidity respectively. This study is restricted to private sector banks only and excludes the ‘S’ element which is recently added in the CAMELS. Thus, there is a scope for further research.
References
1. Anurag, singh and Tandon (2012), “A study of financial performance: A comparative analysis of SBI and ICICI bank.” International journal of marketing, financial services &management research. Vol. 1(11), ISSN 22773622, PP 56-71.
2. Jha and Hui (2012), “A comparison of financial performance of commercial banks: A case study of Nepal.” African journal of business management. Vol. 6(25), ISSN 1993-8233, PP 7601-7611.
4. Misra and Aspal (2013), “A CAMEL model analysis of state bank group.” World journal of social sciences. Vol. 3(4), PP 36-55.
5. Padma and Arulmathi (2013), “Financial performance of state bank of India and ICICI bank- A comparative study”. International journal on customer relations. Vol. 1(1), pp 16-24.
6. Gupta (2014), “An analysis of Indian public sector banks using CAMEL approach”. ISOR
journal of business and management. Vol. 16(1), e-ISSN: 2278-487X, p-ISSN: 2319-7668, PP
94-102.
7. Sharma (2014), “Performance of Indian public and private sector banks: A comparative study.” EPRA international journal of economic and business review. Vol. 2(3), ISSN (online) 2347-9671, PP 27-32.
8. Biswas (2014), “Performance evaluation of Andhra Bank & Bank of Maharashtra with CAMEL model.” International journal of business and administration research review. Vol. 1(5), ISSN 2348-0653, E-ISSN 2347-685X, PP 220-226.
9. Nandhini and Sivasakthi (2015), “An analysis of selective Indian public sector banks using CAMEL approach”. International journal of applied research. Vol. 1(9), ISSN (print) 2394-7500 ISSN (online) 2394-5869, PP 626-630.
10. Karri, Meghani and Mishra (2015), “A comparative study on financial performance of public sector banks in India: An analysis of CAMEL model.” Arabian journal of business and
management review. Vol. 4(8), PP 18-34.
Appendix-I (List of Selected Banks)
Sr. No. Name of the bank Year of Establishment
1. HDFC Bank 1994
2. Axis Bank 1994
3. IndusInd Bank 1994
4. Development Credit Bank 1995
5. ICICI Bank 1996
6. Kotak Mahindra Bank 2003