University of South Carolina
Scholar Commons
Theses and Dissertations
6-30-2016
Interactions Between HIV-1 TAT and Tumor
Suppressor P53
Kristen Lane Spotts
University of South Carolina
Follow this and additional works at:https://scholarcommons.sc.edu/etd
Part of theBiology Commons
This Open Access Thesis is brought to you by Scholar Commons. It has been accepted for inclusion in Theses and Dissertations by an authorized administrator of Scholar Commons. For more information, please [email protected].
Recommended Citation
Spotts, K. L.(2016).Interactions Between HIV-1 TAT and Tumor Suppressor P53.(Master's thesis). Retrieved from
I
NTERACTIONS BETWEENHIV-1
T
AT ANDT
UMORS
UPPRESSOR P53
by
Kristen Lane Spotts
Bachelor of Science
University of South Carolina,2008
Submitted in Partial Fulfillment of the Requirements
For the Degree of Master of Science in
Biological Sciences
College of Arts and Sciences
University of South Carolina
2016
Accepted by:
David Reisman, Director of Thesis
Rekha Patel, Reader
Lewis Bowman, Reader
ii
iii
D
EDICATIONI dedicate this study to my dad, who would be the most proud; to my mom, who
knows I couldn’t have done it without her!; to my husband Chris, and my babies Lane
iv
A
CKNOWLEDGEMENTSI cannot adequately express my appreciation for David Reisman. You are the
epitome of a teacher and a mentor. Your respect for every student as a person first is
something I will strive to emulate in every aspect of my life. Thank you for all that you
have taught me about biology and life in a lab. But thank you most of all for your
friendship.
Thanks also go to Andrea, Ella, Sarah, Katie, Mira, and Shravya for the laughs
v
A
BSTRACTThe most well studied cancer-related gene in history, p53, is responsible for
protecting the integrity of the genome. A variety of different stresses are detected by p53
and its regulators, allowing for numerous post-translational modifications that activate
p53. After activation p53 can then regulate transcription of a myriad downstream targets,
resulting in either cell cycle arrest or apoptosis. One of the stress signals that activates
p53 is viral infection in part through the induction of type-1 interferon. However some
viruses, like the DNA tumor viruses have evolved factors capable of binding to p53 and
inhibiting its ability to regulate its downstream factors in order to avoid cell cycle arrest
or apoptosis and complete the viral life cycle. The human immunodeficiency virus
(HIV), probably the most notorious virus of our time because of our inability to
completely eradicate it from a host, is capable of activating p53 in certain cell types upon
infection. Several studies have reported on the functions of p53 during HIV infection,
such as inhibiting full-length transcription of HIV, interaction with a number of
HIV-encoded proteins such as the trans-activator of transcription (Tat), and eventual
wide-spread apoptosis in T-cells, however these disparate roles are undoubtedly not the whole
story. Our hypothesis is that an HIV factor, Tat is capable of mitigating the downstream
effects of p53. To test this hypothesis we used U2-OS cells and created U2-OS cell lines
that express Tat protein. These cells were then treated with the DNA damaging agents to
vi
protein expression of p53 and its targets p21 and bax. Without further investigation, at
vii
T
ABLE OFC
ONTENTSDEDICATION ... iii
ACKNOWLEDGEMENTS ... iv
ABSTRACT ...v
LIST OF FIGURES ... ix
CHAPTER 1INTRODUCTION ...1
1.1 CELLULAR ROLE OF P53 ...1
1.2 VIRAL INFECTION AND P53 ...5
1.3 HUMAN IMMUNODEFICIENCY VIRUS TYPE 1 ...9
1.4 P53-MEDIATED RESPONSE TO HIV-1INFECTION ...14
1.5 P53 AND THE HIV-1“TRANS-ACTIVATOR OF TRANSCRIPTION” ...17
CHAPTER 2MATERIALS AND METHODS ...20
2.1PREPARATION OF TATHA EXPRESSION VECTOR AND CREATION OF TAT POSITIVE CELL LINES ...20
2.2PROTEIN EXTRACTION AND IMMUNOBLOTTING ...22
2.3LUCIFERASE ASSAY ...24
2.4 RNAPURIFICATION AND RT-QPCR...24
CHAPTER 3RESULTS ...27
3.1EVIDENCE OF BINDING BETWEEN P53 AND HIV-1TAT ...27
3.2EXPRESSION OF HIV-1TAT IN U2-OSCELLS ...29
viii
CHAPTER 4CONCLUSIONS ...45
ix
L
IST OFF
IGURESFigure 1.1 The p53 pathway ...2
Figure 1.2 Binding of p53 by proteins from the DNA tumor viruses ...5
Figure 1.3 Feedback loop involving p53 and type 1 interferon ...9
Figure 2.1 Segment of pTRE2 Tat HA vector. ...21
Figure 3.1 Purification of p53 and Tat proteins ...27
Figure 3.2 Binding of p53 and HIV-1 Tat proteins and peptides ...28
Figure 3.3 Presence of pTRE2 TatHA plasmid in transfected cells ...30
Figure 3.4 Presence of HA tagged Tat protein in transfected cells after addition of doxycycline ...31
Figure 3.5 p21 and bax promoter activity after transfection with pcDNA3 TatHA and treatment with DNA damaging agents ...33
Figure 3.6 p21 and bax promoter activity after transfection with full length TatHA, or Tat mutants and treatment with 1 uM Doxycyline ...34
Figure 3.7 p53, p21, and bax promoter activity in U2-OS cells constitutively expressing HA tagged Tat and treated with DNA damaging agents ...36
Figure 3.8 p21 promoter activity in U2-OS and TatHA Clone 4 cells, untreated and treated with Cisplatin over 24 hours ...38
Figure 3.9 mRNA levels in U2-OS and TatHA Clone 4 cells before and after DNA damage ...42
Figure 3.10 p53 and p21 protein expression in pTRE2 Tat HA inducible cell line ...43
1
CHAPTER
1
I
NTRODUCTION1.1 CELLULAR ROLE OF p53
p53, a protein now famous for its function as a tumor suppressor, was discovered
because of its binding with Simian vacuolating virus 40 (SV40) large tumor (T) antigen,
a viral protein essential for initiation and maintenance of cellular transformation (Lane
and Crawford 1979). First suspected of being an oncogene because of the ability of some
p53 cDNA to transform normal cells to tumorigenic cells (Eliyahu, Raz et al. 1984;
Parada, Land et al. 1984), these cDNA were eventually recognized as mutant forms,
while wild-type p53 could prevent transformation (Finlay, Hinds et al. 1989). Several
discoveries demonstrated the importance of p53 for tumor suppression. Mutations in p53
have been found in almost every type of cancer and at rates of up to 50% (Olivier,
Hollstein et al. 2010), p53-/- mice were found to develop normally but acquire tumors
very early (Donehower, Harvey et al. 1992) and mutant p53 was found at high levels in a
wide range of human cancers (Bartek, Bartkova et al. 1991). Determining the role of
wild-type p53 in maintaining genetic stability was becoming increasingly significant and
when it was finally uncovered, p53 was dubbed the “guardian of the genome” (Lane
1992).
The most notable function of wild-type p53 is that of transcription factor. The
p53 protein recognizes and binds to regions of DNA called response elements (REs)
2
corresponding genes (Farmer, Bargonetti et al. 1992). The set of genes regulated will
ultimately determine the fate of the cell. One possible cellular outcome is programmed
cell death or apoptosis (Shaw, Bovey et al. 1992) and can be achieved through inducing a
number of genes such as Bax, PUMA, Noxa, and Fas (Benchimol 2001) that are involved
in permeablization of the mitochondrial membrane and the caspase cascade. In other
circumstances a more appropriate state for the cell might be cell cycle arrest, either
temporary or permanent arrest known as senescence. In these situations p53 moderates
genes involved in cell cycle progression such as p21, a cyclin dependent kinase (CDK)
inhibitor, or cdc25c that mediates initiation of mitosis, to stop advancement of the cell
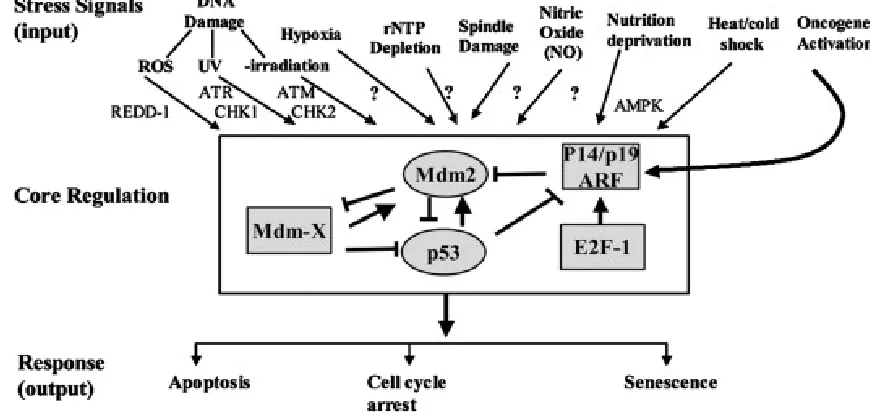
cycle (El-Deiry, Tokino et al. 1993; Clair, Giono et al. 2004) (Figure 1.1).
The need for such disparate consequences stems from the ability of p53 to
respond to numerous forms of cellular stress including, but not limited to, viral infection, Figure 1.1 The p53 pathway. A diverse assortment of stress signals can be recognized by the p53 core regulatory molecules through post-translational modifications.
3
oncogenes, and genotoxic agents (Levine 1997). These stresses lead to a number of
posttranslational modifications (PTMs) of the p53 protein that can cause its stabilization,
localization to the nucleus, increased binding to the REs of its target genes, and moderate
interactions with its binding partners (Gu and Zhu 2012). The types of PTM that the p53
protein can undergo include phosphorylation, methylation, glycosylation, and
ubiquitylation to name a few (Meek and Anderson 2009). Specifically there are at least
a handful of residues subject to acetylation on the p53 protein by more than one enzyme.
Lysine 120 is acetylated by Tip60, a histone acetyltransferase, after DNA damage and
while this alteration is necessary for induction of apoptosis it is not required for cell cycle
arrest (Tang, Luo et al. 2006). While certain PTMs appear to work in an individual
“switch-like” fashion, there is also evidence for cooperative and sequential effects (Gu
and Zhu 2012). The type and intensity of the cellular stimuli induce different PTM
patterns which function to fine-tune the p53 response for a particular outcome.
Activation of p53 by cellular stress is achieved in part by manipulating its
interactions with its negative regulators, primarily murine double minute 2 (mdm2).
Under normal cellular conditions p53 activity is kept in check by a number of negative
regulators through strict control of protein levels and spatial separation from its targets.
This is partially accomplished by complex formation with the mdm2 protein (Momand,
Zambetti et al. 1992) which blocks the p53 transactivation domain (Lin, Chen et al. 1994)
and acts as a ubiquitin ligase targeting p53 for degradation (Haupt, Maya et al. 1997;
Kubbutat, Jones et al. 1997). Nuclear export of p53 through exposure of the nuclear
export sequence (NES) or the NES of mdm2 in the mdm2 p53 complex (Roth,
4
physically separating p53 protein from its target binding sites. Mdm4, a protein similar
to mdm2, is also necessary for regulation of p53, but in a manner nonoverlapping with
that of mdm2 (Parant, Chavez-Reyes et al. 2001). Mdm2 and mdm4 are so imperative
for controlling the activity of p53 that mouse embryos deficient in either do not survive to
birth unless also deficient for p53 (de Oca Luna, Wagner et al. 1995; Jones, Roe et al.
1995; Migliorini, Denchi et al. 2002).
However when cells become stressed from DNA damage or other trauma the
negative regulators of p53 are inhibited. For example during the DNA damage response
to ionizing radiation mdm2 is inhibited from binding to p53 because of phosphorylation
of p53 by ataxia telangiectasia mutated (ATM) (Kastan 2008). ATM simultaneously
phosphorylates mdm2 and mdm4 hastening their rapid degradation (Chen, Gilkes et al.
2005; Stommel and Wahl 2005). This leads to a physical release of p53 protein from
mdm2 and an accumulation of p53 protein and downstream activity. An alternate
pathway to p53 activation through its negative regulator mdm2 is caused by oncogene
activation. Stimulation of several oncogenes, including Ras and Myc, lead to an increase
in arf protein (Palmero, Pantoja et al. 1998; Zindy, Eischen et al. 1998). Arf protein then
binds mdm2 inhibiting its regulation of p53 and contributes to p53 accumulation and
stimulation of its cellular effects (Pomerantz, Schreiber-Agus et al. 1998; Zhang, Xiong
et al. 1998). Clearly inhibition and destabilization help uncouple p53 from its negative
regulators through direct binding and PTM and contribute to the p53 stress response.
p53 is one of the most well studied regulators of genomic stability, especially in
5
protein, the role of p53 in viral infections has not been as well characterized, particularly
in relation to the most infamous virus of our time, HIV.
1.2 VIRAL INFECTION AND p53
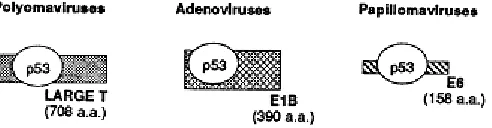
After its initial discovery in SV40 infected cells, the p53 protein was shown to
bind to the human Papilloma virus-16 and 18 E6 (Werness, Levine et al. 1990), and the
Adenovirus E1b-55Kd protein (Sarnow, Ho et al. 1982), both viral proteins necessary for
host cell transformation (Figure 1.2). Eventually the purpose of the interaction between
the viral proteins and p53 became evident, to inactivate p53 and protect the infected cell
from p53-induced cell cycle arrest and apoptosis (Levine 2009), mimicking the role of
the cellular factor mdm2. The number of viral factors found to mitigate the activity of
p53 either by direct interaction or by upstream or downstream effects is already
substantial and continuing to grow (Sato and Tsurumi 2012). However the role of p53 in
the innate antiviral response is still not completely elucidated. Interferons (IFNs) and
other pro-inflammatory cytokines are central to the host response to viral infection. An
intriguing topic of research considers the factors elicited during the IFN response and
their interactions with p53.
6
The induction method of type 1 IFNs is dependent on the type of infecting virus
and on cell type, and it involves multiple pathways for sensing infection (Perry, Chen et
al. 2005). A cellular response to infection is triggered by conserved molecular motifs
called pathogen-associated molecular patterns (PAMPs) that can be found on viral
nucleic acids packaged in endosomes, cytoplasmic viral nucleic acids, and viral proteins
(Randall and Goodbourn 2008). These triggers can be sensed through two distinct
pathways, the extracytoplasmic and cytoplasmic both utilizing pattern recognition
receptors (PRRs). The extracytoplasmic pathway consists of the family of Toll-like
receptors (TLRs), membrane bound proteins that recognize PAMPs in the environment
and recruit the corresponding signaling components and transcription factors using their
cytoplasmic domains (Garcia-Sastre and Biron 2006). Certain host cell proteins in the
cytoplasm, like the RNA helicases RIG-1 and mda5, have also been classified as PRRs
since they have been demonstrated to recognize viral nucleic acids and stimulate
production of IFNs (Garcia-Sastre and Biron 2006).
While differing combinations of PAMP and PRR may be responsible for
activating unique pathways to IFN transcription, there seem to be a handful of common
factors. Nuclear factor kappa-B (NF-κB) and members of the IFN regulatory factor (IRF)
family must be translocated to the nucleus from the cytoplasm for transcription of the
type 1 IFNs to occur (Randall and Goodbourn 2008). Type 1 IFNs are released from the
cell where they can enhance the innate antiviral response, in both an autocrine and
paracrine manner, by binding to type 1 IFN receptors (Perry, Chen et al. 2005).
Type 1 IFN receptors are transmembrane proteins consisting of two subunits IFN
7
type 1 binding (Stark, Kerr et al. 1998). This interaction activates two members of the
the Janus family of tyrosine kinases, JAK-1 a nd TYK-2 which phosphorylate the
signaling transducer and activator of transcription (STAT) 1 and 2 (Platanias and Fish
1999). The activated forms of STAT1 and 2 then complex with IRF9 to form
IFN-stimulated gene factor 3 (ISGF3) that is transported to the nucleus and binds to DNA
sequences containing IFN-stimulated response elements (ISREs) to upregulate
transcription of IFN-stimulated genes (ISGs). Other IFN-activated STATs and STAT
complexes are also reported to be capable of DNA binding and transcription activation
(Garcia-Sastre and Biron 2006).
The p53 promoter contains sequences similar to ISREs capable of being bound by
ISGF3. This helps explain the induction of p53 mRNA and protein upon treatment with
IFN-α/β (Takaoka, Hayakawa et al. 2003). When this induction occurs early, less than 9
hours post treatment, it does not in itself result in activation of p53 or regulation of the
downstream targets of p53. On the other hand prolonged exposure to IFN-β, 3-12 days,
can lead to permanent cell cycle arrest at least partially due to PTM and activation of p53
(Moiseeva, Mallette et al. 2006).
However infection of MEFs with vesicular stomatitis virus (VSV) induces IFN-β,
p53 with and without PTMs, and some downstream targets of p53 within 16 hours. At 24
hours post infection p53-/- MEFs show an increased resistance to apoptosis when
compared to MEFs wild-type for p53. Also the viral yield in VSV infected MEFs was
30-fold greater when p53 was not present (Takaoka, Hayakawa et al. 2003). In fact
“super p53” MEFs, generated from mice receiving an extra copy of p53, demonstrated
8
levels of PUMA and apoptotic cells (Munoz-Fontela, Angel Garcia et al. 2005).
Infection with influenza virus also upregulates p53 protein and activity, cell type
independently. There was a severe decrease in the viability of influenza virus infected
cells when p53 was present and functional, and an increase in viral yield when p53 is
inhibited (Turpin, Luke et al. 2005).
The actions of p53 may also be regulated by factors in the antiviral IFN response
pathway other than IFN itself. Protein kinase R (PKR) is a type 1 IFN inducible target
that binds and is activated by dsRNA from viral infections as well as cellular activators
such as PACT (Patel and Sen 1998). PKR halts viral replication through phosphorylation
of the cellular translation initiation faction eIF2 inhibiting viral protein synthesis
(Colthurst, Campbell et al. 1987). PKR has also been reported to increase IFN
production probably through the activation of NF-κB (Perry, Chen et al. 2005). The
interactions of PKR with p53 have been implicated in the antiviral host response. PKR
has been reported to bind and phosphorylate the p53 protein at Ser392, and enhance
phosphorylation of Ser18 increasing its transcription activity (Cuddihy, Li et al. 1999;
Cuddihy, Wong et al. 1999). Another method for p53 upregulation by proteins involved
in the IFN pathway concerns the ability of STAT1 to negatively regulate Mdm2 and
physically interact with p53 in response to DNA damage leading to induction of certain
pro-apoptotic p53 gene targets (Townsend, Scarabelli et al. 2004).
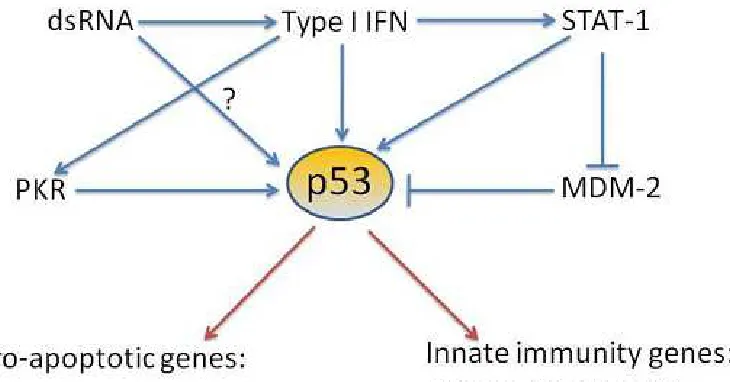
This evidence supports the idea that p53 plays a role in virus-induced senescence
and apoptosis, and modulation of viral replication. Lastly there is evidence for p53
directly targeting several members of the type 1 IFN response for upregulation, including
9
IFN promoter ISRE (Turpin, Luke et al. 2005), and enhancing cellular release of IFN
(Munoz-Fontela, Macip et al. 2008). This would seem to indicate the presence of a
positive feedback loop involving p53 and the IFN-mediated antiviral response pathway
(Figure 1.3). Therefore viral infections triggering an IFN response could also provoke
p53 activation leading to cell cycle arrest, or apoptosis. Depending on the life cycle of
the virus it might prove advantageous to evolve factors to mitigate the p53 response.
1.3 HUMAN IMMUNODEFIENCY VIRUS TYPE 1
Acquired immune deficiency syndrome (AIDS) is characterized by a set of
symptoms, including recurrent infections, certain cancers, and low CD4+ T cell counts,
10
the final stage. The Centers for Disease Control and Prevention (CDC) estimates that 39
million people worldwide have died from AIDS since the epidemic began and another 35
million people are living with the virus as of 2013. Of those 35 million infected, only
12.9 million were believed to be receiving antiretroviral therapy (ART). Most
antiretroviral drugs target the enzymes necessary for HIV infection and/or replication to
occur. ART is highly effective especially when used in combination regimens. When
three of more antiretroviral drugs are taken together it is called highly active
antiretroviral therapy (HAART). Although HAART can efficiently minimize viral load,
specific characteristics of HIV make it necessary to continue therapy indefinitely to
maintain this effect. The complexity of the interactions between HIV and the innate
immune system along with the propensity of HIV to rapid mutation have led to a
challenging scientific and medical issue.
HIV is of the family Retroviridae because it contains RNA and reverse
transcriptase and was further classified as a lentivirus due to its similarity in sequence and
morphology to known members of the Lentivirinae genus (Gonda, Wong-Staal et al.
1985). Based on its genetic diversity, HIV was further divided into HIV-1 and HIV-2.
HIV-2 however displays much lower transmission efficiency and is therefore mostly
restricted to West Africa and is endemic as opposed to the pandemic spread seen by
HIV-1 (Reeves and Doms 2002).
HIV-1 infection can be described in two stages; early and late. The early stage
describes the process of the mature virus entering the cell and integrating its nuclear
11
and protein production, viral assembly and emergence of mature virions from the host
cell.
The Early Phase
The HIV-1 envelope is a lipid bilayer derived from the host cell and containing
projections formed from glycoproteins known as gp120 and gp41 encoded on the env
gene (Muesing, Smith et al. 1985). HIV-1 infects mainly CD4+ T cells and macrophages
by gp120 interaction with the cell surface receptor CD4 (Dalgleish, Beverley et al. 1984)
and a chemokine co-receptors, like CCR5 (Wells, El Proudfoot et al. 1996). This leads to
exposure of the gp41 fusion domain to the cell membrane and rearrangement of the viral
envelope resulting in fusion of the viral and host cell membranes (Engelman and
Cherepanov 2012) releasing the viral core to the interior of the host cell.
The core contains two copies of single stranded viral RNA tightly bound to gag
encoded p7 nucleocapsid protein, and proteins necessary for viral replication, such as
reverse transcriptase and integrase, surrounded by the mature capsid formed from gag
encoded p24 (Fukui, Imura et al. 1993). Uncoating of the core disassembles the capsid
shell (Ambrose and Aiken 2014) and likely triggers reverse transcription of viral RNA
(Fitzon, Leschonsky et al. 2000).
The RNA is reverse transcribed into double stranded DNA by two pol gene
products, p66 and p51, that form a heterodimer yielding the reverse transcriptase enzyme
(Veronese, Copeland et al. 1986) capable of RNA to DNA polymerase, DNA to DNA
polymerase and ribonuclease H functions. The double stranded DNA along with several
viral proteins including integrase and Vpr form a pre-integration complex (PIC)
12
not yet been fully elucidated (De Rijck, Vandekerckhove et al. 2007). Once nuclear
localization occurs a third product of the pol gene, integrase, cuts the host chromosomal
DNA and joins the 3’end of the viral DNA to the cellular DNA (Bushman, Fujiwara et al.
1990). Host enzymes then complete the process joining the 5’ ends of the viral DNA to
the host DNA to establish a stable provirus.
The Late Phase
Transcription of the integrated provirus now proceeds to produce viral mRNA
utilizing the host cellular machinery. The viral trans-activator of transcription (Tat)
protein recruits the host factors P-TEFb, CDK9, and cyclin T1 to the viral transactivation
response (TAR) element found at the 5’ end of initiated viral transcripts to act as a
promoter element (Fujinaga, Cujec et al. 1998), and stimulates CDK9-mediated
phosphorylation of RNA polymerase II (Zhou, Halanski et al. 2000) greatly enhancing
transcription elongation. While small viral mRNAs are easily exported from the nucleus,
larger mRNAs require help from the viral regulator of expression, Rev. Multiple Rev
molecules bind to the Rev response element (RRE) found in the env coding region of
unspliced mRNA (Malim, Hauber et al. 1989) and the presence of a nuclear export signal
(NES) facilitates egress of the Rev-bound unspliced mRNA from the nucleus (Fischer,
Huber et al. 1995).
Translation of cytoplasmic, viral mRNA to protein necessary for virion assembly
and budding also utilizes cellular machinery ie. the rough endoplasmic reticulum and
cytosolic polysomes. Virion morphogenesis begins when the necessary factors, mainly
viral genomic RNA, the Env proteins, and the Gag polyprotein, are transported to the
13
assembly. Multiple Gag polyproteins anchor by their MA domains collectively at
specific regions of the plasma membrane. The CA domains interact to create a spherical
Gag lattice that organizes the virion and distorts the membrane. The viral genomic RNA
is secured on the NC domain while viral accessory proteins and factors in the ESCRT
pathway are recruited and bound by the p6 region. The cellular ESCRT pathway is
responsible for plasma membrane remodeling and scission and has been hijacked to
complete budding of the new virion from the host cell. Maturation of the immature
virion can occur concurrently or just after budding and relies on cleavage of the Gag
polyproteins by the viral protease enzyme. Rearrangement of the fully processed proteins
leads to a mature infectious particle (Sundquist and Kraeusslich 2012). These mature
virions are now capable of infecting new cells.
While many HIV-1 infected CD4+ T cells will play host to viral replication before
undergoing apoptosis early during the innate immune response, this is not a universal
outcome. Some infected cells enter a state known as latency. This is a reversible
condition that exists when an infected cell is capable of but does not actively produce
virus particles (Eisele and Siliciano 2012). This is not the principal means for HIV to
evade the host immune response as it is in the Herpesviridae family of viruses (Perng and
Jones 2009). The primary means of immune escape by HIV is rapid evolution (Borrow,
Lewicki et al. 1997; Richman, Wrin et al. 2003). However with the success of HAART
at diminishing active production of virus, the populations of latently infected cells known
as reservoirs have taken on new importance and frustrated work towards a cure. Because
14
1993; Chun, Stuyver et al. 1997), lapses in HAART lead to reactivation of latent cells and
a rebound in viremia (Davey, Bhat et al. 1999).
Latent infections probably develop early after the initial host infection and can
occur in both active and resting CD4+ T cells (Chavez, Calvanese et al. 2015). Most of
the active CD4+ cells that eventually make up the latent pool were probably infected
while transitioning to a resting state from an active state and were not productive.
However there is new evidence that a small number of cells actively produce virus and,
through an unknown process, revert to a resting state (Chavez, Calvanese et al. 2015).
The mechanisms for producing latently infected cells are still unclear but there is
evidence that location and orientation of viral genome integration may play a role.
Integration has been reported to occur ~90% of the time at sites within genes that are
actively transcribed in resting CD4+ T cells (Han, Lassen et al. 2004). The many open
questions still surrounding HIV mean that it remains an important and interesting area of
research.
1.4 p53-MEDIATED RESPONSE TO HIV-1 INFECTION
“The immune system has only limited success in opposing infection by HIV” (Audige,
Urosevic et al. 2006)
The p53 response to HIV-1 infection is likely multifaceted and dependent on a
number of factors such as cell type and phase of infection. p53 has been implicated in
mediating cell cycle arrest and apoptosis and also moderating transcription of the viral
genome from the LTR through response to type 1 IFN, DNA damage and HIV encoded
15
These actions may in part be hijacked and utilized by the virus for its own preferred
outcome, be that viral replication, latency or apoptosis.
It is difficult to study the initial steps of HIV infection in humans, however
attempts to illuminate this early stage using SIV infection in rhesus macaques offers
some insight. Plasmacytoid dendritic cells (pDCs) are the initial predominant cell type to
arrive at the site of infection (Kwa, Kannanganat et al. 2011). SIV/HIV then activates
pDCs to produce chemokines and cytokines that attract other immune cells, such as
CD4+ T-cells, leading to a robust and systemic infection (O'Brien, Manches et al. 2013).
While pDCs do not show a reduction in cell viability (Yonezawa, Morita et al.
2003) and are poor sources for viral replication after HIV-1 infection, they are the
principal producers of type 1 IFN (Ferbas, Toso et al. 1994). Type 1 IFN is at least
partially responsible for the upregulation of p53 mRNA and protein in HIV-1 infected
CD4+ T cells (Imbeault, Ouellet et al. 2009; Imbeault, Lodge et al. 2009).
Another method of p53 activation following HIV-1 infection, involves the HIV-1
glycoproteins, both the Env complex, made up of gp120 and gp41, and soluble gp120.
Infected cells expressing the Env complex on their surface are able to fuse with
uninfected cells containing CD4 receptors and CXCR4 or CCR5 co-receptors, creating
syncytia, and inducing phosphorylation of p53 and upregulation of p53 targets, such as
PUMA, leading to mitochondrial membrane permeabilization and apoptosis (Genini,
Sheeter et al. 2001; Perfettini, Castedo et al. 2005). This appears to be a major source of
immune cell depletion in the progression of HIV-1/AIDS.
After p53 is activated it is capable of regulating transcription from promoter REs.
well-16
studied functions of p53, but p53 also has the ability to regulate transcription from viral
promoters. The HIV-1 LTR has been shown to be yet another viral promoter that can be
regulated by p53. Numerous groups have reported that wild-type p53 has an inhibitory
effect on transcription from the HIV-1 LTR (Duan, Ozaki et al. 1994) while some mutant
forms of p53 have been shown to increase transcript elongation (Subler, Martin et al.
1994). The mechanisms by which p53 regulates HIV-1 LTR transcription elongation are
still being identified. Reports have been made of complex formation with TATA box
binding protein (TBP) and Sp1 (Borellini and Glazer 1993; Chen, Farmer et al. 1993).
More recently it was suggested that cdk9 was phosphorylating p53 along with Mdm2
thereby stabilizing p53 and leading to its accumulation, which in turn decreased
transcriptional elongation from the HIV-1 LTR (Bagashev, Fan et al. 2013). Pirh2 was
also reported to be phosphorylated by cdk9 which led to its inactivation (Bagashev, Fan
et al. 2013). This is particularly interesting in light of the fact that the inhibitory effects
of p53 on the HIV-1 LTR reported were transitory and transcription elongation was
salvaged possibly by the activity of Pirh2 (Mukerjee, Claudio et al. 2010). It has also
been noted that overexpression of p53 prevents phosphorylation of serine 2 in the
carboxy terminal domain of RNA polymerase II which is necessary for efficient
transcription elongation from the HIV-1 LTR (Mukerjee, Claudio et al. 2010). It is no
surprise that the effect of p53 on HIV transcription has been and continues to be a topic
of interest.
In addition to its trans-activating role, p53 has been found to interact with a
couple of HIV-1 factors. For example HIV-1 Vpu has been reported to inhibit
17
stimulating p53-mediated apoptosis in T cells (Verma, Ali et al. 2011). There is also
evidence of p53 interacting with the Tat protein, but the mechanisms and effects of this
complex are still being investigated.
1.5 p53 AND HIV-1 “TRANS-ACTIVATOR OF TRANSCRIPTION”
As was previously described, p53 is upregulated by several pathways perhaps cell
type specifically after HIV-1 infection. For certain cell types the actions of p53 might be
hijacked by the virus and utilized in a manner detrimental to the host, such as
wide-spread apoptosis in T cells. Our interest was in determining whether or not the actions of
p53 could be mitigated by the HIV-1 factor Tat, prolonging the cellular life span to allow
for completion of the viral life cycle. This would be similar to the actions of the p53
responsive factors found in the small tumor viruses; SV40 T antigen, HPV E6, etc.
Numerous viral factors including some produced by HIV have been shown to
interact with p53 and other players in the p53 pathway. One such factor is HIV-1 Tat.
Most isolates of the HIV-1 virus produce Tat protein that consists of 101 amino acids.
However a few isolates are known to produce a functional 86 amino acid version of the
Tat protein. Tat was discovered because of its role as a trans-activating protein,
responsible for enhancing transcription from the HIV-1 LTR. Eukaryotic RNA
polymerase II is capable of forming short HIV-1 transcripts but is inefficient at
transcription elongation. Tat binds both with the eukaryotic positive transcription
elongation factor (P-TEFb), a complex of cyclin T1 and cyclin dependent kinase 9
(Cdk9), and the TAR stem-loop structure of newly synthesized HIV-1 mRNA. These
18
transcription of full length HIV-1 mRNAs. Tat also recruits other cellular proteins
necessary for relieving repression of the HIV-1 LTR, such as the CREB-binding protein
(CBP)/ p300 complex (Romani, Engelbrecht et al. 2010).
Tat has also been implicated in several other functions since its discovery,
including regulation of gene expression from other viruses like polyomavirus BK
(Gorrill, Feliciano et al. 2006) and from host cells leading to downstream effects
including the inhibition of apoptosis (Zheng, Yang et al. 2007) and immune suppression
(Gupta, Boppana et al. 2008). Tat has also been linked to the increase in cancers seen in
AIDS patients (Nunnari, Smith et al. 2008), and to the onset of HIV-associated dementia
caused by induction of neuronal apoptosis (Haughey and Mattson 2002). Tat is fast
getting a reputation as a versatile protein with a full dance card, however its association
with p53 has yet to be fully elucidated.
p53 has been reported to inhibit Tat transactivation of the HIV-1 LTR (Duan,
Ozaki et al. 1994; Li, Wang et al. 1995) however Tat has also been demonstrated to
suppress transcription from the p53 promoter (Li, Wang et al. 1995). These studies
examining interaction between p53 and Tat have indicated binding does occur. Therefore
a detailed examination of the structural and biophysical characteristics of the interaction
was performed using peptide mapping, fluorescence anisotropy, and NMR spectroscopy.
It was determined that amino acids 1-35 and 47-57 of Tat bind directly to the
tetramerization domain of p53 which corresponds to residues 326-355 (Gabizon, Mor et
al. 2008).
A few studies have attempted to determine the cellular ramifications of p53 and
19
G1/S checkpoint after DNA damage induced by gamma irradiation. The G1/S checkpoint
is regulated by the p53 target, p21, and the levels of p21 were found to be decreased
when Tat was present. Because their results also indicated that wild-type Tat was able to
inhibit p53 transcription activation while mutant Tat was not, it was tentatively suggested
that the decrease in p21 and the failure of the G1/S checkpoint was caused by inhibition
of p53 transactivation (Clark, Santiago et al. 2000).
The objective of the studies presented here was to identify whether the presence
of HIV-1 Tat in vitro would inhibit the ability of p53 to trans-activate its downstream
targets, p21 and bax. This was carried out by introducing Tat into the U2-OS cell line
either by transient or stable transfections and activating p53 with the DNA damaging
agents Camptothecin, Cisplatin, Doxorubicin, and Etoposide. The effects on p21 and bax
promoter activity, mRNA, and protein were studied using luciferase assays, qPCR, and
immunoblotting, respectively. Because of the complex nature of HIV infection and its
tendency towards latent infection which cannot at this point be eradicated even with
HAART, elucidating the interactions between p53 and HIV factors like Tat is an
important goal.
20
CHAPTER 2
M
ATERIALSA
ND METHODS2.1 PREPARATION OF TAT HA EXPRESSION VECTOR AND CREATION OF TAT
POSITIVE CELL LINES
In order to study the p53 response in the presence of the HIV-1 Tat protein, the
pcDNA3 Tat HA expression vector (Addgene plasmid 14654) and the human
osteosarcoma U2-OS cell line was used. The pcDNA3 Tat HA plasmid encodes a
wild-type, 101 amino acid version of the HIV-1 Tat protein tagged with influenza
hemagglutinin (HA). This vector also contains a selectable marker for neomycin
resistance. The U2-OS cell line was chosen because it produces wild-type p53 and can be
used to study the p53 DNA damage response pathway which includes upregulation of
p21 and bax. The human osteosarcoma cell line U2-OS was grown in Dulbecco’s
Modified Eagle’s medium (DMEM) containing 10% fetal bovine serum, 4.5 g/L glucose,
100 U/ml penicillin, 100 ug/ul streptomycin, and 2 nM L-glutamine.
U2-OS cells were grown to confluency and split 1.45 x 10⁶ in 100 mm cell culture
dishes. After 24 hours the cells were transfected with 2.5 ug and 5 ug of pcDNA3 Tat
HA expression vector using TransFast Transfection Reagent (Promega) in a 1:1 charge
21
plasmid was achieved by addition of 200 ug/mL Geneticin G418 sulfate (GIBCO) to the
growth medium. Clones were expanded, then PCR was used to test for the presence of
the pcDNA3 Tat HA vector and immunoblotting with the HA probe (Santa Cruz
Biotechnology) was used to test for the production of Tat HA protein. The U2-OS Tat
HA cell lines were grown in DMEM with identical supplementation as the U2-OS cell
line plus 200 ug/ml G418.
The pcDNA3 Tat HA expression vector, and the pTRE2 vector (Clontech), that
contains the Tet-responsive promoter PhCMV*-1, were digested with the restriction
enzymes Not I and BamH I. The Tat HA fragment was gel purified and ligated to the
pTRE2 plasmid and will herein be referred to as the “pTRE2 Tat HA” Tet-induced
expression vector (Figure 2.1).
The U2-OS Tet-On Cell Line (Clontech) expresses a tetracycline-regulated
transactivator, rtTA, that in the presence of doxycycline binds to the Tet-responsive
element (TRE) of the PhCMV*-1 promoter. U2-OS Tet-On cells were grown to confluency
and split 1.45 x 10⁶ cells in 100 mm cell culture dishes. After 24 hours the cells were
co-transfected with pTRE2 Tat HA vector and pSV2gpt vector using TransFast Transfection
Reagent (Promega) in a 1:1 charge ratio of TransFast reagent to DNA. Cells positive for
the pSV2gpt plasmid were selected by addition of the GPT selection mixture (section
2.2). Clones were expanded into 24 well plates and tested for the presence of Tat DNA Figure 2.1 Segment of pTRE2 Tat
HA vector.
22
with PCR. Cell lines positive for Tat DNA were then tested for protein production with
immunoblotting using an HA probe (Santa Cruz Biotechnology). The U2-OS Tet-On
cell line was grown in DMEM with identical supplementation as the U2-OS cell line plus
200 ug/ml G418. The U2-OS Tet-On Tat cell line was grown in DMEM with identical
supplementation as the U2-OS Tet-On cell line plus 15 ug/ml mycophenolic acid, 250
ug/ml xanthine, 15 ug/ml hypoxanthine, 2 ug/ml aminopterin, 10 ug/ml thymidine (GPT
selection mixture). Four DNA damaging agents were used to induce a p53 response in all
cell lines; 14 uM Camptothecin, 35 uM Cisplatin, 1 uM Doxorubicin, and 10 uM
Etoposide (all Sigma).
2.2 PROTEIN EXTRACTION AND IMMUNOBLOTTING
Approximately 1 x 10⁶ cells were plated on 100 mm cell culture dishes and after
24 hours were treated with DNA damaging agents. At the indicated time points the cells
were washed with 5 mL PBS, harvested by scraping in 1 mL of PBS, and pelleted by
centrifugation for 2 minutes. The supernatant was removed by aspiration and the pelleted
cells were lysed using 50 uL of RIPA buffer (50 mM Tris pH 7.5, 150 mM NaCl, 1%
Triton X-100, 0.1% SDS) with 10 uL/mL HALT Protease Inhibitor Cocktail that includes
1 mM AEBSF, 800 nM Aprotinin, 50 uM Bestatin, 15 uM E64, 20 uM Leupeptin, 10 uM
Pepstatin A (Thermo Scientific) added, then sonicated. The protein concentration was
determined using Bradford Protein Assay (Bio-Rad) with a 1700 PharmaSpec
UV-VIS spectrophotometer (Shimadzu) reading at a wavelength of 595 nm. Protein lysates
23
Thirty ug of protein were mixed in a 1:1 ratio with Laemmli Sample Buffer
(Bio-Rad) and denatured by boiling at 100 oC for 3 minutes. Samples were separated by
SDS-PAGE using 12% SDS-polyacrylamide gels and 1X Tris-glycine running buffer (25 mM
Tris, 192 mM glycine, 0.1% SDS) at 200 V for 1 hour. Gels were rinsed in 1X TBST (10
mM Tris pH 8, 150 nM NaCl, 0.05% Tween-20) before protein was transferred by
electrophoresis to Amersham Hybond-ECL nitrocellulose membrane (GE Healthcare) in
protein transfer buffer (25 mM Tris, 192 mM glycine, 20% methanol) at 100 V for 1
hour. Membranes were rinsed in 1X TBST and incubated in 2% powdered milk in TBST
overnight to block non-specific binding of antibodies.
Membranes were rinsed three times with 1X TBST, then probed by incubating for
1 hour with the recommended dilutions of the following mouse monoclonal antibodies:
1:2000 p53-421 (Calbiochem) with 1:2000 p53-DO1 (Calbiochem), 1:50 p21 (Santa Cruz
Biotechnology), and 1:200 HA-probe (Santa Cruz Biotechnology). Membranes were
washed once with 1X TBST for 15 minutes, then two more times for 5 minutes, before
being incubated in anti-mouse IgG-peroxidase antibody (Sigma-Aldrich) diluted
1:2000010 for 1 hour. Membranes were again washed once for 15 minutes and three
times for 5 minutes. All washes and incubations were performed on a shaker at room
temperature.
Membranes were incubated in room temperature ECL Prime Western Blotting
Detection Reagents 1 and 2 (GE Healthcare) mixed in a 1:1 ratio for 5 minutes. One of
two imaging methods were utilized. In the first method a sheet of Kodak BioMax Light
24
linear range was obtained. In the second method the membrane was imaged using the
ImageQuant LAS 4000 system (GE Healthcare).
2.3 LUCIFERASE ASSAY
Approximately 5 x 10⁴ cells were plated in each well of a 24-well plate. After 24
hours the cells were cotransfected with 100 ng/uL of a vector containing the firefly
luciferase gene under the control of one of three promoters, p53, p21, or bax, along with
10 ng/uL of the pRL-CMV vector which contains the Renilla luciferase gene under the
control of the CMV promoter. Twenty four hours after transfection some cells were
treated with DNA damaging agents. At the indicated time, zero to twenty four hours post,
the cells were harvested with 100 uL of Passive Lysis Buffer (Promega) incubated for 15
minutes at room temperature on the shaker. The experiments were run in duplicate or
triplicate. The samples were analyzed using the Dual-Luciferase Reporter System
(Promega). The luciferase readings were measured once with the Zylux FB12
luminometer. The ratio of Luciferase to Renilla was determined and averaged for each
set of duplicates or triplicates and normalized to a control. Standard deviations were also
determined for the duplicates or triplicates and normalized to the same control. If an
experiment was replicated then the normalized means were averaged and standard
deviations were calculated from the normalized means.
2.4 RNA PURIFICATION AND RT-qPCR
Approximately 1 x 10⁶ cells were plated on 100 mm cell culture dishes and after
25
were washed with 5 mL PBS, harvested by scraping in 1 mL of PBS, and pelleted by
centrifugation for 2 minutes. The supernatant was removed by aspiration and the RNA
was extracted using the Total RNA Purification Kit (Norgen Biotek). The RNA
concentration was determined using the Nanodrop 2000c (Thermo Scientific). cDNA
was transcribed from 2 ug purified RNA using the random decamers and the Reverse
Transcription System (Promega).
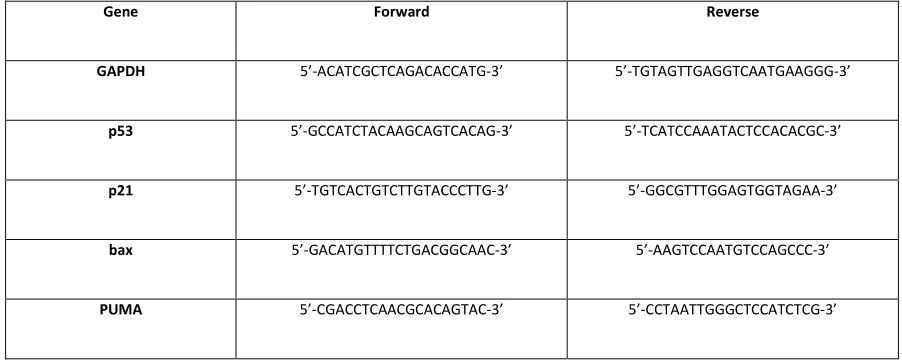
Amplification of the genes p53, p21, bax, and PUMA was achieved using primers
specific for use with Real-Time qPCR (Table 2.1) and the 7300 Real-Time PCR System
(Applied Biosystems) with a denaturation step at 95 oC for 10 minutes, followed by 40
cycles of denaturation at 95 oC for 15 seconds, primer annealing at 60 oC for 20 seconds,
and primer extension at 72 oC for 40 seconds, and lastly a final extension at 72 oC for 5
minutes. The reactions were run in triplicate and error bars indicate that samples were
run in multiple independent experiments. The housekeeping gene GAPDH was used as
an internal control. Experimental genes were normalized to the housekeeping gene and
26
Table 2.1 Forward and reverse primer sequences used for quantitative Real-Time PCR (Invitrogen).
Gene Forward Reverse
GAPDH 5’-ACATCGCTCAGACACCATG-3’ 5’-TGTAGTTGAGGTCAATGAAGGG-3’
p53 5’-GCCATCTACAAGCAGTCACAG-3’ 5’-TCATCCAAATACTCCACACGC-3’
p21 5’-TGTCACTGTCTTGTACCCTTG-3’ 5’-GGCGTTTGGAGTGGTAGAA-3’
bax 5’-GACATGTTTTCTGACGGCAAC-3’ 5’-AAGTCCAATGTCCAGCCC-3’
27
CHAPTER 3
RESULTS
3.1 EVIDENCE OF BINDING BETWEEN P53 AND HIV-1 TAT
Due to the evidence in the literature indicating the possibility of an interaction
between the tumor suppressor p53 and the HIV-1 Tat protein our lab decided to test for
direct binding between the two purified proteins (Duan, Ozaki et al. 1994; Li, Wang et al.
1995; Clark, Santiago et al. 2000; Gabizon, Mor et al. 2008). We first purified p53 and
HIV-1 Tat proteins by cloning cDNAs of Tat-101 and human wtp53 into the pET-52
vector. Ni-affinity chromatography was used to purify the His-tagged proteins from E.
coli, followed by separation on SDS-polyacrylamide gel electrophoresis with Coomassie
blue staining and immunoblotting with anti-p53 and anti-Tat antibodies (Figure 3.1).
28
Once purified, Tat and p53 proteins demonstrated complex formation in vitro
when co-immunoprecipitated with anti-p53 antibody and immunoblotted with anti-Tat
antibody (Figure 3.2A). p53-Tat complexes were also co-immunoprecipitated from cell
lysates of U2-OS cells transfected with the pcDNA3 Tat expression vector (Figure 3.2B).
In collaboration with Dr. Yeh at the BRITE Institute in Durham, NC, complexes were
also detected by florescence polarization assay between p53 and Tat peptides that
correspond to published interaction sites, 1-35 and 47-57, when increasing the
concentration of p53 (Figure 3.2C). Unlabeled Tat competes with FITC-Tat for binding
with p53 (Figure 3.2D).
D A
C
B
29
Considering the evidence that p53 and Tat are capable of binding, we were
interested in determining whether this interaction might minimize the innate host p53
response to HIV infection in a manner similar to the interaction between p53 and the p53
inhibitors produced by the small tumor viruses, such as SV40. We tested whether the
binding of p53 by Tat has a direct and negative effect on the ability of p53 to respond to
DNA damage. Our model system used U2-OS cells, because they naturally express
wild-type p53, which were manipulated to also express HIV-1 Tat. We used several DNA
damaging agents to induce a p53 damage response in cells both expressing and not
expressing HIV-1 Tat and studied the response of p53 through upregulation of its targets,
p21 and bax.
3.2 EXPRESSION OF HIV-1 TAT IN U2-OS CELLS
We created three U2-OS cell lines containing wild-type p53 that would also
express HIV-1 Tat. To create a cell line in which transcription of Tat could be induced,
we transfected a plasmid containing the HIV-1 Tat HA gene under the control of an
inducible pTRE2 promoter into Tet-On U2-OS cells. Individual clones were harvested
and tested for the presence of the pTRE2 Tat HA expression vector using PCR (Figure
3.3). Positive clones were then used western blotting to test for the presence of the Tat
HA protein before and after induction with 2 ug/ml doxycycline (Figure 3.4). We also
transfected a pcDNA3 plasmid containing the same HIV-1 Tat gene under the control of
a constitutively expressing CMV promoter into U2-OS cells and tested for the presence
30
blotting (data not shown). Clones positive for Tat protein were expanded and used in
immunoblotting, luciferase assays, and real-time PCR.
Figure 3.3 Presence of pTRE2 TatHA plasmid in transfected cells. Tet-On U2-OS cells were incubated with pTRE2 TatHA inducible expression vector, pSV2gpt selection vector, and Transfast transfection reagent. Clones were harvested and PCR was
31
3.3 CHARACTERIZATION OF THE EFFECTS OF DNA DAMAGING AGENTS ON
P53, THE P53 TARGETS, P21 AND BAX, IN CELLS EXPRESSING HIV-1 TAT
3.3.1 PROMOTER ACTIVITY (LUCIFERASE ASSAY)
In order to determine whether Tat was capable of inhibiting the p53 response to
DNA damage, we began by studying the promoter activity of the p53 targets, p21 and
bax, in the presence of increasing amounts of Tat using luciferase assays. Typically after
exposure to DNA damage an increase in p21 and bax promoter activity is reported. If Tat
is able to mitigate the p53 response we would expect to see a decrease in activity from
the p21 and bax promoters following DNA damage when Tat is present.
U2-OS cells were co-transfected with vectors carrying the luciferase gene under
the control of either the p21 or bax promoter along with either 0, 10, 25, 50, 100, or 250
ng of pcDNA3 HIV-1 Tat. A vector containing the Renilla-luciferase gene was also
included and acted as a control for transfection efficiency. Twenty four hours post Figure 3.4 Presence of HA tagged Tat protein in transfected cells after addition of doxycycline. Clones were left untreated or exposed to 2 ug/mL doxycycline to induce expression of TatHA protein in positive cells. First lane contains lysate from
32
transfection some of the cells were treated with DNA damaging agents to induce a p53
response. The DNA damaging agents used were 14 uM Camptothecin, 35 uM Cisplatin,
1 uM Doxorubicin, and 10 uM Etoposide. Luciferase and Renilla activity were measured
24 hours after the addition of DNA damaging agents to the cell culture media. The
normalized luciferase reading indicate the relative promoter activity under the observed
conditions.
The first set of experiments show a decrease in p21 promoter activity in the
presence of Tat, as would be expected if Tat were able to inhibit p53 (Figure 3.5A). The
same was true of bax promoter activity when Doxorubicin was added, however not when
Camptothecin or Cisplatin were present in the culture media (Figure 3.5B). This
decrease in activity was seen for both promoters even when no DNA damaging agent was
used to induce p53, which might be explained by Tat decreasing even basal levels of
activity. However from these experiments we are unable to determine whether each of
the DNA damaging agents can cause an increase in activity from the p21 or bax
promoters in the absence of Tat. While these results seem to support our hypothesis,
33
there were some large standard deviations and small sample size, so we wanted to repeat
the experiment and decided to focus on one DNA damaging agent, Doxorubicin.
Next we repeated the luciferase assay three times with duplicate samples of each
condition, using only one DNA damaging agent, Doxorubicin. We also included
transfections with two nonfunctioning Tat mutants that we did not expect to decrease p21
or bax promoter activity. The results fit our expectations in this regard since none of the
data fit a trend in promoter activity decreasing as Tat concentration increases (Figure
3.6). However there was also no evidence of a decrease in p21 promoter activity in the
presence of increasing amounts of full length Tat with p53 induction or without (Figure
3.6A). The trend of the data appears to show a decrease in the activity of the bax Figure 3.5 p21 and bax promoter activity after transfection with pcDNA3 TatHA and treatment with DNA damaging agents. U2-OS cells were transfected with pcDNA3 TatHA vector at 0, 25, 50, and 250 ng, and a luciferase vector controlled by either the p21 promoter (A) or the bax promoter (B). Twenty four hours later cells were either left untreated or treated with 14 uM Camptothecin, 35 uM Cisplatin, or 1 uM
Doxorubicin. Error bars represent normalized standard deviations between duplicate samples.
34
promoter with increasing concentrations of Tat, however the large standard deviations
cannot allow us to conclude that these data support our hypothesis.
A
B
35
Because we could not be sure of the actual concentration of Tat being produced in
the transfected cells, we decided to repeat the experiment with the Tat producing cell
lines U2-OS TatHA pool and U2-OS TatHA C4 (clone 4). We again tested the activity
of the p53, p21, and bax promoters in the presence of Tat and with p53 induction from
DNA damaging agents. U2-OS cells were used as a control. If Tat were able to block
the downstream effects of p53 we would expect a decrease in p21 and bax activity in the
Tat producing cell lines. Since the p53 promoter is not typically induced, we did not
expect to see a difference in activity in the presence of Tat.
While the U2-OS TatHA pool response was similar to U2-OS and did not show a
decrease in promoter activity when compared to the Tat free cells, we found it interesting
that the U2-OS TatHA C4 cell line that constitutively expresses Tat protein, displayed
higher baseline levels (without p53 protein induction through DNA damage) of activity
from all three promoters; twice as high from the bax promoter (Figure 3.7C) and nearly
three times higher activity from the p21 (Figure 3.7B) and p53 (Figure 3.7A) promoters.
36
B
Figure 3.7 p53, p21, and bax promoter activity in U2-OS cells constitutively
expressing HA tagged Tat and treated with DNA damaging agents. U2-OS cells and U2-OS cells constitutively expressing TatHA either from a pool or a cloned cell line where transfected with a luciferase vector controlled by a p53 promoter (A), a p21 promoter (B), or a bax promoter (C) and treated with either 14 uM Camptothecin, 35 uM Cisplatin, 1 uM Doxorubicin, and 10 uM Etoposide. Error bars represent the normalized standard deviation of duplicate samples.
37
There was also still an increase in activity from all three promoters after the addition of
DNA damaging agents even in the cells expressing Tat protein. Therefore we again
cannot conclude that this data supports our hypothesis that Tat inhibits the p53 DNA
damage response.
As was previously discussed HIV-1 infection is complex and the factors involved
change in response to numerous influences such as cell type and stage of infection. Due
to the complicated nature of HIV-1 infection, we decided to look at p21 promoter activity
at intervals over a 24 hour time frame in U2-OS cells and U2-OS TatHA C4 cells both
untreated and exposed to the DNA damaging agent Cisplatin. Because the inhibition of
p53 by Tat might logically be the most useful early during infection, in order to maximize
the rate of infection and number of infected cells before being destroyed by apoptosis, we
wanted to measure p21 promoter activity early following DNA damage. Given our
hypothesis the anticipated outcome was little change in the p21 promoter activity over
time when no DNA damaging agent is added, an increase in promoter activity in the
OS cell line upon addition of Cisplatin, and no change or a decrease in activity in the
U2-OS Tat C4 cell line upon addition of Cisplatin.
The untreated U2-OS cells show an interesting increase in p21 promoter activity
up to hour 8 and then a decrease to hour 24 (Figure 3.8). When the U2-OS cells were
treated with the DNA damaging agent Cisplatin at 35 uM the activity of the p21 promoter
does not increase from the baseline of 1.0 until hour 14 when it is 2.3 and remains at this
higher level of activity at hour 24. The U2-OS cell line constitutively expressing Tat
showed a 2 times greater baseline activity at 0 hours than did the U2-OS cell line. The
38
time course, most notably however was the drop in p21 promoter activity from 1.97 at 0
hours to 0.73 at 24 hours, which will be discussed in more detail in the following
paragraph. While the U2-OS TatHA C4 cells that were treated with 35 uM Cisplatin did
not exhibit this drop at the 24 hour time point, they also did not exhibit an increase in p21
promoter activity at any point over the baseline level of p21 promoter activity found in
the Tat positive cell line that would indicate a p53 response to DNA damage similar to
that seen in the U2-OS cell line exposed to Cisplatin. While these results do not support
our hypothesis in the anticipated manner, they also do not suggest that Tat is a benign
factor in U2-OS cells in the presence or absence of DNA damage.
Figure 3.8 p21 promoter activity in U2-OS and TatHA Clone 4 cells, untreated and treated with Cisplatin over 24 hours. U2-OS cells and TatHA C4 cells were
39
Moreover the drop in activity in the untreated Tat positive cell line at 24 hours
was of particular interest because all of the control samples for the other experiments
were harvested at time points that would be analogous to the 24 hour time point shown
here. Therefore if this drastic decrease in activity seen at 24 hours was present in the
other experiments, including qPCR and immunoblotting, it is possible that our control
samples are deceptively low and that is why the experimental samples appear high in
comparison. At the very least it illustrates a problem with collecting only one time point
when utilizing a dynamic system.
However prior to the final luciferase assay in which we learned the importance of
multiple time points, we performed several experiments to observe the effects
downstream of promoter activity. We assayed mRNA levels and protein levels of p53
and the p53 targets, p21, and bax using qPCR and immunoblotting.
3.3.2 mRNA EXPRESSION (QUANTITATIVE REAL-TIME PCR)
In order to compare the relative levels of mRNA in our experimental cell lines,
the cells were either left untreated or treated with a DNA damaging agent and harvested
after 24 hours. qPCR was used to amplify the genes p53, p21, and bax. Also due to a
suspicion that we were losing expression of the Tat gene after several passages in the
TatHA C4 clone we ran the experiment using cells that experienced a minimal number of
passages, and cells that experienced double that number. The cells that underwent few
passages are referred to as “early” while those that were grown in culture for a month
before the experiment are referred to as “late”. If there were a loss of Tat expression
40
line and the “late” TatHA C4 cell line. A decrease in p21 and bax mRNA expression in
the TatHA C4 cell lines after p53 induction via DNA damaging agents would support our
hypothesis that Tat is able to mitigate p53 activation of these targets.
There were some differences in mRNA expression in all of the cell lines (Figure
3.9), but the data does not support our hypothesis since neither the “early” nor “late” cell
lines exhibit a decrease in p21 and bax mRNA levels compared to the level in the U2-OS
cells when induced by DNA damaging agents. The basal p21 mRNA expression level in
the TatHA C4 cell line were not higher than the basal U2-OS level in the way that the
promoter activity was. The bax and p53 basal mRNA levels were only slightly higher in
the C4 cells compared to the basal level in the U2-OS cells, up 1.5 from 1.0.
The differences also do not clearly demonstrate a loss of Tat expression since the
expression seen in the “late” TatHA C4 cell line does deviate from the expression of p21
and bax seen in the U2-OS cell line for except the p21 levels when treated with
Doxorubicin and Etoposide(Figure 3.9B). Interestingly the mRNA expression in the
“late” cells also deviates from mRNA expression in the “early” cells for reasons that are
not entirely clear. It is possible that this is another artifact of only selecting one time
point in a system that seems to naturally be quite volatile over time.
This experiment was repeated in the TatHA pool cell line and the pTRE2 TatHA
42
3.3.3 PROTEIN EXPRESSION (IMMUNOBLOTTING)
We also examined p53 and p21 protein expression in the pTRE2 Tat HA
inducible cell line, the Tat HA pool, the Tat HA C4 cell line, and the U2-OS cell line 24
hours after activation of p53 with DNA damaging agents. If our hypothesis was correct
we expected to see a decrease in the p21 protein in the presence of Tat after activation of
p53 with DNA damage. Based on our hypothesis we did not expect to see a change in
p53 protein expression. Our initial blot using the inducible Tat HA cell line is not shown
due to high background, but it appeared to show a slight decrease in p53. However when
the experiment was repeated, the data showed no change in p53 or p21 protein expression
43
damaging agents (Figure 3.10). Expression of p21 protein after DNA damage in the Tat
HA pool was also assayed and compared to the U2-OS cell line (Figure 3.11). In this
case the results indicated that the levels of p21 protein were lower in the Tat positive cell
line than in the U2-OS control cell line when p53 is activated by DNA damage. While
this appears that Tat may be inhibiting p21 expression it is rather far downstream from
the p53 trans-activating step which we hypothesized to be targeted. As discussed in the
next section, overall we have not been able to clearly demonstrate an effect of Tat on p53
activity in this model system. There are numerous possibilities for these results aside
from the possibility that there is no affect due to a Tat-p53 interaction. Considering the
important role p53 has been shown to play in many viral infections, we find it unlikely
that a viral protein that binds to p53 during infection has no effect on its activity.
44
45
CHAPTER 4
C
ONCLUSIONSOur hypothesis that Tat could mitigate the ability of p53 to transactivate its
downstream targets was based on our own preliminary data and published reports of
evidence of binding between Tat and p53 (Clark, Santiago et al. 2000; Gabizon, Mor et
al. 2008). There are also reports that Tat is able to regulate transcription of p53 while
p53 can mitigate the trans-activating function of Tat (Duan, Ozaki et al. 1994; Li, Wang
et al. 1995). Our hypothesis took into account that the small tumor viruses produce
factors capable of binding and inhibiting p53 as a way of escaping cell cycle arrest and
apoptosis in order to complete the viral life cycle.
Taken in concert our data do not indicate that the presence of Tat can inhibit the
ability of p53 to induce the targets p21 and bax when p53 is induced by the DNA
damaging agents 14 uM Camptothecin, 35 uM Cisplatin, 1 uM Doxorubicin, and 10 uM
Etoposide in U2-OS cells. The results of our luciferase assays, immunoblots, and qPCR
do not convincingly and repeatedly show a decrease in the promoter activity, mRNA, or
protein of p21 or bax in the presence of Tat when treated with DNA damaging agents.
However we have evidence of a phenomenon in which the activity of the p21
promoter decreases drastically in the presence of Tat at 24 hours. We have also
demonstrated that in U2-OS cells constitutively expressing Tat, the p53, p21, and bax
promoters are all at least twice as active as in U2-OS cells not expressing Tat. While
46
future research. We plan to further investigate the activity of the p53, p21, and bax
promoters in the presence of the DNA damaging agents in the U2-OS and the U2-OS Tat
C4 cell lines over a 24 hour timespan. Eventually we hope to expand that to examine the
levels of mRNA and protein as well.
We also recognize that the system utilized in this study is imperfect for examining
conditions in HIV infected cells. We are currently working on a method of inducing p53
using type-1 interferon instead of chemotherapeutic agents which will induce p53 PTMs
and a host cellular response more similar to a cell that has been infected with HIV-1. The
DNA damaging agents may be activating a p53 pathway that is unrelated to viral
infection. When utilizing IFN to activate p53, we can monitor a p53 target specific to
this pathway, IRF9 (Munoz-Fontela, Macip et al. 2008). Also instead of using
osteosarcoma cells we think the most biologically relevant cell type for this study would
be a T-cell line expressing wild-type p53 or primary T-cells. Our collaboration with the
Gatignol HIV lab at McGill University in which infections with HIV are being performed
will hopefully allow us to carry out analogous experiments in T-cell lines that have been
infected with HIV-1. Although we have been unable to detect a consistent effect of Tat
on p53 activity, there were still noteworthy differences in the Tat positive cells that make
us eager to move forward in this area of research, exploring the interaction between the