Abstract
Miller, Scott Franklin. Wire Electro-Discharge Machining of Advanced Engineering Materials. (Under the direction of Dr. Albert Shih)
The goal of this research was to create models and guidelines for Wire Electrical
Discharge Machining (WEDM) of new advanced engineering materials and for truing of
metal bond diamond grinding wheels. The development of new advanced engineering
materials and the need to meet demand for precise and flexible prototype and low-volume
production of components has made WEDM an important manufacturing process. One goal
of this research is to investigate the effect of spark on-time duration and spark on-time ratio,
two critical WEDM process parameters, on truing of metal bond diamond grinding wheels
and machining of three types of new advanced engineering materials; porous metal foams,
sintered Nd-Fe-B magnets, and carbon-carbon composite fuel cell bipolar plates. An
envelope of feasible process parameters for material removal rate is developed for each
material, according to machine, tooling, and physical limitations. This envelope is then
applied to cut sections of carbon-carbon bipolar plate and sintered Nd-Fe-B magnet to
minimum thickness. Effect of process parameters on limit of thickness of the sintered
Nd-Fe-B magnet is discussed. The surfaces machined by WEDM were qualitatively studied
using Scanning Electron Microscopy to observe surface features and characteristics.
Experiments were conducted to measure temperatures generated during the EDM process
using infrared spectrometry on three different materials; 1. metal bond diamond grinding
Wire Electro-Discharge Machining of Advanced
Engineering Materials
by
Scott Franklin Miller
A thesis submitted to the Graduate Faculty of
North Carolina State University
in partial fulfillment of the
requirements for the Degree of
Master of Science
Department of Mechanical and Aerospace Engineering
Raleigh
2003
A
PPROVEDB
Y:
______________________ _______________________
Biography
Scott Miller was born in Boone, a small town in the mountains of western North
Carolina. He was the first of three children in the Miller family. During Scott’s childhood
his parents supported academics, sports, and activity, in that order. In elementary school and high school Scott enjoyed playing sports and hanging out with his friends. Football and
baseball were the sports of choice. After high school he was unsure of his future plans; so he
decided to attend Appalachian State University to continue his education. During his first
two years of college he discovered his inclination to math and science. In order to focus on
and combine these subjects, he decided to pursue a degree in Engineering. In the Fall semester of 1999, he transferred to North Carolina State University in Raleigh, NC. From his
first class in Engineering, he was sure that he had made the correct decision. After five
semesters and a semester of Cooperative Education, he graduated Summa Cum Laude with a
Bachelor of Science in Mechanical Engineering in the spring of 2002. During his
undergraduate studies at North Carolina State University Dr. Albert Shih recruited him for graduate studies. Under the guidance of Dr. Albert Shih, Scott has spent the last two
semesters working toward obtaining a Master of Science Degree in Mechanical Engineering.
He conducted his research at NC State University and Oak Ridge National Lab. He will be
Acknowledgements
To Dr. Albert Shih, I am glad you convinced me to come to graduate school; I value
the things I learned about myself as much as the technical knowledge gained. Your kindness,
patience, and laughter made the experience enjoyable. To my committee members, Dr. John Strenkowski and Dr. Ron Scattergood, I appreciate the contribution of your time and efforts.
Thanks to Oak Ridge National Laboratory especially the High Temperature Materials
Laboratory for facilitating me during my SEM investigations. Special thanks must be given
to Sam McSpadden and Dorothy Coffey for their assistance and preparation before each of
my visits.
The authors acknowledge Magnequench and Dr. B. M. Ma for the sintered Nd-Fe-B
permanent magnets, Porvair PLC and Dr. K. Butcher for the metal foam and carbon-carbon
Table of Contents
List of Tables ...v
List of Figures ... vi
Chapter 1. Introduction...1
Chapter 2. Experimental Setup ...4
2.1. Basic Principles of Electrical Discharge Machining ...4
2.2. Description and Background of Materials ...7
2.2.1. WEDM Machine...7
2.2.2 Work Materials ...7
2.3. Setup of Material Removal Rate Study...11
2.3.1. Process Parameters for Material Removal Rate Study...11
2.3.2. Workpiece Setup ...12
2.4. Experimental Procedure...13
2.5. Procedure for Cutting Thin Sections ...14
Chapter 3. Results of Material Removal Rate Study and Cutting Thin Sections ...15
3.1. Envelope of Material Removal Rate...15
3.2. Results of Material Removal Rate Study...17
3.2.1. Metal Foams ...17
3.2.2. Metal Bond Diamond Grinding Wheels ...19
3.2.2. Metal Bond Diamond Grinding Wheels ...20
3.2.3. Sintered Nd-Fe-B Permanent Magnet ...22
3.2.4. Carbon-Carbon Bipolar Plate ...23
3.2.5. Results of Regression Modeling ...24
3.2.6. General Results of Material Removal Rate Study...25
3.3. Application of Cutting Thin Sections ...26
3.3.1. Thin Section Cutting Application of Carbon-Carbon Bipolar Plate...26
3.3.2. Cutting Thin Sections of Sintered Nd-Fe-B Magnet ...27
Chapter 4. Scanning Electron Microscope (SEM) Investigation...30
4.1. SEM of WEDM Surface of Porous Metal Foams ...31
4.2. SEM of WEDM Surface of Carbon-Carbon Bipolar Plate...35
4.3. SEM of WEDM Surface of Sintered Nd-Fe-B Magnet Thin Sections ...37
Chapter 5. EDM Temperature Measurement Using Infrared Spectrometry...39
5.1. Setup of Spark Temperature Measurement ...40
5.1.1. Workpiece Preparation ...40
5.1.2. Temperature Measurement Procedure ...41
5.2. Data Analysis and Results ...42
Chapter 6. Conclusions ...48
List of Tables
Chapter 2
Table 2.1: Material comparison...9
Chapter 3
Table 3.1: Results of regression modeling ...24 Table 3.2: Results of model of cutting thin sections ...28
Chapter 5
List of Figures
Chapter 1
Figure 1.1: The wire EDM process, (a) conventional 2D wire EDM operation,
(b) enlarged view of the wire and workpiece ...1
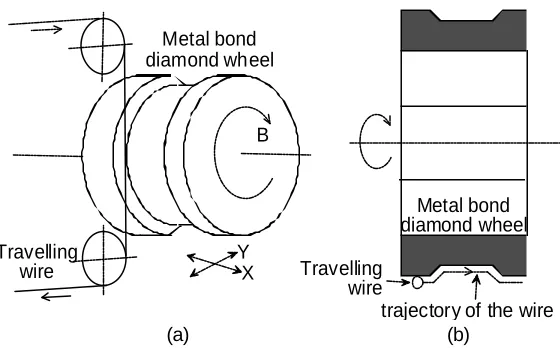
Figure 1.2: Wire EDM of metal bond diamond wheel, (a) configuration of the operation, (b) top view of the trajectory of the wheel ...1
Chapter 2 Figure 2.1: Evolution of a single spark in the EDM process ...6
Figure 2.2: (a) Porous 316 stainless steel foam (b) Porous Fe-Cr-Al foam ...9
Figure 2.3: Diagram of voltage cycle in EDM ...11
Figure 2.4: Fixed workpiece ...13
Figure 2.5: Starting position of cut ...13
Chapter 3 Figure 3.1: Typical envelope of the WEDM process ...15
Figure 3.2: Material removal rate graphs for porous metal foams and steel plate ...19
Figure 3.3: Truing profile ...20
Figure 3.4: Material removal rate graphs for metal bond diamond grinding wheels ...21
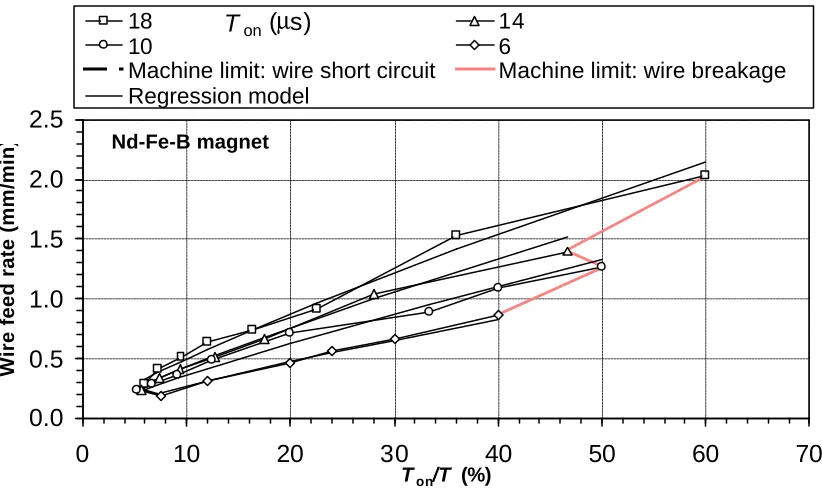
Figure 3.5: Material removal rate graph for sintered Nd-Fe-B magnet...22
Figure 3.6: Material removal rate graph for carbon-carbon bipolar plate ...23
Figure 3.7: Thin sections of carbon-carbon bipolar plate ...26
Figure 3.8: Nd-Fe-B magnet thin sections ...27
Figure 3.9: Energy graph of EA and Ev for three Ton settings ...29
Chapter 4 Figure 4.1: Hitachi S-4700 field emission SEM ...30
Figure 4.2: 316 stainless steel foam...32
Figure 4.3: Fe-Cr-Al foam...32
Figure 4.4: SEM micrograph of WEDM of 316 stainless steel foam...33
Figure 4.5: SEM micrograph of WEDM of Fe-Cr-Al foam...34
Figure 4.6: (a) Carbon-carbon bipolar plate (b) Carbon-carbon bipolar plate cut by EDM....35
Figure 4.7: Sintered Nd-Fe-B magnet, (a) 18 µs (b) 10µs (c) 2 µs ...38
Chapter 5 Figure 5.1: (a) Setup (b) Signal acquisition (c) Close-up view ...42
Figure 5.2: Copper temperature measurement 1...46
Figure 5.3: WC-Co temperature measurement 1 ...46
Chapter 1. Introduction
The development of new advanced engineering materials and the need to meet demand
for precise and flexible prototype and low-volume production of components has made wire
electrical discharge machining (WEDM) an important manufacturing process. The WEDM
(a) (b)
Figure 1.2: Wire EDM of metal bond diamond wheel, (a) configuration of the operation, (b) top view
of the trajectory of the wire
Travelling wire X Y B Metal bond diamond wheel
trajectory of the wire Travelling
wire
Metal bond diamond wheel
(a) (b)
Figure 1.1: The wire EDM process, (a) conventional 2D wire EDM operation, (b) enlarged view of the wire and workpiece
Electrical sparks between gapto remove work-material Travellingwire
Travellingwire
X Y
Workpiece
process, as shown in Figure 1.1(a), generates the desired shape by using electrical sparks
between a thin, traveling brass wire electrode, ranging from 0.02 to 0.40 mm in diameter, and
workpiece t o erode a path in the workpiece material. Figure 1.1(b) shows continuous electrical sparks being generated between the wire and workpiece for material removal. By
using computer numerical control, the thin wire is guided in X and Y directions to cut a
precise shape from the workpiece. The cutting force generated in WEDM is small, which
makes it suitable for manufacturing miniature features and micro-mechanical components.
This process can also be used to machine cylindrical parts and true metal bond diamond grinding wheels, by adding a rotary spindle to the WEDM machine, as Figure 1.2 shows.
The selection of proper process parameters for new WEDM applications, such as
machining advanced engineering materials, micro-fabrication, truing of diamond grinding
wheels, etc, is not readily available. Process parameter selection has a significant effect on
WEDM efficiency and limitation. For a commercial WEDM machine, the manufacturer usually provides a database of setup process parameters for commonly used work and
electrode materials under typical operating conditions. Such a database does not include the
growing amount of advanced engineering materials or WEDM applications. One of the goals
of this research is to investigate the effect of spark on-time duration and spark on-time ratio,
two critical WEDM process parameters, on truing of metal bond diamond grinding wheels and machining of three types of new advanced engineering materials: porous metal foams,
sintered Nd-Fe-B magnets, and carbon-carbon composite fuel cell bipolar plates. An
envelope of material removal rate for selection of process parameters is generated for each
material. This envelope is applied to enable the machining of thin sections of carbon-carbon
models and guidelines for WEDM of new engineering materials and for truing of metal bond
diamond grinding wheels are developed.
The removal of material depends largely on thermal principle; the EDM machine supplies the system with electrical energy, which is mainly converted into thermal energy in the
discharge channel during the spark discharge. The thermal energy melts workpiece material
during the process. To acquire more insight into the processes of EDM, including the phase
transitions of the machined material, it is important to know the temperature of the machined
material. Another goal of this research is to measure temperature during WEDM machining using infrared spectrometry. Measurements are taken on a variety of materials, including
WC-Co, copper, and metal bond diamond grinding wheels.
A description of the WEDM process is in Chapter 1. Chapter 2 provides WEDM
basic principles, experimental setup, and background for the material removal rate study,
which focuses on machining new advanced engineering materials. Chapter 3 gives the results of the material removal rate study and cutting of thin sections of sintered Nd-Fe-B
magnets. SEM investigation of surface finish is carried out in Chapter 4. Chapter 5 presents
the research on spark temperature measurements by using near infrared spectrometry. And
Chapter 2. Experimental Setup
Since new WEDM applications, such as machining of new advanced engineering
materials, micro-fabrication, truing of diamond grinding wheels, are not a traditional process,
the selection of proper process parameters is not readily available. Material removal rate
(MRR) depends heavily on process parameter selection. The goal of this study is to
investigate the effect of spark on-time duration and spark on-time ratio, two critical WEDM
process parameters, on truing of metal bond diamond grinding wheels and machining of three
types of new advanced engineering materials; porous metal foams, sintered Nd-Fe-B
magnets, and carbon-carbon composite fuel cell bipolar plates. For each of these materials,
an envelope of MRR is generated based on selection of process parameters. This envelope is
applied to cut thin sections of carbon-carbon bipolar plate. Effect of process parameters on
limit of thickness of the sintered Nd-Fe-B magnet is discussed. A model for WEDM of thin
sections of sintered Nd-Fe-B magnets is developed.
Some papers discussing EDM performance concern volumetric material removal of
materials such as SiC/Al, PCD blanks, and advanced ceramics, while varying certain
parameters [Hocheng et al.,1997; Kozak et al., 1994; Lok et al., 1997].
2.1. Basic Principles of Electrical Discharge Machining
The following figure and description represents what is known and what is theorized
behind the generation of spark erosion in the EDM process. Several theories have been
presented over the years regarding how EDM works. But most of the evidence supports the
illustration show how the voltage and current relatively vary from step to step. In all of the
diagrams, the wire electrode (anode) is the upper dark material of positive charge and the
workpiece is the lower serrated part of negative charged. The dielectric fluid in the machining gap separates these two surfaces, and serves as an insulator to keep electrical
charge from flowing from one surface to another [Rajurkar, 2001].
Figure 2.1(a) shows what happens with the charged electrode is first brought near the
workpiece. As the potential difference increases between the surfaces, the dielectric fluid
breaks down and becomes ionic (electrical conductive). The electrical field is strongest at the point where the distance between the surfaces is minimal; thus the spark will occur at this
location. Note the graph in the illustration shows potential (voltage) has increased, but no
current is flowing because of the presence of the dielectric fluid.
Next as shown in Figure 2.1(b), the number of ionic particles increases, making the
insulating properties of the dielectric fluid begin to fail along a narrow channel at the high point. Voltage reaches its peak, but current is still not flowing.
Figure 2.1(c) shows that a current is established, causing the voltage to decrease.
Figure 2.1(d) shows the voltage is continuing to drop as current continues to rise. The heat
builds up rapidly, causing some of the fluid, workpiece, and electrode to vaporize. A
discharge channel now begins to form between the electrode and workpiece.
Figure 2.1(e) depicts a vapor bubble trying to expand outward, but a rush of ions
towards the discharge channel limits its expansion. The intense electro-magnetic field that
has built up in the channel attracts these ions. The current continues to rise as the voltage
Figure 2.1(f) is during the end of the time when the voltage is on. Here the current
and voltage have stabilized. The heat and pressure inside the bubble have reached maximum
values and some metal is being removed. The metal directly under the discharge column is
in the molten state, but is held in place by the pressure of the vapor bubble.
Figures 2.1(g) 2.1(h), and 2.1(i) show what happens during the time when no voltage
is applied. Both voltage and current go to zero, which causes the temperature and pressure to
rapidly decrease in the vapor bubble causing it to collapse. This collapsing bubble allows the
molten material to be expelled from the surface of the workpiece. Fresh dielectric fluid (a) (b) (c)
(d) (e) (f)
(g) (h) (i)
rushes in, flushing the debris away and quenching the surface of the workpiece. Unexpelled
molten metal solidifies back to the surface to form what is known as the recast layer. This
complete process of voltage on and off time comprises the EDM spark cycle.
2.2. Description and Background of Materials
2.2.1. WEDM Machine
The WEDM experiments are conducted on a Brother HS-5100 WEDM. Results in
this study are machine dependent. However, the results obtained in this research can be
summarized into guidelines and applied or calibrated to different kinds of WEDM machines. A commonly used copper wire of 0.25 mm nominal diameter is used for wire electrode.
2.2.2 Work Materials
Six work materials include two metal foams, two metal bond diamond grinding wheels, one sintered Nd-Fe-B magnet, and one carbon-carbon bipolar plate. A description of
the new advanced engineering materials researched follows:
1. Metal Bond Diamond Grinding Wheels: The advancement of engineering ceramics is
hindered by high manufacturing cost, particularly in precision grinding to generate the desired form geometry. This technical challenge is further narrowed down to generate
the precise form on diamond grinding wheels. Diamond, the hardest material, is difficult
The wire EDM process can be used to create an intricate shape on a rotating metal
bond diamond wheel for precision form grinding of ceramics and other
difficult-to-machine materials [Rhoney, et al., 2002]. The concept studied in this research is using the wire EDM to machine or true a rotating metal bond diamond wheel, as shown in
Figure 1.2, to generate the precise form. By adjusting the process parameters, high MRR,
higher than 2D EDM cutting, can be achieved. This study also identifies critical process
parameters and boundaries that limit MRR.
Much research has been conducted on the EDM over the past two decades. However, much of the work has been on developing better power sources, discharge patterns, and
improving gap conditions. One of the first papers that discussed EDM truing was by
Suzuki et al. [1987]. This paper considers both wire and electrode EDM of metal bonded
wheels. It discusses the problems associated with traditional truing of the hard metal
bonded wheels.
Two metal bond diamond grinding wheels were studied. One has the 320 ANSI mesh
size diamond (average size of 54 µm). This wheel was manufactured by
Norton/Saint-Gobain with tradename of Scepter. The other is a bronze bond diamond wheel (Inland
MD1200N50M-1/4) with very fine, 1200 ANSI mesh size diamond (average size of 6 µm).
2. Porous Metal Foams: Metal foam materials have great potential for the fuel cell and
lightweight structural material for aerospace and automotive applications. EDM is
particularly suitable for machining metal foam due to the low cutting force to avoid the
Table 2.1 gives a material
comparison of the two types of
porous metal used in this research. One material is the Fe-Cr-Al alloy,
which is a high temperature
oxidation resistance material that can
withstand operation temperature in excess of 1200 C. The other material is 316 stainless
steel porous metal. The foam structure, as shown in pictures from a scanning electron microscope in Figure 2.2, consists of ligaments making up a network of interconnected,
dodecahedral-shaped cells. The cells are oriented randomly. The individual ligaments
are hollow with a triangular-shaped shaft, which is a result of the applied manufacturing
technique. The metal foams are produced using open cell polyurethane foam as a
template [Ashby et al., 2000; Banhart, 2001]. The metal powder slurry is coated to the polyurethane foam and fired in a kiln. The polyurethane foam is burned out during the
process, leaving the triangular-shaped hollow shaft inside each of the ligaments.
Material Fe-Cr-Al
316 Stainless
Steel Density (kg/m3) 7150 7980
Electrical resistivity (ohm-mm) 0.0014 0.00078 Heat capacity (J/g-°C) 0.46 0.49 Thermal conductivity (W/m-k) 16 16.3 Melting temperature (°C) 1500 1400
Yield strength (MPa) 550 290 Ultimate tensile strength
(MPa) 750 580
(a) (b)
Figure 2.2: (a) Porous 316 stainless steel foam (b) Porous Fe-Cr-Al foam
3. Sintered Nd-Fe-B Permanent Magnetic Materials: The needs for energy-efficiency and
miniaturization of mechanical devices have created applications of rare-earth permanent
magnets as opposed to traditional ferrite. The sintered Nd-Fe-B magnet has the combined cost and performance benefits. This material is very brittle. The magnet is
Neomag 34KC2, provided by Magnequench. The nanocrystalline Nd-Fe-B powder is
sintered by the hot-isostatic press and then magnetized to become the permanent magnet.
This research investigates effects of EDM process parameters on MRR, as well as wire
EDM of miniature features of Nd-Fe-B permanent magnets for miniature motor, generator, and actuator applications. In this study an additional set of tests was
conducted to evaluate variation in thickness due to EDM process parameters when
machining miniature features.
4. Carbon-Carbon Bipolar Plates: Proton exchange membrane fuel cell development
challenges include reducing weight, cost, and volume of the fuel cell stack. A key component of the fuel cell is the bipolar plate that separates cells in the stack and
provides channels for gas flow. The requirements for bipolar plates include cost of
material and processing. The carbon-carbon bipolar plate, provided by Porvair LLC, uses
slurry molded carbon fibers, about 0.4 mm long and 0.01 mm in diameter, which is
sealed with chemically vapor-infiltrated carbon [Besmann et al., 2000]. The material has an electrical conductivity of 0.4 Ocm2 at 1.15 A/cm2 and 0.9 Ocm2 at 0.05 A/cm2 current density. A plate of 2.3 mm thickness is used in this study. An additional set of tests was
conducted to illustrate the application of region of feasible process parameters to enable
2.3. Setup of Material Removal Rate Study
When performing the removal rate study WEDM certain procedures must be
followed in order to insure maximum MRR. The description of process parameters and
experimental procedure follow.
2.3.1. Process Parameters for Material Removal Rate Study
Since WEDM of the materials in this study is not a traditional EDM process,
predetermined EDM parameters are not established. Through an understanding of how the
parameters interact and trial and error the parameters are adjusted to perform this research. A
discussion of the significant process parameters follows:
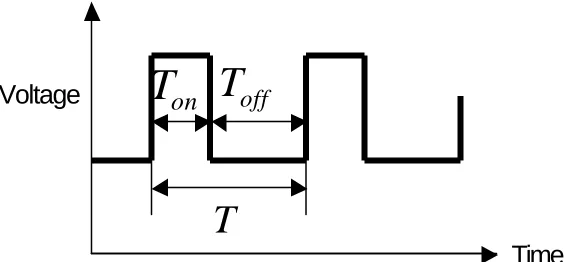
The two main process parameters investigated in this study are spark cycle and spark
on-time. Figure 2.3 shows the ideal waveform of voltage between the workpiece and
electrode versus time during EDM. As shown in Figure 2.3, the spark cycle, T, is the period
of the spark, including both on time and off time. EDM uses a DC power supply and capacitor like energy storage bank to create the discharge. During the off time, Toff, the
capacitors are charged up and melted material is flushed from the gap between the wire
Voltage
Time
on
T
T
offT
electrode and workpiece. Then the circuit is completed, the spark is discharged, and the
energy is delivered during the on time, Ton, which is the spark on-time. This total time for
charging and discharging is the spark cycle. This research studies the effect of Ton and Ton/T
on EDM MRR.
The gap voltage is the nominal voltage in the gap between the wire and workpiece.
Thus, increasing distance between the wire and workpiece means increasing gap voltage, and
vise versa. Increasing gap voltage also usually means decreasing cutting speed. The WEDM
training manual compares gap voltage to feed of workpiece of a band saw.
Wire feed rate is traverse velocity of the wire as it moves through the workpiece. It
determines how fast you cut the workpiece. It is important to note that this is not a constant
speed, but it can be thought of as maximum possible speed. The machine reads the actual
gap voltage, and automatically increases or decreases feed rate to maintain constant gap
voltage.
2.3.2. Workpiece Setup
As shown in Figure 2.4, in typical WEDM the workpiece is fixed to a worktable,
which serves as the electrical ground, inside the EDM machine to complete the circuit. In
order to determine orientation of the workpiece relative to wire, an edge find command is
executed. The wire moves in slowly until it detects the electrical ground of the workpiece.
The wire is then backed away from the edge about 2.5 mm in order to allow sufficient space
for the machine to automatically rethread the wire in the event of wire breakage. This is the
workpiece in EDM is submerged in a dielectric fluid for improved flushing and thermal
control.
The preparation for the metal bond diamond grinding wheels is different from the
above setup in the following respects. The grinding wheel is attached to a hub. The
wheel/hub assembly is attached to the shaft of a rotary spindle, which is bolted to the
worktable in the EDM machine. Only the water jets provide the dielectric fluid; the fluid
does not submerge the grinding wheel. Flushing is not an issue, since the wire is only working on the surface, and is not buried within the material.
2.4. Experimental Procedure
Experiments are conducted during machining a straight path into the workpiece.
During the experiments five Ton at 18, 14, 10, 6, and 4 µs are selected. It should be noted that
the setting of 4 µs generates energy density that is too small, at any spark cycle, T, to cut the
sintered Nd-Fe-B magnet or the metal bond diamond grinding wheels. At each Ton, the ratio
of Ton/T is gradually increased until wire breakage and decreased until wire short occurs. All
other process parameters are held constant during the experiments, excluding the wire feed
Figure 2.4: Fixed workpiece
rate. The EDM machine automatically varies the wire feed rate, or cutting speed, in an
attempt to maintain the target gap voltage. During the MRR experiments the wire feed rate is
averaged over the entire cutting time. These averages are the collected data.
The range for spark cycle (T) is from 10–1000 µs, and for spark on-time is from 2–18
µs. These values correspond to the machine limits for the Brother HS-5100 WEDM. It
should be noted that the setting of 2 µs is a special low energy setting not used in typical
EDM machining. Wire feed rate is set at 15 mm/s, wire tension at 0.15 N, and gap voltage
between wire electrode and workpiece is set at 35 V.
2.5. Procedure for Cutting Thin Sections
A growing WEDM application regards fabrication of miniature components. An
application of the envelope of process parameters is cutting thin sections. Process parameters
used in cutting carbon-carbon bipolar plate thin sections are determined from the acquired
envelope for the carbon-carbon bipolar plate. The process parameter settings for maximum
energy density and minimum energy density are selected. The three selections of spark
on-time used for cutting thin sections of sintered Nd-Fe-B magnet material are 18, 10, and 2 µs,
which are chosen based on spark on-time available range.
In each cut of the carbon-carbon bipolar plate length of cut is 24.0 mm. In each cut of
sintered Nd-Fe-B magnet material height is 1.5 mm and the machine is stopped after a length
of 3 mm of cutting. In each experiment made with a certain set of process parameters, the cut of specified dimensions is made with the third dimension decreasing with each cut, until
Chapter 3. Results of Material Removal Rate Study and Cutting
Thin Sections
There are machine, tooling, and physical limitations that constrain the material
removal process in WEDM. An envelope of feasible Ton and Ton/T process parameters can be
generated on the chart of material removal rate, (MRR), vs. Ton/T to characterize the WEDM
process for a particular material. The limitations, MRR envelope, and results of the MRR
study are discussed in Chapter 3.
3.1. Envelope of Material Removal Rate
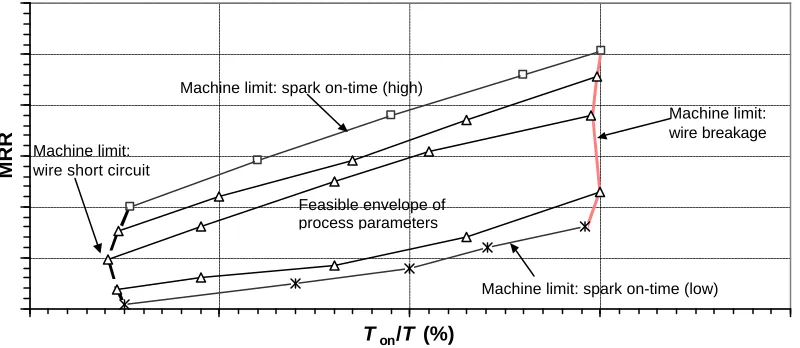
Figure 3.1 shows a sample graph of the envelope of process parameters for traditional
WEDM application. The MRR for each material follow this general format. In the graph the
X-axis represents Ton/T (%), or percentage on-time of the spark. The Y-axis represents rate
of performance for the WEDM machine. The actual units vary depending on the type of
machining performed. For non-rotary applications (porous metal, permanent magnet,
Figure 3.1: Typical envelope of the WEDM process Ton/T (%)
MRR
Machine limit: spark on-time (high)
Feasible envelope of process parameters
Machine limit: spark on-time (low) Machine limit:
wire short circuit
carbon-carbon bipolar plate, steel plate), the Y-axis represents wire feed rate, or cutting
speed of the wire through the workpiece in units of mm/min. For rotary applications
(diamond grinding wheel), the Y-axis represents MRR in units of mm3/min.
The 5 spark on-time settings, Ton, selected (18, 14, 10, 6, 4 µs) are represented in the
Figure 3.1 as series with specified markers. The machine upper and lower limits for Ton are
18 and 4 µs, respectively. For every material studied with the exception of the carbon-carbon
bipolar plate, the major machine limits of wire breakage and wire short circuit existed. When the spark on-time ratio, Ton/T, reaches an upper limit, the energy density is high, and
occurrence of electrical spark becomes frequent. This results in the electrical sparks eroding
the wire to the point of wire breakage during cutting, which is represented by the thick solid
line in Figure 3.1. When Ton/T approaches the lower limit, the energy density is low, and
occurrence of electrical spark becomes rare, increasing the risk of the wire electrode touching the workpiece. The event of wire touching workpiece shorts the electrical circuit, and causes
cutting to stop due to the wire short circuit alarm, which is represented in Figure 3.1 by a
thick broken boundary. It should be noted that these boundaries are not exact. These
boundaries merely indicate high probability that the indicated machine limit will be reached.
In each graph, excluding the graph for the carbon-carbon bipolar plate, thin lines without markers represent regression modeling. In this study regression modeling is
performed directly on the source data in the data analysis package of Microsoft Excel. The
purpose of regression modeling is to find a relationship among certain factors in an analysis.
cycle, T. The form of the regression model for MRR is:
( )
c b onT T
T a
MRR ⋅
⋅
= (1)
The regression analysis determines variables a, b, and c in the equation.
3.2. Results of Material Removal Rate Study
MRR is used to measure the efficiency of a process. The effects of Ton and Ton/T are
key factors regarding MRR. The results of the MRR study follow. An envelope of process
parameters is presented for each material in the study along with discussion.
3.2.1. Metal Foams
Figure 3.2 shows the envelope of process parameters for 316 stainless steel foam,
Fe-Cr-Al foam, and the carbon steel plate, with the same effective thickness as the foams. As
the graph illustrates, under similar cutting condition, higher MRR is possible with the metal
foams. This is due to the better flushing condition with the porous metals. The 316 stainless steel foam has a higher MRR than the Fe-Cr-Al foam. This can be predicted from the
material properties of electrical resistivity and melting temperature, since EDM uses
electrical sparks to melt the material it removes. Fe-Cr-Al and 316 stainless steel have
electrical resistivities of 0.0014 and 0.00078 ohm-mm, respectively, and melting
proved to be most difficult to cut, with a maximum feed rate of only 18.8 mm/min. Letters in
the metal foam graphs signify process parameters to be investigated in the SEM study in
Chapter 4.
It should be noted that regression analysis, shown in thin lines in the MRR graphs is
not perfect. For most of the data regression analysis closely modeled the MRR. However,
regression analysis is not perfect, and regression lines did stray from the experimental curve
in some graphs. The regression model for 316 stainless steel appears to be the most
Porous 316 stainless steel 0 10 20 30 40 50 60
Wire feed rate (mm/min)
18 14
10 6
4 Machine limit: wire short circuit
Machine limit: wire breakage Regression model
Ton (µs)
Porous Fecralloy (Fe-Cr-Al)
0 10 20 30 40 50 60
Wire feed rate (mm/min)
Carbon steel plate
0 10 20 30 40 50 60
0 10 20 30 40
Ton/T (%)
Wire feed rate (mm/min)
Figure 3.2: Material removal rate graphs for porous metal foams and steel plate
V
f
Grinding
Wheel
R
r
Figure 3.3: Truing profile
3.2.2. Metal Bond Diamond Grinding Wheels
As mentioned earlier, the machine performance measured is volumetric MRR for
metal bond diamond grinding wheels. The mathematical formula to calculate the material
removal rate for cylindrical wire EDM has been derived
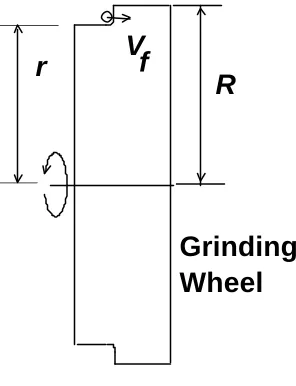
by Qu et al. [2002a]. The straight truing configuration, as
shown in Figure 3.3, was used for this test. Some
theoretical equations can be derived to describe the
calculation for MRR:
) (R2 r2 Vf
MRR =π − (2)
where R is the original radius of the grinding wheel, r is
the new reduced radius of the grinding wheel after
material has been removed, and Vf is the machine cutting speed, or wire feed rate associated
with the WEDM machine. Eq. (2) relies on assumptions of constant Vf, and constant r during machining.
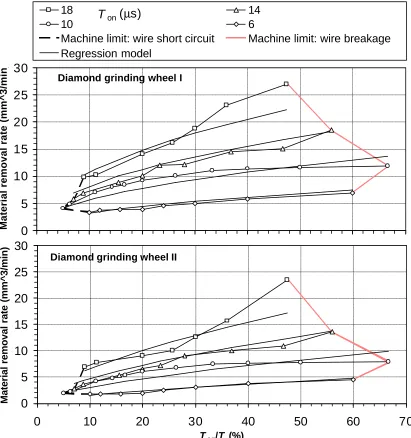
Figure 3.4 shows the MRR graphs for the two grinding wheels in the study. Diamond
grinding wheel I is the Norton Scepter eight inch, 320 grit wheel, and Diamond grinding
wheel II is the bronze bond wheel (Inland MD1200N50M-1/4). The figure shows higher
MRR is possible for the Norton Scepter wheel. This is due to the smaller grit size and material properties of the bronze bonded wheel. The maximum material removal rates of the
Norton Scepter wheel and Inland bronze bonded wheel are 27.0 and 23.5 mm3/min, respectively. The graphs for grinding wheels cannot be compared to the graphs of the other
on-time of 4 µs was not possible with the grinding wheels due to the presence of frequent wire
short circuit.
Figure 3.4: Material removal rate graphs for metal bond diamond grinding wheels
Diamond grinding wheel I
0 5 10 15 20 25 30
Material removal rate (mm^3/min)
18 14
10 6
Machine limit: wire short circuit Machine limit: wire breakage Regression model
Ton (µs)
Diamond grinding wheel II
0 5 10 15 20 25 30
0 10 20 30 40 50 60 70
Ton/T (%)
3.2.3. Sintered Nd-Fe-B Permanent Magnet
The sintered Nd-Fe-B permanent magnet has the lowest MRR, as can be predicted
from its material properties. Sintered Nd-Fe-B magnets have density of 7.5 g/cm3, specific heat of 420 J/kg-K, and melting temperature of 1620 K. As shown in Figure 3.5, the
maximum cutting speed possible on a 25.0 mm thick sample is 2.0 mm/min. As with the
grinding wheels, using spark on-time of 4 µs is not possible with this material. Energy
density delivered with this setting is not adequate to avoid wire short circuit.
Nd-Fe-B magnet
0.0 0.5 1.0 1.5 2.0 2.5
0 10 20 30 40 50 60 70
Ton/T (%)
Wire feed rate (mm/min)
18 14
10 6
Machine limit: wire short circuit Machine limit: wire breakage Regression model
Ton (µs)
3.2.4. Carbon-Carbon Bipolar Plate
Figure 3.6 shows the MRR graph for cutting the carbon-carbon bipolar plate. This
material is the easiest to cut by WEDM. The maximum cutting speed achieved during cutting of the carbon-carbon bipolar plate is 304.8 mm/min, the maximum cutting speed of
the Brother HS-5100 WEDM machine. This cutting speed is reached by all but one of the
spark on-time settings. This limit greatly affects the envelope of process parameters for the
carbon-carbon plate. If the WEDM machine did not possess a maximum cutting speed, the
shape of the envelope in Figure 3.6 would most likely resemble that of the other figures of
MRR. The machine limit of wire short circuit is replaced in this figure by the machine limit
of spark cycle, T. Regression modeling is not feasible due to the complexity of the data.
Letters in the graph again signify process parameters to be investigated by SEM in Chapter 4.
Carbon-carbon bipolar plate
0 50 100 150 200 250 300 350
0 10 20 30 40 50
Ton/T (%)
Wire feed rate (mm/min)
18 14
10 6
4 Machine limit: spark cycle (T)
Machine limit: wire breakage Machine limit: wire feed rate
Ton (µs)
Figure 3.6: Material removal rate graph for carbon-carbon bipolar plate
I
Cutting the carbon-carbon bipolar plate generates an entirely new set of machine
limits not encountered in WEDM of traditional materials. This is due to the fact that cutting
this material is much easier and faster than cutting an average workpiece material. As
mentioned earlier, the WEDM machine has a limit of 1000 µs for spark cycle, T. This is the
maximum T at which the machine will operate. During cutting the carbon-carbon bipolar
plate, the energy density never falls low enough to cause wire short circuit in the allowable T
range. On the MRR graph for the carbon-carbon bipolar plate, the machine limit for wire
short circuit is replaced by the on-time ratio associated with the maximum T. Another
limitation of the machine is the maximum cutting speed, 304.8 mm/min. This limit is easily
reached while cutting the carbon-carbon bipolar plate, which is represented by the solid line
in the graph on the top of the envelope of feasible process parameters.
3.2.5. Results of Regression Modeling
Table 3.1 shows the results of the regression modeling for every material analyzed.
The form of the equation is:
( )
cb on T T T a
MRR ⋅
⋅
= . The purpose of regression modeling is
to find a mathematical model relating MRR to spark cycle (T) and percentage on-time (Ton/T).
Significance of the parameter to the MRR increases with increasing size of the value of the
Type of machining Material a(x10-3) b c b/c b/c % difference Fe-Cr-Al foam 13.1 1.51 0.762 1.98
Porous metal
foam 316 stainless steel
foam 1.90 1.90 1.02 1.86
7.29
Carbon steel plate 2.11 1.97 0.718 2.74 Solid material
Nd-Fe-B magnet 1.10 1.38 0.565 2.44 11.6 Grinding wheel 1 0.984 1.56 1.10 1.42
Rotary
Grinding wheel 2 0.0910 1.92 1.30 1.48 3.46
parameter’s exponential variable.
In all types of machining b is larger than c, suggesting Ton/T is the more significant
parameter of the two. A ratio of the exponential variable for Ton/T to the exponential variable
for T has been included in Table 3.1 for each material. This ratio can be considered a
measure of the relative importance of the exponential variables. For porous metal foams,
solid materials, and rotary machining, the ratios are 1.99 and 1.85, 2.74 and 2.44, and 1.42
and 1.47, which give a percentage difference of 7.29, 11.6, and 3.46%, respectively. The
equation for percentage difference of two values consists of the difference of the values divided by their average. This trend of b/c ratio suggests that for a certain type of machining
application, this ratio, and this relationship between process parameters will fall within a
certain range.
3.2.6. General Results of Material Removal Rate Study
This study developed an envelope of feasible Ton and Ton/T process parameters to
characterize the WEDM process for new advanced engineering materials. A few trends were
observed during the study. Material removal rate depends on Ton and Ton/T in the following
respects. Higher Ton results in higher material removal rate. The material removal rate
increases with increasing Ton/T, until the wire breaks due to too much energy density. The
material removal rate decreases with decreasing Ton/T, until the wire touches the workpiece
and causes wire short circuit due to too little energy density. Regression modeling creates a
good relationship of material removal rate to the process parameters of T and Ton/T for the
3.3. Application of Cutting Thin Sections
The envelope of feasible process parameters for the carbon-carbon bipolar plate is
applied to select proper process parameters for cutting sections of this material of minimum
possible thickness. Amount of energy density applied by WEDM, determined by chosen process parameters at points I and J in Figure 3.6, has an effect on possible minimum
thickness of features. Tests were conducted on sintered Nd-Fe-B to investigate this effect.
The following sections present application and explanation of results of cutting thin sections.
3.3.1. Thin Section Cutting Application of Carbon-Carbon Bipolar Plate
An application of a feasible envelope of process parameters for a given material
regards cutting miniature features. Figure 3.7 shows thin sections of carbon-carbon bipolar
plate. The section on the left side of the figure is the cut section corresponding to maximum
energy density, point I on the MRR graph, and the cut section on the right side corresponds to
minimum energy density, point J on the MRR graph, with respective thickness dimensions of
2.75 and 1.25 mm. Point a on the graph represents spark on-time, Ton, of 18 µs and
percentage on-time, Ton/T %, of 30.0 %. Point b on the graph represents Ton of 4 µs and Ton/T
% of 0.40 %. Rougher surface characteristics of the section cut with maximum energy
Figure 3.7: Thin sections of carbon-carbon bipolar plate
Maximum material removal rate
density can be noticed in Figure 3.7. It is clearly noticeable that EDM process parameters
have an effect on minimum possible thickness.
3.3.2. Cutting Thin Sections of Sintered Nd-Fe-B Magnet
As noted above, EDM process parameters have a significant effect on possible
minimum thickness of a workpiece. One purpose of cutting thin sections of sintered
Nd-Fe-B magnet is to generate a model for this effect. EDM uses electrical sparks to generate
energy to melt and remove material. The very nature of the EDM voltage cycle, as illustrated
in Figure 2.1, suggests energy variation throughout the process. This energy variation, Ev,
which is based on the average energy, EA, required for cutting, is one factor that decides the
minimum thickness possible for a workpiece material. Figure 3.8 shows thin sections for
three spark on-time, Ton, settings, 2, 10, and 18
µs, left to right, respectively, with respective
Ton/T settings of 2.5, 8.3, and 12 %. The
variation of minimum thickness of thin
sections, due to variation of cutting energy
delivered, is used to approximate relative Ev
corresponding to EA.
The determination of EA is based on the equation for change in energy required to
melt workpiece material:
T C V T
C m
E = ⋅ p ⋅∆ =ρ⋅ ⋅ p ⋅∆ (3)
In this equation m, Cp, ?T, ?, and V are mass, specific heat, change in temperature, density,
and volume of removed material, respectively. The density and specific heat for sintered
Nd-Fe-B magnet material are 7.5x10⁻⁶ kg/mm3 and 420 J/kg-K, respectively. Volume of removed material can be defined by the dimensions of height of workpiece material, length
of cut, and width of wire plus gap of removed material on each side of the wire, which is 1.5
x 3.0 x 0.33 mm corresponding to a volume of 1.49 mm3. Change in temperature is the difference in room temperature and melting temperature. The melting temperature for
sintered Nd-Fe-B magnet material is 1620 K. With this information EA can be found:
cut f A l V E
E = ⋅ (4)
In this equation Vf refers to cutting speed and lcut refers to length of cut. Vf depends on EDM
process parameters, and is recorded during cutting. Finally, the Ev approximation relies on
the assumption that minimum thickness is directly related to Ev. The approximation begins
with a hypothesis of Ev2 based on EA:
2 2 10 10 18 18 thickness E thickness E thickness
EV V V
=
= (5)
The subscript in each term refers to the EDM spark on-time (18, 10, and 2 µs) that
characterizes the energy setting of the machine.
Table 3.2 summarizes the results obtained in this study. It includes wire cutting
Table 3.2: Results of model of cutting thin sections Spark on-time (µs) Vf (mm/min) EA (J/min) Thickness (mm) Ev (J/min)
18 7.62 15.7 1.1 0.825
10 3.81 7.88 0.75 0.563
2 0.229 0.473 0.2 0.150
Figure 3.9 shows a graphical illustration of power in units of J/min vs Ton in units of
µs. The figure includes data of EA and Ev from the table for each Ton setting.
Figure 3.9: Energy graph of EA and Ev for three Ton settings 0 2 4 6 8 10 12 14 16 18 E A (J/min) 0 0.1 0.2 0.3 0.4 0.5 0.6 0.7 0.8 0.9
0 2 4 6 8 10 12 14 16 18 20
E
v
(J/min)
Chapter 4. Scanning Electron Microscope (SEM) Investigation
Zworykin et al. described the first SEM used to examine the surface of a solid
specimen in 1942, working in the RCA Laboratories in the United States. The electron optics
of the instrument consisted of three electrostatic lenses with scan coils placed between the second and third lenses [Breton, 2001]. The electron gun was located at the bottom, so the
specimen chamber was at a comfortable height for the operator [Breton, 2001]. Since then,
the electron microscope has become an important tool for investigating microscopic features.
Unlike the optical microscope, which uses a beam of light that is reflected by the surface,
SEM uses a beam of electrons that are both absorbed and reflected by the surface. The advantage of SEM includes both a high level of magnification and a large depth of field. The
microscope used in this study is the Hitachi S-4700 Field Emission SEM, as shown in Figure
4.1.
One major goal of this study is to perform a qualitative analysis of effects of WEDM
process parameters on surface finish. It is thought that machining with increased spark
energy, Ton, causes rougher surface finish. To investigate this hypothesis, SEM is used to
examine samples of porous metal foams and thin sections of Nd-Fe-B magnet that were cut
at different WEDM settings.
The materials looked at by SEM are 1. porous metal foams, 2. carbon-carbon bipolar
plate, and 3. sintered Nd-Fe-B magnet. The following sections present the results of the
SEM analysis of these materials. In the final section is a review of Chapter 4.
4.1. SEM of WEDM Surface of Porous Metal Foams
Samples of two porous metal foam materials, 316 stainless steel and Fe-Cr-Al alloy,
were prepared for SEM study. The process parameters of these sections were determined
from the four corners of the envelope of process parameters for each material, marked as A,
B, C, D, E, F, G, and H in Figure 3.2. In each SEM figure of metal foam the top and bottom
picture have magnifications of 500X and 1500X, respectively.
SEM pictures of 316 stainless steel foam are shown in Figure 4.2 and Figure 4.4.
Parts (a), (b), (c), and (d) of Figure 4.4 correlate to surface finish due to process parameter
settings of the four corners of the material removal rate graph for 316 stainless steel foam.
Difference in surface finish due to different spark on-time settings, Ton, can be observed from
the graphs. Figure 4.4(a) and (b) correspond to Ton of 18 µs, and Figure 4.4(c) and (d)
correspond to Ton of 4 µs.
SEM pictures of Fe-Cr-Al foam are shown in Figure 4.3 and Figure 4.5. Parts (a),
the four corners of the material removal rate graph for Fe-Cr-Al foam. Difference in surface
finish due to varying Ton is not as evident for the Fe-Cr-Al foam as the 316 stainless steel
foam. Figure 4.5(a) and (b) correspond to Ton of 18 µs, and Figure 4.5(c) and (d) correspond
to Ton of 4 µs.
Close-up of K Close-up of L
(a) Ton = 18 µs, Ton/T = 32.0 % (Point A) (b) Ton = 18 µs, Ton/T = 5.3 % (Point B)
Close-up of M Close-up of N
(c) Ton = 4 µs, Ton/T = 26.7 % (Point C) (d) Ton = 4 µs, Ton/T = 5.0 % (Point D)
Figure 4.4: SEM micrograph of WEDM of 316 stainless steel foam
K
L
M
Close- up of O Close-up of P
(a) Ton = 18 µs, Ton/T = 36.0 % (Point E) (b) Ton = 18 µs, Ton/T = 5.1 % (Point F)
Close- up of Q Close-up of R
(c) Ton= 4 µs, Ton/T = 26.7 % (Point G) (d) Ton = 4 µs, Ton/T = 4.0 % (Point H)
Figure 4.5: SEM micrograph of WEDM of Fe-Cr-Al foam
R
P
O
4.2. SEM of WEDM Surface of Carbon-Carbon Bipolar Plate
SEM is used to investigate carbon-carbon bipolar plate material cut by the WEDM
machine. This is compared to SEM pictures of the carbon-carbon bipolar plate in its original
form. Slurry molded carbon fibers, about 0.4 mm long and 0.01 mm in diameter, which are sealed with chemically vapor-infiltrated carbon are also observed.
Figure 4.6 shows SEM pictures of the carbon-carbon bipolar plate. In Figure 4.6(a)
and (b) the magnifications from top to bottom are 200, 500, and 1300X. Figure 4.6(a) shows
standard carbon-carbon bipolar plate material. Not much can be learned from the first
magnification, but as magnification grows so does the detail of pictures. Shapes of carbon fibers become clear as magnification reaches 500X. Carbon fiber surrounded by infiltrated
sealing carbon can be seen well as magnification reaches 1300X. Figure 4.6(a) helps to
understand the microstructure and slurry-molding process associated with carbon-carbon
bipolar plates.
Figure 4.6(b) shows the carbon-carbon bipolar plate that has been machined by
WEDM. As can be seen from magnification of 200X, the surface of the machined
carbon-carbon bipolar plate is much rougher than that of standard material. Also, the carbon-carbon fibers
are not as apparent as in Figure 4.6(a). The WEDM machine has melted the carbon fibers
and sealing carbon, and recast them together on the surface. In the pictures of magnification
500 and 1300X half hidden shapes of carbon fibers do still seem to be apparent, but not near
Close-up of S Close-up of T
Close- up of U Close-up of V
(a) (b)
Figure 4.6: (a) Carbon-carbon bipolar plate (b) Carbon-carbon bipolar plate cut by EDM
V
T
S
4.3. SEM of WEDM Surface of Sintered Nd-Fe-B Magnet Thin Sections
Sections of Nd-Fe-B magnet material were cut to minimum thickness using three
different spark on-time, Ton, settings, 18, 10, and 2 µs, with 1.5 mm height and 3.0 mm
length. SEM is used to compare and contrast surface finish characteristics of these sections.
Figure 4.7(a), (b), and (c) shows surface finish of sintered Nd-Fe-B magnet for three
different spark on-time settings, Ton, 18, 10, and 2 µs, respectively. It should be noted Ton of
2 µs is a special low energy setting not typically used in WEDM. In the figure magnification
of pictures from top to bottom is 400, 700, and 1500X. Difference in surface finish between
Ton of 18 and 10 µs does not appear to be significant, but surface finish of Ton of 2 µs does
appear to differ from the other two Ton settings. In the pictures of the lowest Ton setting are
more flat regions in between bumps, and the recast layer does not build up as it does in the
other pictures. Also, in the picture of 1500X for the lowest Ton setting presence of
Close-up of W Close-up of X Close-up of Y
Close- up of Z Close- up of AA Close-up of BB
(a) (b) (c)
Figure 4.7: Sintered Nd-Fe-B magnet, (a) 18 µs (b) 10µs (c) 2 µs
BB
X
W
Y
Chapter 5. EDM Temperature Measurement Using Infrared
Spectrometry
Wire EDM relies on the heat generated from electrical sparks to melt and remove the
work-material. This process requires temperature above the melting temperature of the
workpiece. The goal of this study is to measure EDM temperature using infrared
spectrometry.
Research has been conducted on temperature of the plasma used in EDM. Temperature
was determined from measurements of relative intensities of the 411.85 and 413.29 nm Fe I
spectral lines. The measured plasma temperature range was from 8000 to 10000 K [Albinski
et al., 1996]. Other research has been conducted to measure the wire electrode temperature.
The measured wire temperature ranges up to 180oC depending on the cutting conditions [Takeshita, 1997].
Visible light emission of spark and arc can be observed during the EDM spark erosion.
This indicates the possibility to use light emission to measure the flash temperature in EDM
spark erosion. The electrode and workpiece during EDM are usually submerged in dielectric
fluid. Either the water- or oil-based dielectric fluid will block the light emission in the
infrared wavelength region. To overcome this problem, the cylindrical wire EDM process
[Qu et al., 2002a, 2002b; Rhoney et al., 2002] is used. A spindle drives the workpiece in
cylindrical wire EDM. The light emission can be captured by an infrared sensor and used to
measure temperature.
The following sections in Chapter 5 gives the experimental setup and presents the results
5.1. Setup of Spark Temperature Measurement
Three types of workpiece, 1. diamond grinding wheel, 2. copper, and 3. WC-Co, are
used in the EDM temperature measurement.
5.1.1. Workpiece Preparation
The preparation of the workpiece is similar to that of the diamond grinding wheel
during the material removal rate study. The wheel and hub assembly is mounted to the
spindle, which is mounted to the worktable inside the EDM machine, which serves as an
electrical ground. The copper and tungsten carbide materials are mounted to the worktable in
a different spindle than the diamond grinding wheel. In order to determine the beginning
position of the cut, an edge find process was executed. The wire moves toward the
workpiece slowly until it is barely touching the workpiece. The wire is then moved a
predetermined distance from the workpiece to allow for automatic wire rethreading in the event of wire breakage. During cylindrical wire EDM machining the workpiece does not
need to be submerged, only a jet of dielectric fluid is required for flushing. The reason is the
wire is only removing material on the surface, and the wire is not embedded within the
workpiece material.
However, one major difference is needed for temperature measurements. As mentioned earlier, the dielectric fluid blocks the light emission in the infrared wavelength
region. Therefore, the flushing jets must be closed to allow as much light as possible to flow
from the EDM process. This is required in order for the spectrometer to receive the signal.
wire breakage. So the feed rate must be reduced to allow smooth wire EDM operation
without wire breakage.
5.1.2. Temperature Measurement Procedure
The spectrometer used was an Ocean Optics USB2000 near-infrared spectrometer.
Its wavelength range includes 0.717 to 0.980 µm. This spectrometer uses charge-coupled
discharge (CCD) arrays to allow acquisition of an entire spectrum over one sampling time. It
is also easily incorporated with Ocean Optic’s spectrometer operating data acquisition
software, as Figure 5.1(a) shows. Light is collected by an optical fiber and transmitted to the
spectrometer for the measurement. The actual signal acquisition, including the grinding
wheel, optical fiber, and spark are shown in Figure 5.1(b). The spark is continuous, so the
measurement time window is unlimited. A close-up view of the wire, grinding wheel, and
optical fiber tip are shown in Figure 5.1(c).
Before temperature measurements are taken, the spectrometer must be calibrated to a
known temperature source. Calibration sets each pixel in the spectrometer’s CCD array to
the appropriate gain [Curry et al., 2003]. This ensures relative irradiance of wavelength, and
therefore, blackbody curves and temperatures are correct. The known temperature source
used was an Ocean Optics LS-1 tungsten halogen lamp at 3100 K. Temperature
spectrometer
optical fiber grinding wheel on spindle
data acquisition system
(a) (b)
(c)
Figure 5.1: (a) Setup (b) Signal acquisition (c) Close-up view
5.2. Data Analysis and Results
Multiple wavelength techniques use relative intensities of different wavelengths to
determine a graybody curve and source temperature. For the method of this study the
determination is based on matching the scaled spectrometer output, R(λ), to blackbody
curves, EB(λ,T), over the wavelength range measured by the spectrometer [Curry et al.,
The equation used for the data analysis method is derived from the blackbody radiation equation, − = 1 ) , ( 2 5 1 T C B e C T E λ λ λ (1)
C1 = 8πhc = 4.992 x 10⁻²⁴ Nm2 and C2 = hc/k = 14390 µmK where h, k, and c are Planck’s
constant, Boltzmann’s constant and the velocity of light, respectively. For radiation at
temperature T from a source of emissivity ε passing through a material with transmissivity τ into a spectrometer with an aperture constant α, the spectrometer output function R(λ) is
the graybody spectrum
( )
− = 1 2 5 1 T C e C R λ λ αετ λ (2)Assuming that the constants ε, τ, and α are independent of wavelength over the measurement
range, a scaled spectrometer output function based on Eq. (2) is written as
( )
( )
− = = 1 1 , 2 5 T C e T E SR λ λ λ λ (3)S is the adjustable scaling factor accounting for the unknown constants. For source
temperatures less than about 3000 K and wavelengths less than 1 µm, the following
( )
( )
5 5 2 2 2 1 , λ λ λ λ λ λ λ T C T C T C e e e T E SR − − − ≅ − = = (4)Taking natural logarithm of both sides of Eq. (4) and rearranging gives:
( )
ST C
R ln
1 1
ln 5 = 2 +
λ λ λ (5)
Data analysis in this study is based on equation (5). For a given spectrometer measurement,
a plot of ln(1/λ5R) vs. 1/ λ should be a straight line. Using a linear fit over the wavelength measurement range dictated by the spectrometer, 0.72 µm ≤ λ ≤ 0.92 µm, the temperature T
and scale factor S can be obtained from the slope and intercept, respectively.
Figures 5.2-4 show the near infrared spectrometer data taken for wire EDM
temperature measurement of copper, WC-Co, and diamond grinding wheel, respectively.
The top graph in each figure is the spectrometer output function, R(λ) over the wavelength
range. The bottom graph in each figure shows the data according to equation (5) with the
linear fit. The Y-axis in each bottom graph is ln(1/λ5R), and the X-axis is 1/ λ in units of 1/µm. Three temperature measurements were taken for each material. However, the
appearance of all temperature measurement graphs is similar to the representative graphs in
the figures.
The diamond grinding wheel used in this study is the Inland bronze bonded wheel.
The average of the three temperature measurements taken for this workpiece is 2280 K. All
of the temperature measurements produced specific spikes at common wavelengths.
more pronounced. These spikes are due to effects other than thermal, and in the case of the
grinding wheel temperature measurements they may significantly affect the method of
calculation for temperature.
Table 5.1 shows a summary of the temperature measurement data taken, including
average temperature and standard deviation for each material. It shows the average
temperature of the measurements for WC-Co is greatest. This makes sense due to the
melting temperatures of 1350, 1870, and 3070 K for copper, cobalt, and tungsten carbide,
respectively. An interesting point is that the melting temperature for tungsten carbide is higher than temperatures seen in this investigation. It should be noted that during cutting a
chemical reaction of oxidation takes place, which increases the overall temperature of the
process.
No major trends for the effect of process parameters on temperature can be identified.
The average temperatures of the three materials do not deviate significantly, which cannot be explained. Further research in this area is needed. If the spark temperatures are higher than
those assumed for the approximation given in Eq. (4), the method based on Eq. (5) might not
be valid. However, the same general method for temperature analysis may be used.
Table 5.1: Temperature measurement data in units of K
Material
measurement 1
measurement 2
measurement
3 avg temp
standard deviation
Diamond grinding
wheel 2220 2190 2420 2280 143
WC-Co 2320 2300 2250 2290 38.1
0.0 0.2 0.4 0.6 0.8 1.0 1.2 1.4 1.6
700 750 800 850 900 950 1000
Wavelength (nm)
Relative Irradiance
y = 6.1934x - 5.5824
0.5 1.0 1.5 2.0 2.5 3.0 3.5
1 1.05 1.1 1.15 1.2 1.25 1.3 1.35 1.4 1.45 T=2320 K
1/λ (1/µm)
l n ( 1 /λ5R )
0.0 0.5 1.0 1.5 2.0 2.5 3.0
700 750 800 850 900 950 1000
Wavelength (nm)
Relative Irradiance
y = 6.4309x - 5.9466
0.5 1.0 1.5 2.0 2.5 3.0 3.5
1 1.05 1.1 1.15 1.2 1.25 1.3 1.35 1.4 1.45
1/λ (1/µm)
l n ( 1 /λ5R )
T=2240 K
Figure 5.2: Copper temperature measurement 1
Figure 5.3:WC-Co temperature measurement 1
Spectrum used for temperature calculation
0 0.1 0.2 0.3 0.4 0.5 0.6 0.7
700 750 800 850 900 950 1000
Wavelength (nm)
Relative Irradiance
y = 5.9541x - 4.4505
1.0 1.5 2.0 2.5 3.0 3.5 4.0
1 1.05 1.1 1.15 1.2 1.25 1.3 1.35 1.4 1.45
l n ( 1 /λ5R )
1/λ (1/µm)
T=2420 K
Figure 5.4 Diamond grinding wheel temperature measurement 3
![Fig. 2.1: Evolution of a single spark in the EDM process [Rajurkar, 2001].](https://thumb-us.123doks.com/thumbv2/123dok_us/1779613.1230112/13.612.96.527.147.523/fig-evolution-single-spark-edm-process-rajurkar.webp)