Copyright 0 1986 by the Genetics Society of America
WHAT CAN BE LEARNT ABOUT SELECTION FROM
GENE FREQUENCY DISTRIBUTION?
G. S. MANI,+ L. M. COOKt AND R. MARVDASHTIT
*
Department of Physics and Department of Environmental Biology,University of Manchester, Manchester M I 3 9PL, England
Manuscript received June 12, 1984
Revised copy accepted August 5, 1986
ABSTRACT
Polymorphism has been studied at the Esterase 6 locus in the Yellow Fever mosquito Aedes aegypti (L.) in laboratory stocks. At least 12 alleles are present, with up to four coexisting in a stock. The allele frequency distribution is quite sharply peaked at a mode of about 0.25. The experimental data are compared with the results of simulation based on two models, one in which the initial global distribution is taken to be the stationary distribution obtained from the neutral model assuming M = 4~ N , = 1 and the other in which the initial global distribution is generated from the experimental populations studied. The results suggest that the patterns observed are not likely to arise through random fluc- tuation of frequencies in neutral alleles, but that some kind of selection maintains polymorphism, either in the wild or in the laboratory, or both.
WO general approaches may be made to the problem of genetic diversity
T
in populations. One is to study a particular system in order to investigate the relative importance of all possible causative agents. The other is to attempt to draw conclusions from a wide variety of organisms. There is a tendency for the conclusions to be correlated with the approach. Intensive investigations usually produce evidence of selection, while surveys of allele frequencies often produce data consistent with the null hypothesis. To some extent this is a consequence of the methodology. We are almost bound to find some evidence of selection under some circumstances if we look hard enough, but it is not necessarily involved in maintaining diversity. On the other hand, statistical considerations concerned with sampling may result in distributions indistin- guishable from random ones even when there is underlying selection (MANI1984).
It is therefore interesting to look for cases that yield results at variance with the null hypothesis. In this paper we report on a general survey of allele frequencies in a number of populations which yield a distribution that is dif- ficult to reconcile with the null hypothesis of neutrality. Although the sample sizes are small and no field data are available, we feel that these results are worth reporting because discussion of them with genetical colleagues has re-
972 G . S. MANI, L. M. COOK AND R. MARVDASHTI
sulted in a flat disbelief that anything may be inferred about selection from such samples.
Stocks of the Yellow Fever mosquito Aedes aegypti are maintained in Man- chester by R. J. WOOD. T h e genetics of esterases has been studied in this species, partly because esterases are involved in some forms of insecticide re- sistance (ZIV and BROWN 1969; GEORGIOU and PASTEUR 1978) and partly as indicators of genetic variation in populations in the field (SAUL, GUPTAVANIJ
and CRAIG 1976; TABACHNICK and POWELL 1978, 1979; POWELL, TABACHNICK
and ARNOLD 1979; POWELL, TABACHNICK and WALLIS 1982).
Twenty-seven stocks were available, coming from all parts of the tropics and maintained in the laboratory for around 20 generations. They provided an opportunity to survey the range of variability shown in an enzyme, using material from a variety of geographical origins.
MATERIALS AND METHODS
Of the 27 populations surveyed, 24 are from known localities in different parts of the world and three are marker stocks of mixed ancestry. The provenance of the lines is shown in Table 1. Samples from each were reared to adults and mass mated, and their progeny were raised to fourth-instar larval or pupal stage. Individuals were then scored for esterase banding, using vertical slab polyacrylamide gel electrophoresis.
RESULTS
Examination of the banding patterns indicated that six loci were detectable, using CY and @-naphthyl acetate as substrates. These are referred to as Est-1 to
Est-6 in increasing order of mobility. Of these, Est-1 and Est-3 proved too difficult to resolve for study. With the exception of one case of polymorphism for two alleles in Est-2, that locus and E s t 4 were both invariant within popu- lations, but differences between populations occurred. Tests, using progeny of crosses between populations with unlike alleles, showed that E s t 4 is on chro- mosome I (sex-linked). It was calculated to be 33 map units from the sex- determining region on the opposite side from the marker red eye (re) (MUN- STERMANN and CRAIG 1979; MARVDASHTI 1985). T h e location of Est-2 is un- known.
T h e two other loci, Est-5 and Est-6, exhibited polymorphism within popu- lations. There is some overlapping of bands between these loci. Est-5 showed low activity and was scored in fourth instar larvae, where it was most distinct, whereas the others were examined in pupae. SAUL, GUPTAVANIJ and CRAIG (1976) comment on this scoring difficulty. We have no information on its linkage group. Twelve small samples were scored, of which five were mono- morphic and seven had two alleles present. Est-6 is on chromosome
ZZ.
In linkage tests it was located 32 map units from yellow-larvab),
on the opposite side of y from spot-abdomen (s). It is therefore the same locus as that studied by SAUL, GUPTAVANIJ and CRAIG (1976) and MUNSTERMANN and CRAIG (1979), which they placed 32 and 47 map units from y, respectively.SELECTION AND GENE FREQUENCY 973
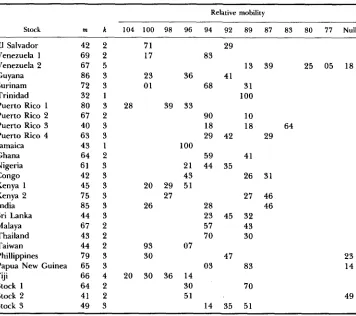
TABLE 1
Frequency (X100) of alleles of different relative mobilities at the Est-6 locus in laboratory populations of A. aegypti
Relative mobility
Stock m k 104 100 98 96 94 92 89 87 83 80 77 Null
El Salvador Venezuela 1 Venezuela 2 Guyana Surinam Trinidad Puerto Rico 1 Puerto Rico 2 Puerto Rico 3 Puerto Rico 4 Jamaica
Ghana Nigeria Congo Kenya 1 Kenya 2 India Sri Lanka Malaya Thailand Taiwan Phillippines Papua New Guinea Fiji
Stock 1 Stock 2 Stock 3
42 2 69 2 67 5 86 3 72 3 32 1 80 3 67 2 40 3 63 3 43 1 64 2 61 3 42 3 45 3 75 3 85 3 44 3 67 2 43 2 44 2 79 3 65 3 66 4 64 2 41 2 49 3
71 29
17 83
23 36 41
01 68
28 39 33
100
21 43 20 29 51
27 26
93 07
30
20 30 36 14 30 51
90 18 29 42
59 44 35
28 23 45 57 70
47 03
14 35 13 31 100 10 18 41 26 27 32 43 30 83 70 51
25 05 18 39 64 29 31 46 46 23 14 49
m, sample size; k, number of alleles.
(1 976) reported 14 alleles. In the present work the alleles were not compared in all possible pairs to test their distinctness. In Table 1 a cautious classification is given, in that several bands of similar mobilities, present in different popu- lations, have been grouped. This reduces the list to 12 alleles, including the null allele. The grouping does not affect the frequencies or the number of alleles in any single population. The average number of alleles per population is 2.6, with two monomorphic populations and one with as many as five alleles.
DISCUSSION
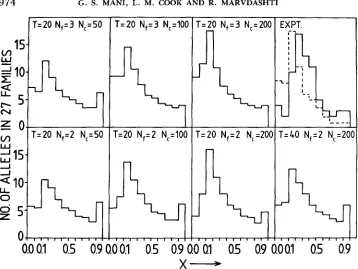
The question at issue is why these levels of variation should exist in the laboratory stocks. The allele frequencies of all the 27 populations have been pooled to yield an ensemble distribution. The result is shown in Figure 1. The distribution peaks in the neighborhood of 0.25 and has a mean of 0.36. The mean number of alleles over the
27
populations listed in Table 1 is 2.63 f974 G . S. MANI, L. M. COOK AND R. MARVDASHTI
(T.20 Nf=3 N,=50
I
T=20 N,=3 N,=100r=zo
~ , = 3 N,=ZOO4
r=zo
N,=Z N,=ZOOEXPT.
r=40 N,=Z N,=ZOC
0.0
01 0.5
0.9
000.1
0.5
0.9
0.0
01 0.5
0.9
0.001 0.5
0.9
X-
FIGURE 1.-Allele frequency distribution for model I with M = 1 for various values of founder population Nfi cage population N , and generation T. The experimental results are shown in the top, far right graph as full lines. The dotted line in this graph shows the result obtained by SAUL, GUPTAVANIJ and CRAIG (1976).
very closely corresponds to l/n, where n is the mean number of alleles. T h e laboratory stocks are probably from small initial samples of five to ten individ- uals collected from the field and reared in the laboratory for around 20 gen- erations, with a laboratory population size of 50-200.
T h e data considered are a small set, concerning a single locus. T h e results are a second sampling of the Est-6 locus previously examined by SAUL, GUP- TAVANIJ and CRAIG (1976). T h e resulting pattern is very similar to theirs (Figure 1). Questions about distributions are usually examined using data from many loci sampled at the same time in a population, rather than from sets of samples in the same locus. T h e theory examined, however, relates to the probability distribution through time for a single locus (KIMURA 1983), and the assumption is made that multilocus sampling produces a picture of this distribution, because the loci are independent but subject to perturbations of the same size governed by the effective population size Ne and the mutation rate. We argue below that, because of the degree of independence of the populations examined, it may also be legitimate to draw conclusions from sets of samples of a single locus.
SELECTION AND GENE FREQUENCY 975
number of generations. In both models we assume that the global A. aegypti population is panmictic and has reached stationary distribution. According to TABACHNICK and POWELL (1 979), the genetic distance between Asian and New World populations is about 0.025, which is of the same order of magnitude as that between the Negroid and the Mongoloid populations of man (NEI and ROYCHOUDRY 1982). Then, one could assume that the populations of A. aegypti probably diverged abut 100,000 years ago (M. NEI, personal communication). If the mutation rate
per
locus, per year is of the order of then these populations could not have had sufficient time to deviate significantly from the original population with regard to allele frequency distribution.In model I we assume that the allele frequency distribution in the global population of A. aegypti could be described through the stationary distribution predicted by the neutral model; namely,
where @(x)dx gives the number of alleles having frequencies between x and x
+
dx. Since the data on the 27 populations yield an average value of 0.48 for heterozygosity, we have chosen M = 4N, P = 1 in the above equation, where Ne is the effective population size and I.L is the mutation rate per generation. For a mutation rate this would yield an effective population size of 2.5x lo6, which is not unreasonable (MANI 1984, p. 244). Consider this popula- tion to be divided into 27 subdivisions, each with a population size of -lo5. From each subdivided population, Nf individuals (2-1 0) are randomly chosen to act as founder populations for laboratory cages. The cage populations N, are taken to be between 50 and 200 individuals. The number of alleles in the global population with M = 1 is given by
@(x)dx = M( 1
-
x ) ~ - ~ x - ' , (1)1
n e =
J
9 ( x ) d x = ln(2Ne). (2)1 /2N,
Thus, for Ne
-
2.5 X lo6, ne-
15.In the model we first choose independently the frequencies of 15 alleles in each of the 27 subdivided populations using the following algorithm. Let R, be a random number chosen from a uniform distribution E [ O , 11. Let this represent the nth choice of alleles, n 5 14, and let the frequencies of the
(n
-
1) alleles already chosen be given by xj,i
= 1 , 2,-
e , (n-
1). Then,R, = @ ( x ) d x / [ - ' @(x)dx, (3)
where = 1
-
nth allele is given bywith x,, = 0, and E,, = 1/2Ne. The frequency x, of the
x, = e,, exp[-R, In(%,-l/~o)]
for @(x) = 1/x. Finally,
14 X I 5 = 1
-
xi.i= 1
(4)
(5)
This procedure ensures the independent choice of 15 alleles with the constraint 15
r,
x; = 1 .976 G . S. MANI, L. M. COOK AND R. MARVDASHTI
T h e alleles thus chosen for 27 populations and for 100 replicates were checked to yield the l/x distribution assumed.
A few calculations were done for integral M
>
1, using the following pro- cedure.T h e interval E , to 1 is divided into K equal parts, such that
6t = (1
-
t,)/Kc, = m6t
+
eo m = 0, 1 , 2, . . a , K .T h e distribution function P, and the cumulative distribution C, are defined by
m = 1 , 2,
-..,
Kc,
=c,-,
4- P,;c,
= 0 (8) where("p
')
represents the binomial coefficient. Assume (n-
1) alleles have already been chosen to have frequencies xi,i
= 1 , 2,.
.
e , ( n-
1). Let R,be a random number chosen from a uniform distribution t [ O , 11. Then the
frequency of the nth allele is given by
x n = (cp
+
+1)/2, (9)where
p
is given by the inequalitycp-,
<
R ,<
cp
c p = c&p"-l. In ( 1 l ) , p , - l is given by{
1-
;z;
.*I
-
€0p,-,
= Integral part of (12)B E
and
p
in (9), (10) and (1 1 ) c[l,p,-l].
In our calculations, the number of divisions K for the interval [ E , , 11 was 5000. Because of the discrete division of the interval [ E , , 11, round-off errors could accumulate to make xi greater than unity. T h e probability of this occurring was extremely small (<lo-*), and the few cases when this happened were discarded. We have checked that the distribution for the 27 populations and for 100 replicates closely follows the assumed distribution given by (1).SELECTION AND GENE FREQUENCY 977
T=20 N,=3 Nc=50 T=20 Nf=3 Nc=lOO
0
0.0
0.5
1.0
0.0
0.5
1.0
(T=20 Nf=3 Nc=200 EXPT.
I
T=20 Nf=2 N,=200 T=40 N+=2 N,=200
L
0
0.5
1.0
0.0
0.5
1.0
H-
FIGURE 2.-Heterozygosity distribution for model I with M = 1 for various values of founder population N,, cage population N , and generation T. The experimental results are shown in the top, far right graph.
relation between genotype and gene frequencies. T h e alleles thus obtained formed the founder population for the laboratory cages. In generation 1, the
27
laboratory populations were all assumed to have the same population sizeN,, where N , was varied between 50 and 200. T h e subsequent evolution of gene frequency in the laboratory cages is carried out using a Monte Carlo method, rather than the diffusion approximation.
To reduce any long range correlations in the random numbers generated, the following reshuffling method was used. Before starting the simulation, 1000 random numbers Rc
i
= 1, 1000, from a uniform distribution E [ O , 11 were stored in the computer. When a random number was required in the simulation, an integer number N E [ I , l O O O ] was randomly chosen, and the required random number was given by RN. T h e random number RN was then replaced by another random number chosen from a uniform distribution978 G. S. MANI, L. M. COOK AND R. MARVDASHTI TABLE 2
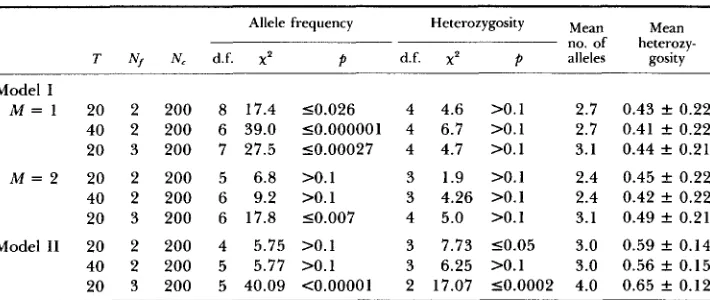
x4 test for various theoretical models and the experimental data
Mean
T N, N, d.f. X' P d.f. x2 p alleles gosity
Allele frequency Heterozygosity M~~~
no. of heterozy-
Model I
M = 1 20 2 200 8 17.4 50.026 4 4.6 >0.1 2.7 0.43 f 0.22 40 2 200 6 39.0 50.000001 4 6.7 >0.1 2.7 0.41 f 0.22 20 3 200 7 27.5 50.00027 4 4.7 >0.1 3.1 0.44 f 0.21
M = 2 20 2 200 5 6.8 >0.1 3 1.9 >0.1 2.4 0.45 k 0.22 40 2 200 6 9.2 >0.1 3 4.26 >0.1 2.4 0.42 f 0.22 20 3 200 6 17.8 50.007 4 5.0 >O.l 3.1 0.49 f 0.21 Model I1 20 2 200 4 5.75 >0.1 3 7.73 50.05 3.0 0.59 f 0.14 40 2 200 5 5.77 >0.1 3 6.25 >0.1 3.0 0.56 f 0.15 20 3 200 5 40.09 <0.00001 2 17.07 50.0002 4.0 0.65 f 0.12
does not reproduce the experimental data under any situation. T h e simulations were done for 100 replicates, and it was observed that the distributions did not materially alter between individual replicates when averaged over the 27 populations.
M. NEI (private communication) has objected that we cannot sample from the expected distribution @(x) since our global population represents one sam- ple path in the stochastic process involved. Our method of constructing the subdivided populations does introduce fluctuations around the expected distri- bution, although the method we have chosen may not necessarily yield the exact distribution of fluctuations. We feel, however, that it should at least reproduce the main features of the experiment.
NEI has suggested that one way of testing whether selection occurs in the laboratory cages is to estimate the present global frequencies by averaging the allele frequencies of the 27 cage populations. T h e rationale behind this is that, under the null hypothesis of neutral alleles, the expectation of allele frequen- cies is independent of population size. Therefore, in the case of a large number of populations, the allele frequency of the original population can be estimated. From this estimated global frequency, the founder population
Nf
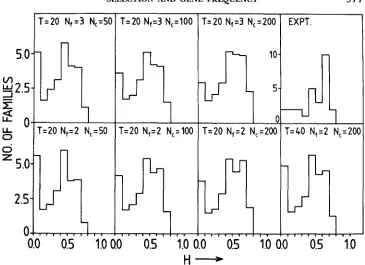
for each of the 27 cages can be independently sampled. T h e subsequent evolution of the cage populations can then be followed using the method described earlier.T h e allele frequency distributions and the distributions of heterozygosity arising from this model (Model 11) are shown in Figures 3 and 4, respectively. T h e
x 2
values for some cases are given in Table 2. T h e global frequency distribution for the 12 alleles observed in the experimental data is also shown in Figure 3.SELECTION AND GENE FREQUENCY 979
30
20
!
10
i
v,
w
2
0
LL
30
20
10
0
c
0
z
Global Allele
Distribution x 6
T=20 Nf=2 N,=50
T=40 Nf=2 N,=100
~ r=40 N,=Z N,=ZO(I
-_
r=zo
N,=Z N,=ZOCT=20
N,=200
Nf=4
T=20
N, k 200
- I , , , , , . , , , , , , , , , , , , , , ,
101
-..
0 5
i n n i
nqi n n i
nc;
i n n i nc;
i n
" . 4 I.V v.. V . d 8 . V v., u.a 1.u u.1 W . d I .U
X-
FIGURE S.-Allele frequency distribution for model I1 for various values of founder population
N,, cage population N , and generation T. The present global frequency distribution used in model
11 is shown in the top, far left graph. The dotted and dashed lines in some of the graphs show the effects of contamination. The dashed lines are for the case when, in each generation, a pair of randomly chosen cages exchange one individual; the dotted lines are for the case when, in each generation, five pairs of randomly chosen cages exchange one individual per pair.
for Nf = 3, N , = 200 and T = 20-40 generations. T h e mean number of alleles and the mean value of heterozygosity (Table 2) are slightly higher than the observed values, but they are well within the standard deviations.
In model 11, although we have used samplings from 27 different populations to estimate the global frequency distribution, the actual number of individuals sampled is still small. If we assume Nf =
2,
then this number is 54. T h e heterozygosity H of the global distribution used in the calculations is around 0.85, and using the relation H = M / ( M+
1) given by the neutral model, w e get a value of 6 for M. The number of alleles in a large population(25
Xlo6) for M = 6 is around 79. If one samples only 54 individuals in the popu- lation, the number of alleles of very low frequencies that would be missed in the sampling is around 69. Thus, the sampling should exhibit about ten alleles, which is reasonably close to the value of 12 given by our data. In view of this, we have repeated the calculations for an initial global gene frequency distri- bution given by
@(x) = 6( 1
-
x ) ~ x - ' ,980
U
-G . S . MANI, L. M. COOK AND R. MARVDASHTI
r=20 Nf=2 N,=200
A
N, 200
I
d
1
0.5
1.0
H
FIGURE 4.-Heterozygosity distribution for model I1 for various values of N, and T with N , =
200.
populations sampled would have undergone some differentiation since the time of divergence, and this could modify the experimental results in comparison with model 11. As argued earlier, we feel that the amount of divergence that results cannot be large enough to alter the conclusion that agreement is only good if Nf = 2, N , = 200 and T = 20-40 generations.
It could be argued that contamination in the laboratory between cages could drastically alter the frequency distribution observed in the cage populations. We have computed the effect of small contaminations as follows. We assume that, in each generation, n pairs of cages, randomly chosen, exchange randomly one individual between them. We have used a value of 1 and 5 for n, the results after 20 and 40 generations are shown in Figure 3 as dashed and dotted lines, respectively. T h e effect of such small accidental contaminations is to increase the very low frequencies. T h e high frequency end is unaltered. Thus, if such small contaminations were present in our observed distributions, the actual frequency spectrum would be even narrower, with depletion in the low frequency end. This, in turn, would imply that the global frequency from which the samplings were taken have to be narrower than the distribution assumed in model 11.
SELECTION AND GENE FREQUENCY 98 1
for 20-40 generations. The results of SAUL, GUPTAVANIJ and CRAIG (1976)
lead to similar conclusions, provided Nf = 3.
Thus, on the basis of the neutral model, only two individuals in the founder population could have contributed to the eventual cage population in almost all of the
27
samples studied, a situation that in our case is most unlikely.The neutralists (KIMURA 1983; NEI 1984) accept that evolution is dependent on selective processes, but argue that selected loci are, by and large, mono- morphic. Most mutations are neutral at some time, however, because many alleles have equivalent effects, although they may be selected at other times. At any given period, therefore, we see a fraction of loci that are polymorphic for neutral alleles. At the enzyme level, the null hypothesis is tested by consid- ering a large number of loci and a large number of species. Our contention here is simply that, when considered locus by locus, distributions such as those discussed do, in fact, favor the action of selection maintaining polymorphism, rather than neutrality. This possibility is testable when one locus is considered at a time. When samples for many loci are pooled, there is a danger that the evidence for selection may be obscured.
The question of what type of selective mechanism operates on the esterase locus cannot be answered at this stage. We have some evidence that, in these insects, esterase monomorphism is associated with asymmetry. A study is now in progress to examine the relationship and, in particular, the possibility that single-locus or multi-loci heterozygosity contributes to developmental hotneo- stasis. Selection for symmetry is likely to operate both in the field and in the laboratory, and could have a substantial effect; therefore, it seems a good candidate for investigation.
R. J. WOOD kindly supplied mosquito stocks and much information relating to them. We thank G. S. PROUDLOVE for help with rearing techniques and details of stocks. We are especially grateful to M. NEI for his detailed comments and suggestions regarding the interpretation of the data.
LITERATURE CITED
BIEMENT C., 1983
GEORGHIOU, G. P. and N. PASTEUR, 1978
Homeostasis, enzyme heterozygosity and inbreeding depression in natural
Electrophoretic esterase patterns in insecticide-resistant
The neutral theory of molecular evolution. Cambridge University Press, Cam-
A Darwinian theory of enzyme polymorphism. pp. 214-241. In: Evolutionary
Location of estrase loci in Aedes aegypti. J. Am. Mosq. Control Assoc. 1:
Genetics of Aedes aegypti: updating the linkage
Genetic polymorphism and neomutationism. pp. 2 14-241. In: Evolutionary dy-
Genetic relationship and evolution of human races. Evol. populations of Drosophila melanagaster. Genetica 61: 179-1 89.
and susceptible mosquitoes. J. Econ. Ent. 71: 201-205.
bridge.
dynamics of genetic diversity, Edited by G. S. MANI. Springer-Verlag, Berlin.
423-434.
KIMURA, M., 1983
MANI, G. S., 1984
MARVDASHTI, R., 1985
MUNSTERMANN, L. E. and G. B. CRAIG, 1979
map. J. Heredity 7 0 291-296.
namics of genetic diversity, Edited by G. S. MANI. Springer-Verlag, Berlin. NEI, M., 1984
NEI, M. and A. K. ROYCHOUDRY, 1982
982
POWELL, J. R., W. J. TABACHNICK and J. ARNOLD, 1979 Genetics and the origin of a vector population: Aedes aegypti, a case study. Science 208: 1385-1387.
POWELL, J. R., W. J. TABACHNICK and G. P. WALLIS, 1982 Aedes aegyptz as a model of the usefulness of population genetics of vectors. In: Recent developments in the genetics of insect disease vectors. pp. 396-432. W. W. M. STEINER, W. J. TABACHNICK, K. S. RAI and S.
NARANG. Stipes Publishing, Champaign, Illinois.
Genetic variability at an esterase locus in
Aedes aegypti. Ann. Entomol. Soc. America 6 9 73-79.
Genetic structure of the East African domestic populations of Aedes aegypti. Nature 272: 535-537.
yellow fever mosquito, Aedes aegypti. Genet. Res. 3 4 215-229.
Aedes aegypti. Mosq. News 29: 456-461.
G. S. MANI, L. M. COOK AND R. MARVDASHTI
SAUL, S. H., P. GUPTAVANIJ and G. B. CRAIG, 1976
TABACHNICK, W. J. and J. R. POWELL, 1978
TABACHNICK, W . J. and J. R. POWELL, 1979
ZIV, M. and A. W. A. BROWN, 1969
A world-wide survey of genetic variation in the
Esterase activity in organophosphorus-tolerant strains of