WORK ENGAGEMENT AMONG MILLENNIALS
Rajiv Shah
Research scholar (Ph.D.), Department of HRD, Veer Narmad South Gujarat University, Surat, Gujarat, INDIA.
Currently working as Manager-HR at Reliance Industries Limited, Surat.
ABSTRACT
This paper attempts to provide a firsthand understanding about work engagement level among
Millennials, also known as Generation Y, currently working in Indian workforce mainly in
Non-IT sectors using descriptive research design. Primary data is collected from 397 respondents
using Utretch Work Engagement Scale (UWES). After ensuring the reliability of data, descriptive
statistics is used to analyze the data and chi-square test is used to identify the association
between variables. The result of the study reported that Millennials score higher on Dedication
and lower on Vigor subscales of UWES. Downward trend in work engagement is also observed
for sub-generations. They feel enthusiastic about their job, feel proud about the work they do,
feel happy when they work intensely, can be easily detached from the job, don’t get carried away
by the job and they feel less energy at work. The study provides useful insights to HR
Professionals, Line Managers / Management for aligning their work related processes and
policies for attracting and retaining Millennial generation.
Keywords : Millennial, Generation Y, UWES, Work Engagement, Employee Engagement International Research Journal of Human Resources and Social Sciences ISSN(O): (2349-4085) ISSN(P): (2394-4218) Impact Factor- 5.414, Volume 4, Issue 8, August 2017
Website- www.aarf.asia, Email : [email protected] , [email protected]
1. Introduction
The Millennial generation, also known as Generation Y (born between 1981and1995), is
occupying today around 47% of the workforce in India1. This generation is not only emerging as
a big cohort of the workforce but also as a generation different from the earlier generations called
Generation X (born between 1965 and 1980) and Baby boomers (born between 1944 and 1964).
Millennial generation requires our attention not only because of their numbers is increasing at
workplace but also because they are different from other generations. Attraction and retention of
best of the millennials is critical for any business to sustain and grow in future. Numerous studies
have identified theircharacteristics which make them different from other generations but hardly
any empirical research is available which provides their work engagement level. Employee
engagement ranked sixth in the list of twenty three priorities for CHROs and improving it
remains one of their most critical issues as per a report published by Corporate Executive Board.
The importance of engagement has further increased because 46% variation in employee
performance can be explained by engagement (The Corporate Executive Board Company, 2011).
On the other hand, employee engagement levels dropped by two points (from 65% to 63%)
globally(Aon Hewitt, 2017). This clearly indicates that there is a need for understanding the
work engagement level among Millennials.Work engagement is a positive, fulfilling,
work-related state of mind that is characterized by vigor,dedication, and absorption. Rather than a
momentary and specific state, engagement refers toa more persistent and pervasive
affective-cognitive state that is not focused on any particularobject, event, individual, or
behavior(Schaufeli & Bakker, 2004).
2. Review of Literature
A study (Cogin, 2012)reports existence of generational difference among four generations.
The study was done on 407 respondents from five countries. It revealed that generational
differences exist in terms of work values. It reported that the value placed on „hardwork‟ showed
a pattern of decline with younger generations. It relate with the popular belief that work ethic is
declining in younger generations. It specifically reports significant difference for Generation Y.
The most importantwork value for Traditionalists and Baby Boomers was „hard work‟, while for Generation Xwas „asceticism‟ and for Generation Y was „leisure‟. It also suggests that
1
Generation Y may respond more positively to receiving more regular feedbackand recognition;
Generation Y does not equate „hard work‟ to personal or professional success; a desire forliving
in the present and gratification of immediate needs is higher in Generation Y compared to other
generations; attaining work–life balance and flexibility is more important for Generation Y. This
study is focused on work values and protestant work ethic (PWE) and is silent on their work
engagement.
A study (Lyons & Kuron, 2014) critically reviewed the research evidences concerning
generationaldifferences in a variety of work-related variables, including personality, work
values, work attitudes,leadership, teamwork, work–life balance and career patterns. It reports few
interesting findings like the importance of job security decreased through generations;
leisurevalues increased with successive generations, whereas work centrality declined; the
importance of extrinsicvalues was curvilinear, peaking in the mid-1990s; job entitlement (i.e., a
belief that one who works hard in school isowed a good job) was higher for the younger cohort; a
linear downward trend in job satisfaction with successive generations; an upward trend in
intentions to quit among successive generations; increasing priority on work–life balance, both
attitudinally and behaviorally in successive generations; successive generations were less likely
to follow the “traditional” upward linear career path and were increasinglymobile in their
careers, despite a desire for stability; increased job and organizational mobility in successive
generations was also observed. The study is mainly focused on collating and summarizing
existing literature and recommending further scope of research.
A study(Meier & et al., 2010) conducted on 85 respondents identified seventeen categories
from their responses to two open ended questions in which they were asked to mention
motivating/demotivating factors at work. Leadership, salary, interesting work and atmosphere
emerged as the most influential factors to Generation Y. It also reports that Generation Y have
higher expectations and radically different goals than Generation X.The study articulated the
factors but has not thrown light on engagement level of Generation Y.
A study(Busch & et al., 2008)done on 128 participants from IT industry identified four areas
and analyzed the differences across three generations – Baby boomers, Generation X and
Generation Y. The four areas identified were status (e.g. issues relating tostatus); need for
recognition (e.g. seeking praise andattention from colleagues and superiors), commitment to the
enthusiasm or ambition with regard to workplaceperformance).Key findings for each of the four
area were – Generation Y is more passionate about their work, more idealistic about their
workplace, more focused on formal recognition awards related to work achievements, less
committed to learning in the workplace and have more idealistic views with regard tohow the
workplace should be structured. The study was limited to IT domain and mainly focused on
differences between Baby boomers and combined response from Generation X and Y. It had
very less responses from Generation Y.
A study (Dulin, 2008) was conducted on 413 Generation Y respondents from Texas. It
identified five leadership themes using focus-group interviews and then developed a structured
questionnaire for survey. It reported that Gen Y employees may be very high tech, butthey want
high touch in their relationship. In their early careers, this cohort wants mentors to help them
around thetypical bureaucracies. Gen Y employees do not want to moveslowly up the career
ladder. It also confirmed that Gen Y members may not thrive under a heavy, formal bureaucracy
where it may be tougherto corroborate, share ideas, and communicate. It also confirmed that the
Gen Y employee views learning asa life-long endeavor. For this cohort, learning is not onlyabout
advancement; it is an avenue to keep them interestedin their chosen profession. The study
focused on leadership preferences and has shed very little light on work engagement of
Generation Y.
A study(Benson & Brown, 2011)conducted in a large Australian public sector research
organization reveals that the Baby Boomers have higher job satisfaction and a lower willingness
to quit than their Generation Xcolleagues. The study captured around 2765 responses but the
study did not include Generation Y respondents.
A study done on 649 respondents from Greece who are in Millennial generation reveals that
millennial-aged Greeks placemost importance on intrinsic and social aspects of work, and less
importance onextrinsic and prestige values.
A study(Zopiatis & et al., 2012) conducted on 302 hospitality workers confirms the presence
of inter-generational differences among three generations – Baby boomers, Generation X & Y.
between Generation Y and Baby Boomers. It also suggests that Generation Y share a much
different perception as to their own generation's work values and beliefs compared to Generation
X and Baby Boomers, who seem to agree on this issue.
A study (Dalal, 2015) conducted on 89 working professionals in India endorses that
generational diversity at work place can lead to conflict. It outlines few characteristics of
Generation Y and provides suggestions for creating a better collaborative work environment at
work place.
Above literature review clearly suggests the Millennials are different than earlier generations
but hardly any study is available which describes the kind or level of their engagement especially
work engagement and hence the current study will significantly add to the existing body of
literature on Millennials.
3. Research Methodology
The study aims at understanding the work engagement level among Millennial
generation.The target population for the study is people who are born between 1981 and 1995
and are working in any Indian organization. Estimated population of the study is more than 25
crore so sample survey method is used to collect samples from target population. Social
networking apps and platforms/websites like Facebook, LinkedIn, WhatsApp are used to select
and invite age-appropriate respondents. A blend of non-probability sampling techniques namely
snowball, judgment and convenience sampling are used to collect primary data. Responses are
collected using tailor-made, structured questionnaire instrument. Variable work engagement is
measured using Utrecht Work Engagement Scale having total 17 items with 3 subscales namely
Vigor (6 items), Dedication (5 items) and Absorption (6 items). 5 point Likert scale was used to
measure agreement level of the respondent to the given statement. Response code 1 indicated
„Strongly Disagree‟ and 5 indicated „Strongly Agree‟. Reliability of the instrument was
validated. Table 1clearly indicates that reliability of each item of the instrument is quite higher
than the acceptable limit or 0.70. This indicates that instrument is highly reliable for measuring
work engagement. Cronbach‟s alpha for overall work engagement instrument was reported 0.90
and for three subscales - Vigor (0.76), Dedication (0.87) and Absorption (0.79) which are also
TABLE1 : Cronbach‟s Alpha for each item of the instrument
# UWES Statement Cronbach's Alpha
if Item Deleted
1 V1-At my work, I feel bursting with energy .899
2 V2-At my job, I feel strong and vigorous .891
3 V3-When I get up in the morning, I feel like going to work .891
4 V4-I can continue working for very long periods at a time .893
5 V5-At my job, I am very resilient, mentally .898
6 V6-At my work I always persevere, even when things do not go well .898
7 D1-I find the work that I do full of meaning and purpose .890
8 D2-I am enthusiastic about my job .888
9 D3-My job inspires me .887
10 D4-I am proud on the work that I do .889
11 D5-To me, my job is challenging .894
12 A1-Time flies when I'm working .891
13 A2-When I am working, I forget everything else around me .897
14 A3-I feel happy when I am working intensely .893
15 A4-I am immersed in my work .891
16 A5-I get carried away when I‟m working .897
17 A6-It is difficult to detach myself from my job .896
4. Findings and discussion
The study used 397 valid responses received from target population. Table 2 given below
gives summary for selected demographic and other variables and describes their frequency
distribution, percentage representation in total population, mean score of work engagement (out
of 5) and p-value indicating association between the variable and work engagement.It is evident
from the Table 2 that except „Level in Organizational Hierarchy‟ all other variables are not
having statistically significant association with work engagement. The mean value of work
engagement is observed higher for senior level employees compared to junior level employees.
The primary reason for the same could be the autonomy enjoyed by senior people in decision
making and in managing their work. Contrary to the conventional belief, the association of three
sub-generation with work engagement is not statistically significant.
TABLE2: Summary of cross tabulation between selected variablesand work engagement
# Variable Name (Frequency-%) Mean p-value Interpretation* 1 Gender
Female (114-29%) Male (283-71%)
3.80 3.89
.234 NOT significant
# Variable Name (Frequency-%) Mean p-value Interpretation* Married (250-63%)
Single (147-37%)
3.87 3.85 3 Qualification
Graduation or lower (101-25%) Post-graduation or higher (296-75%)
3.83 3.87
.814 NOT significant
4 Locational presence of Organization at Single Location (84-21%)
at multiple locations in India (166-42%)
at multiple location across the world (147-37%)
3.88 3.89 3.82
.286 NOT significant
5 Level in Organizational hierarchy Junior Level (107-27%)
Middle Level (249-63%) Senior Level (41-10%)
3.74 3.88 4.09
.031 Significant
6 Work Week Type
5 days a week (110-28%)
5.5 days a week/Alternate Saturday off (27-7%) 6 days a week (260-65%)
3.83 3.96 3.87
.877 NOT significant
7 Year of Birth
1981 and 1985 (133-33%) 1986 and 1990 (210-53%) 1991 and 1995 (54-14%)
3.88 3.86 3.83
.769 NOT significant
*Interpretation indicates that whether the association between given variable and overall work
engagement is statistically significant or not using chi-square test / pearson chi-square.
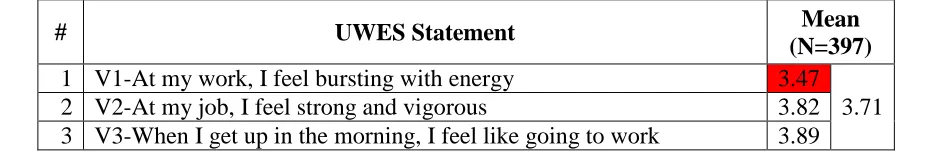
As mentioned in the research methodology section, responses were collected on a five point
Likert scale for each of the statement. Mean value was calculated for each statement, for each
[image:7.612.73.544.613.692.2]subscale i.e. Vigor, Dedication and Absorption and lastly for work engagement. Same is given in
Table 3. It is evident from this table that Dedication subscale scored higher (4.13) compared to
other two for Millennials which can be interpreted as they are feeling good about their jobs. On
the other hand, Vigor subscale scored the least (3.71) which indicates that the drivers for going to
job are not that favorable.
TABLE3 : Mean score of work engagement for each work engagement statement and subscales
# UWES Statement Mean
(N=397)
1 V1-At my work, I feel bursting with energy 3.47
3.71
2 V2-At my job, I feel strong and vigorous 3.82
# UWES Statement Mean (N=397) 4 V4-I can continue working for very long periods at a time 3.82
5 V5-At my job, I am very resilient, mentally 3.60
6 V6-At my work I always persevere, even when things do not go well 3.63 7 D1-I find the work that I do full of meaning and purpose 3.98
4.13
8 D2-I am enthusiastic about my job 4.26
9 D3-My job inspires me 4.13
10 D4-I am proud on the work that I do 4.26
11 D5-To me, my job is challenging 4.02
12 A1-Time flies when I'm working 4.17
3.80 13 A2-When I am working, I forget everything else around me 3.60
14 A3-I feel happy when I am working intensely 4.26
15 A4-I am immersed in my work 3.86
16 A5-I get carried away when I‟m working 3.45
17 A6-It is difficult to detach myself from my job 3.44
Overall 3.86
Colour Legend
Mean values ranked 1,2,3 (top three) Mean values ranked 4,5
Mean values ranked 13,14
Mean values ranked 15,16,17 (bottom three)
A comparative analysis is carried out within Milleannialgeneration by further segregating it
into three sub-generations; that is respondents having birth year 1981 to 1985, 1986 to 1990 and
1991 to 1995. It is known fact that India introduced Liberalization, Privatization and
Globalization (LPG) policy from 1991. It is assumed that, just like other geo-political
phenomenon, this also have impact on generational difference and particularly Millennial
generation. As per Table 2, association between these sub-generations with work engagement is
not statistically significant but the trend values of overall work engagement is found decreasing
from 3.88 to 3.83. Moreover, difference is also found in the statements with highest and lowest
mean values. Two statements from Absorption subscales (A5 and A6) scored least mean value
(3.38) for 1981 to 1985 cohort but for 1991 to 1995 cohort, it was fifth statement from Vigor
subscale (V5) with (3.37) mean value. The color coding of the values makes these differences
TABLE4 : Mean score of work engagement for each work engagement statement and subscales
# UWES Statement
1981-1985 (N=133)
1986-1990 (N=210)
1991-1995 (N=54)
1 V1-At my work, I feel bursting with energy 3.53 3.44 3.46
2 V2-At my job, I feel strong and vigorous 3.83 3.88 3.61
3 V3-When I get up in the morning, I feel like going to work 3.93 3.90 3.78 4 V4-I can continue working for very long periods at a time 3.87 3.78 3.85
5 V5-At my job, I am very resilient, mentally 3.68 3.60 3.37
6 V6-At my work I always persevere, even when things do not go well
3.64 3.61 3.69
7 D1-I find the work that I do full of meaning and purpose 3.90 3.99 4.11
8 D2-I am enthusiastic about my job 4.23 4.28 4.24
9 D3-My job inspires me 4.17 4.10 4.11
10 D4-I am proud on the work that I do 4.32 4.26 4.17
11 D5-To me, my job is challenging 4.03 4.00 4.09
12 A1-Time flies when I'm working 4.12 4.21 4.17
13 A2-When I am working, I forget everything else around me 3.64 3.60 3.52
14 A3-I feel happy when I am working intensely 4.36 4.22 4.19
15 A4-I am immersed in my work 3.99 3.81 3.72
16 A5-I get carried away when I‟m working 3.38 3.48 3.50
17 A6-It is difficult to detach myself from my job 3.38 3.46 3.50
Overall 3.88 3.86 3.83
Colour Legend
Mean values ranked 1,2,3 (top three) Mean values ranked 4,5
Mean values ranked 13,14
Mean values ranked 15,16,17 (bottom three)
5. Conclusion, implication and limitation
The study clearly identified the work engagement levels in Millennial generation by drawing
mean value for each UWES statement and giving ranking to them. The findings substantiates
that the generation have unique characteristics for work engagement. The statements which are
in top three clearly indicates that Millennials feel enthusiastic about their job, feel proud about
the work they do and feel happy when they work intensely. Bottom three statements indicate that
Millennials can be easily detached from the job, they don‟t get carried away by the job and they
avenues/options for getting distractions at work. The reasons can range from access to social
media, nature of job to the vary nature of the generation which demands variety. Dedication
subscale score highest mean value (4.13) which indicates that they are completely dedicated
towards what they do but the flip side is they don‟t want to continue doing the same thing for
longer time. This is clearly substantiated by the lowest mean value (3.71) to Vigor subscale. It
implies that Management of the organization, Line Managers and HR team have to relook to the
jobs being done by this generation at workplace. They need to review the job rotation, transfer
and promotion policies and make them more agile and flexible to accommodate the need of this
generation. It can also be implied that this generation is keener to learn new things so more focus
to be given to Learning & Development processes and methods.
The study collected 397 responses. This number is good for such descriptive kind of research
but the number is not good enough for population size. Moreover, samples are drawn using
non-probability sampling method. Due to these two things, sample cannot be considered as
representative sample of the population and hence findings of the study cannot be generalized to
target population. As the objective of the study was to find out engagement levels of Millennial
generation, it didn‟t explore any comparison with other generations or causal relationship with
other generations.
REFERENCES
1. Aon Hewitt. (2017). 2017 Trends in Global Employee Engagement. New York: Aon Hewitt.
2. Schaufeli, W., & Bakker, A. (2004, December).
http://www.wilmarschaufeli.nl/publications/Schaufeli/Test%20Manuals/Test_manual_UWES
_English.pdf. Retrieved 2016, from Personal website of Wilmar Schaufeli:
http://www.wilmarschaufeli.nl
3. Cogin, J. (2012). Are generational differences in work values fact or fiction? Multi-country
evidence and implications. The International Journal of Human Resource Management,
23(11), 2268–2294.
4. Lyons, S., & Kuron, L. (2014). Generational differences in the workplace: A review of the
evidence and directions for future research. Journal of Organizational Behavior, 139-157.
5. Meier, J., & et al. (2010). Generation Y in the Workforce: Managerial Challenges. The
6. Busch, P., & et al. (2008). Generational Differences in Soft Knowledge Situations: Status,
Need for Recognition, Workplace Commitment and Idealism. Knowledge and Process
Management, 45-58.
7. Dulin, L. (2008). Leadership prefereneces of a Generation Y cohort. Journal of Leadership
Studies, 43-59.
8. Benson, J., & Brown, M. (2011). Generations at work: are there differences and do they
matter? The International Journal of Human Resource Management, 1843-1865.
9. Zopiatis, A., & et al. (2012). Y-ers, X-ers and Boomers: Investigating the multigenerational
(mis)perceptions in the hospitality workplace. Tourism and Hospitality Research, 101-121.
10.Dalal, K. (2015). Study on Generational Diversity at Workplace and Mitigating the Conflicts
Arising on Account of Generational Differences Amongst them. International Journal of