QUANTIFICATION OF INCREASE IN BLOOD PRESSURE WITH
THE REDUCTION IN FORCED VITAL CAPACITY OF LUNGS OF
SAND STONE MINE WORKERS
Dr. Suresh Kumar Singh,
Associate Professor Department of Civil Engineering Faculty of Engineering & Architecture Jai Narain Vyas University Jodhpur ( Raj) – India
Banna Ram Panwar,
Regional Officer
Rajasthan State Pollution Control Board Jodhpur ( Raj) India
Dr. Saroj Panwar,
Principle Specialists Radiology Paota Satellite Hospital Jodhpur ( Raj) –India
ABSTRACT
When any human being is constantly exposed to respirable suspended particulate
matter for longer duration his respiratory tract is damaged and forced vital capacity is
reduced. Sand stone mine workers are continuously working in the environment having
high concentration of RSPM. Study has been carried out on 370 male sand stone mine
workers engaged in various activities. Reduction in FVC and increase in BP was measured .
Analysis indicates that the IFVC ( Decrease in vital capacity) account for the increase in ISBP upto
56 % and remaining rest 44 % increase is due to other reasons and IFVC account for the increase
in IDBP upto 74.1 % and remaining 25.9 % variation is due to other reasons. Increase in DBP is
varying from 16.3 % to 23.2 % and increase in SBP is varying from 30.5% to 41.9 % depending
upon reduction in FVC. Result indicates that increase in DBP is closely associated with the
decrease of FVC. Hence it can be revealed from the study that reduction in FVC is responsible for
increase of DBP and SBP.
Key Words:
Systolic Blood Pressure , Diastolic Blood Pressure, Respiratory tract, Respirable
Introduction:
Occupational exposure to dust is a well-known phenomenon, especially in developing
countries. Although sources of air pollutants include power plants, cement factories,
refineries and petrochemical industries, the emission of particulates is quite high from sand
stone quarries. Workers working in sand stone mines are exposed to high concentration of
respirable suspended particulate matter ( RSPM) and this RSPM is deposited in the
respiratory tract. The toxicology of the RSPM depends upon the size of the particles and
chemical composition of particles. The deposition of RSPM in the lungs decrease Forced
Vital Capacity ( FVC) of lungs. The decrease in FVC depends upon the exposure duration
and concentration of RSPM. Several observational studies have demonstrated that short-term
exposure to fine particulate matter (PM) <2.5 µm in diameter (PM2.5) can acutely raise blood
pressure (BP) [3,4]. Ibald-Mulli et al., (2001); Linn et al., (1999), analysed effects of air
pollution on blood pressure in a population based sample as well as in a panel of asthmatic
subjects found an increase in systolic blood pressure with elevated concentrations of
particulates[6,7]. Brook et al., (2008) messaged the clinicians that the cardiovascular health
consequences of air pollution are generally equal or exceed those due to pulmonary diseases
[5]. Dvonch et al., (2009), suggested a link between exposure to ambient particulate matter
<2.5 μm in diameter (PM2.5) and adverse cardiovascular outcomes. PM2.5 was significantly
associated with systolic blood pressure; a 10-μg/m3 increase in daily PM2.5 was associated
with a 3.2-mm Hg increase in systolic blood pressure (P= 0.05). However, in models that
added a location interaction, larger effects were observed for systolic blood pressure within
the community with highest PM2.5 levels; a 10 μg/m3
increase in daily PM2.5 was associated
with a 8.6 mm Hg increase in systolic blood pressure (P=0.01) [2]. According to Bellavia et
al., (2013), Short-term exposures to fine (<2.5 lm aerodynamic diameter) ambient
particulate-matter (PM) have been related with increased blood pressure (BP) in controlled-human
exposure and community-based studies. However, whether coarse (2.5 to 10 μm) PM
exposure increases BP is uncertain. Recent observational studies have linked PM exposures
with blood DNA hypomethylation, an epigenetic alteration that activates inflammatory and
vascular responses [1]. Most of the researchers have carried out the study on a particular
concentration of a particular pollutant and its effect on blood pressure. All most in all the
Quantification of increase of blood pressure with the decrease of forced vital capacity is not
established. In this study attempt is made to establish relationship between increase in BP
and decrease in FVC.
Methodology:
The sandstone quarrying/ mining process is done manually and mechanically but the
involvement of workers in both the cases is significant. There are three types of workers, in
the quarrying process:
a. Driller : These sets of workers are employed for blasting, and drilling operations
b. Dresser: These are the workers employed for doing finer work, by chiseling , cutting
or dressing the stone pieces for decorative works.
c. Labours: These sets of workers are employed for loading & unloading operations and
are exposed to normal quarry environment.
(1) The workers were selected for the study from various stone quarries. The
selection of workers was based upon the exposure duration, type of work,
socioeconomic factor, and previous diseases. The workers having hereditary
respiratory & cardiovascular problems were not taken for study. Only male
workers have been considered in this study . The workers were divided into three
categories:
(a) Driller
(b) Dresser
(c) Labours
The control workers were selected from the same category of life style,
socioeconomic standard but are not exposed to pollution.
(2) RSPM concentration was measured during various activities in the mines and
average concentration of RSPM for various activities are given in table-1.
(3) The systolic blood pressure (SBP) and diastolic blood pressure (DBP) and FVC (
Forced vital Capacity of lungs) of mine workers exposed to different
concentration of RSPM was measured with the help of Multiparameter Monitor
and Spirometer respectively. SBP & DBP and FVC of control population was also
measured. Total number of workers of various categories, involved in this study
(4) The lung capacity of a person depends upon its age, height and weight, and the
reduction of lung volume due to damage depends upon the concentration of
particulate matter and duration of exposure. Therefore, it is not possible to find
out the generalised amount of volume reduction due to pollution. Hence index is
developed to find out the extent of damage in terms of percentage of volume
reduction in fraction. The index is designated as IFVC for “forced vital capacity”.
Similarly, indices were also calculated for Systolic blood pressure and Diastolic
blood pressure and are represented as ISBP ( percentage increase in systolic
blood pressure in fraction) and IDBP ( percentage increase in diastolic blood
pressure in fraction) respectively. These indices were calculated from equations
given below and are given in table -3.
IFVC = ( FVCp – FVC ) / FVCp
ISBP = (SBP-120) / 120
IDBP = (DBP-80) / 80
Where : FVCP = Predicted value of Forced vital capacity of lungs
FVC = Measured value of Forced vital capacity of lungs
SBP = Measured value of Systolic blood pressure
DBP = Measured value of Diastolic blood pressure
Table-1
Particulate concentration for different activities
S.N
.
Activity Respirable suspendered
Particulate matter (RSPM)
Concentration
Concentration
category
1 Normal Quarry
Environment
460.00 g/m³ 1
2 Dressing 970.00g/m³ 2
3 Drilling 1890.00g/m³ 3
Category of workers and exposure duration
Category of Workers Exposure Duration
in Years
Number Of
Workers
Exposure
Category
Labour
(120)
0-5 30 1
5-10 27 2
10-15 36 3
>15 27 4
Dresser
(125)
0-5 32 1
5-10 27 2
10-15 36 3
>15 30 4
Driller
(125)
0-5 33 1
5-10 30 2
10-15 28 3
>15 34 4
Control workers --- 36 ---
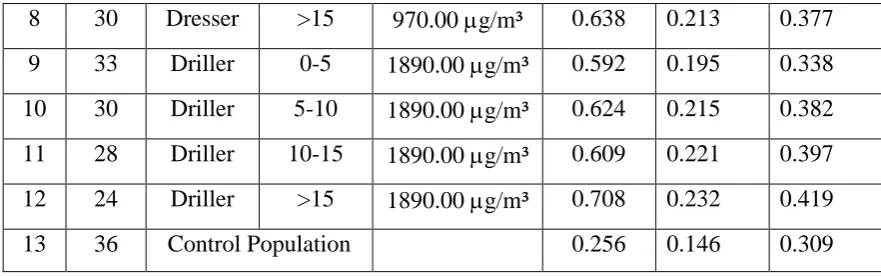
Table- 3
Mean values of indices
(Decrease in PF Values & Increase in Blood Pressure)
S.N No .Of Obs.
Worker Category
Exposure Duration
(Yrs)
Exposure Concentration
Mean IFVC
Mean IDBP
Mean ISBP
1 30 Labour 0-5 460.00 g/m³ 0.479 0.163 0.305
2 27 Labour 5-10 460.00 g/m³ 0.519 0.177 0.327
3 36 Labour 10-15 460.00 g/m³ 0.523 0.179 0.326
4 27 Labour >15 460.00 g/m³ 0.626 0.185 0.326
5 32 Dresser 0-5 970.00 g/m³ 0.546 0.18 0.361
6 27 Dresser 5-10 970.00 g/m³ 0.609 0.184 0.326
8 30 Dresser >15 970.00 g/m³ 0.638 0.213 0.377
9 33 Driller 0-5 1890.00 g/m³ 0.592 0.195 0.338
10 30 Driller 5-10 1890.00 g/m³ 0.624 0.215 0.382
11 28 Driller 10-15 1890.00 g/m³ 0.609 0.221 0.397
12 24 Driller >15 1890.00 g/m³ 0.708 0.232 0.419
13 36 Control Population 0.256 0.146 0.309
[image:6.595.84.525.85.223.2]Analysis of Observations:
Table - 4
Statistical Parameters for IFVC-IDBP ( ANOVA)
F test
Ho : β1 = 0 against H1 : not all βk = 0 :(k= 1)
Table-4 gives the value of calculated „F‟ i.e. F = 28.545 and
Fk, n-k-l, α = 4.96 (critical value from standard tables).
Here, Fcalculated > Fk, n-k-l, α
Hence, reject H0 at α (value = 0.05)
level of significance individual of significance β‟s be tested by „t - Test‟.
t- Test
H0 : βj = 0 against H1 : βj ≠ 0 : (j = 1)
The calculated values for „t - statistics‟ for β1 is given in ANOVA table-4.
t (for β1) = 5.343
The value of tn-k-1, α / 2 = 2.26
Here t > t ; therefore reject H. Model R R
Square
Std. Error of the Estimate
F-Value df Coeff. t
1 0.861 0.741 .011289 28.545
Regression Residual Total
1 10 11
Constant IFVC
.028
.283 .888 5.343
Hence, β1≠ 0
As the estimated b0 and b1 are
b0 = 0.028
b1 = 0.283
Thus, estimated multiple regression equation for IDBP can be expressed as :
[image:7.595.72.521.307.443.2]IDBP = 0.283 IFVC + 0.028
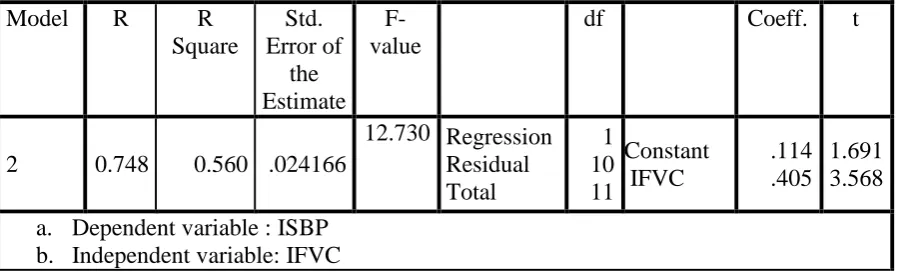
Table - 5
Statistical Parameters for IFVC-IDBP ( ANOVA)
F test:
Ho : β1 = 0 against H1 : not all βk = 0 :(k= 1)
ANOVA table-5 gives the value of calculated „F‟ i.e. F = 12.730 and
Fk, n-k-l, α = 4.96 (critical value from standard tables).
Here, Fcalculated > Fk, n-k-l, α
Hence, reject H0 at α (value = 0.05)
level of significance individual of significance β‟s be tested by „t - Test‟.
t- Test:
H0 : βj = 0 against H1 : βj ≠ 0 : (j = 1)
The calculated values for „t - statistics‟ for β1 is given in ANOVA table-5.
t (for β1) = 3.568
The value of tn-k-1, α / 2 = 2.23
Here t > tn – k – 1; α /2 ; therefore reject H0.
Hence, β1≠ 0 Model R R
Square
Std. Error of
the Estimate
F-value
df Coeff. t
2 0.748 0.560 .024166
12.730 Regression Residual Total
1 10 11
Constant IFVC
.114 .405
1.691 3.568
As the estimated b0 and b1
b0 = 0.114
b1 = 0.405
Thus, estimated multiple regression equation for IFVC can be expressed as :
ISBP = 0.405 IFVC + 0.114
Analysis indicates that the independent variable IFVC ( Decrease in vital capacity) account
for the increase in ISBP upto 56 % and remaining rest 44 % increase is due to other reasons
and independent variable IFVC account for the variation in IDBP upto 74.1 % and
remaining 25.9 % variation is due to other reasons. Increase in DBP is varying from 16.3 %
to 23.2 % and increase in SBP is varying from 30.5% to 41.9 % depending upon reduction
in FVC. As per the medical science increase in DBP is more dangerous and as per
statistical analysis indicates that increase in DBP is closely associated with the decrease of
FVC. Hence it can be revealed from the study that reduction in FVC is responsible for
increase of DBP and SBP.
Conclusion:
Sand stone mine workers inhale air which contains high amount of RSPM and
these small particles are deposited in the respiratory system at different places. The
deposition of RSPM in the respiratory tract can damage the system thereby
reducing the FVC of the lungs and adversely affect the working of respiratory system.
Based on the study done the important conclusions drawn are :
1 Increase in DBP or SBP is associated with reduction in FVC.
2 It is concluded that the increase in DBP significantly depends on the reduction
in FVC .
3 The multiple regression equation developed to relate the increase in DBP/ SBP
with the decrease of FVC are
ISBP = 0.405 IFVC + 0.114
IDBP = 0.283 IFVC + 0.028
Exposure to high concentration of RSPM (workers are exposed to high
concentration of RSPM) in stone quarries and deposition of RSPM in respiratory
cardiovascular system . Hence it is urgent need to develop some techniques to reduce
the RSPM in the working place and provide good working environment .
References:
1 Bellavia A.; Urch B.; Speck M.; Brook R.D.; Scott J.A.; Albetti B.; Behbod B.; North M.; Valeri L.; Bertazzi P.A.; Silverman F.; Gold D.; Baccarelli A.A. (2013), DNA Hypomethylation, Ambient Particulate Matter, and Increased Blood Pressure: Findings From Controlled Human Exposure Experiments. Journal of the Americal Heart Association, DOI: 10.1161/JAHA.113.000212
2 Dvonch J.T.; Kannan S.; Schulz A.J.; Keeler G.J.; Mentz G.; House J.; Benjamin A.; Max
p.; Bard R.L.; Brook R.D. (2009), Acute Effects of Ambient Particulate Matter on Blood Pressure Differential Effects Across Urban Communities. Hypertention , Vol 53 pp853-859
3 Choi JH, Xu QS, Park SY, Kim JH, Hwang SS, Lee KH, Lee HJ, Hong YC. (2007), Seasonal variation of effect of air pollution on blood pressure. J Epidemiol Community Health. ;61:314 –318.
4 McCracken JP, Smith KR, Díaz A, Mittleman MA, Schwartz J. (2007), Chimney stove intervention to reduce long-term wood smoke exposure lowers blood pressure among Guatemalan women. Environ Health Perspect ;115:996 –1001
5 Brook, R.D., B. Franklin, W. Cascio, Y. Hong,G. Howard, M. Lipsett, R. Luepker, M. Mittleman, J. Samet, S.C. Smith and I. Tager,( 2004). Expert panel on population and prevention science of the American Heart Association. Air pollution and cardiovascular disease: A statement for healthcare professionals from the expert panel on population and prevention science of the American Heart Association. Circulation, 109: 2655-2671.
6 Ibald-Mulli, A., Steiber, J., Wichmann, E., Koenig, W., Peters, A., (2001). Effects of air pollution on blood pressure: a population based approach. Am. J. Public Health 91, 571–577