Use of Molecular and Bioinformatics Tools for Developing Methods
of Epidemiological Identification of Trypanosomes
By Gaber Adwik
Submitted in fulfilment of the requirements of the degree of Doctor of
Philosophy
Jan 2016
College of science &Technology
School of Environment & Life Sciences
Contents
List of Figures ... V
List of Tables ... VIII
Acknowledgment ... IX
Declaration Form ... X
Abbreviations ... X
Abstract ... XI
Chapter 1 Introduction ... 13
1.1 History of Human Sleeping Sickness (HAT) ... 14
1.2 The Pathogenic Parasite- Trypanosoma brucei ... 15
1.3 Life Cycle of T. brucei ... 18
1.4 Transmission Cycle ... 20
1.5 The vector- Tsetse fly ... 21
1.6 Epidemiology of African sleeping sickness ... 23
1.6.1 Sleeping sickness in Angola ... 29
1.6.2 Current situation of HAT ... 34
1.7 Diagnosis of Trypanosomiasis ... 36
1.7.1 Parasitological Diagnosis ... 37
1.7.2 Card Agglutination Test for Trypanosomiasis ... 38
1.7.3 Molecular Diagnosis ... 40
1.7.3.1 Genetic Markers ... 43
1.7.3.1 Internal Transcribed Spacer (ITS)-PCR ... 47
1.7.3.1 Mini- And Micro-Satellite Markers ... 49
1.7.3.1 Random Amplified Polymorphic DNA (RAPD) ... 49
1.7.3.1 Amplified fragment length polymorphism (AFLP) ... 50
1.7.3.2 Mobile Genetic Element PCR (MGE-PCR) ... 51
1.7.3.4 Loop-Mediated Isothermal Amplification (LAMP) ... 52
1.8 Treatment of HAT ... 54
1.9 Aims ... 52
Chapter 2 Materials and Methods ... 53
2.1 Sample collection ... 54
2.2 Sample Processing ... 54
2.4 Trypanosome DNA serial dilutions ... 55
2.5 PCR Amplification ... 55
2.6 Visualization ... 58
2.7 DNA extraction from agarose gels ... 58
2.8 Sequencing of the PCR product (DNA) ... 58
2.9 Restriction enzymes digestion... 59
2.10 Bioinformatics and analysis of T.brucei genome TREU927 ... 59
Chapter 3 Identification of African trypanosome species from FTA card using ITS-PCR ... 61
3.1 Introduction ... 61
3.1.1 Aims and Objectives ... 66
3.2 Methods ... 67
3.3 Results ... 68
3.3.1 Description of the samples of infected blood immobilised on FTA cards from human trypanosomiasis patients in Angola ... 68
3.3.2 DNA amplification and diagnosis of trypanosomiasis ... 74
3.3.2.1 Sensitivity of nested ITS-PCR ... 74
3.3.3 Identification of nested ITS-PCR amplified products (DNA sequencing) ... 90
3.3.4 Analysis of positive and negative infections in the Angolan samples ... 95
3.4 Discussion ... 99
Chapter 4 . Identification of trypanosomes from FTA cards spotted with blood using MGE-PCR... 107
4.1 Introduction ... 107
4.2 Objectives ... 113
4.3 Methods ... 114
4.4 Results ... 115
4.4.1 Development of the use of MGE-PCR in FTA cards ... 115
4.4.2 Chelex-MGE-PCR detection of trypanosomes in FTA cards ... 117
4.4.3 Investigation of REV B specificity using DNA sequencing to confirm band sizes ... 123
4.4.4 Improving DNA sequencing of REV B amplified products using restriction enzyme digestion to semi-purify fragments ... 124
4.4.5 Negative control amplification by REV B ... 129
4.5 Discussion ... 139
Chapter 5 Investigation of Mobile Genetic Elements Found Inserted in Retrotransposon Hotspot Genes (RHS) in the T. brucei TREU927 Genome ... 143
5.1 Introduction ... 143
5.2 Objectives ... 149
5.3 Methods ... 150
5.4 Results ... 151
5.4.1 Identification of retrotransposon hot spot (RHS) genes in the TREU927 genome ... 151
5.4.2 Evolutionary relationship of RHS genes: ... 155
5.4.2.1 RHS 3 and RHS4 mutational change analysis ... 158
5.4.3 Evolutionary time dimensions of RHS genes ... 166
5.4.4 Mobile genetic element markers in the differentiation of trypanosome strains ... 169
5.4 Discussion ... 179
6.1 General discussion ... 184
6.1 Future work ... 198
6.2 Conclusion ... 199
7. References ... 200
Appendices ... 228
Appendix 1 ... 228
Appendix 2 ... 233
Appendix 3 ... 235
List of Figures
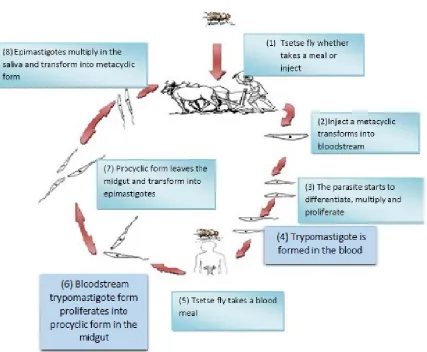
Figure 1-1. The life cycle of T. brucei in the vector and in the host ... 20
Figure 1-2. The distribution of T. b. gambiense and T. b. rhodesiense and subgenera of tsetse fly in Africa ... 22
Figure 1-3. The number of HAT (T.b.gambiense and T.b.rhodesiense ) cases and the geographical distribution in 2013. ... 24
Figure 1-4. The number of cases of HAT reported from 1997-2013 ... 26
Figure 1-5. Geographical locations of tsetse fly sub-species in Angola ... 33
Figure 1-6. Population at risk of HAT in Africa. ... 36
Figure 1-7. Generic structure of the ITS genes of eukaryotes ... 48
Figure 1-8. The chemical structures of drugs used in treatment of HAT. ... 51
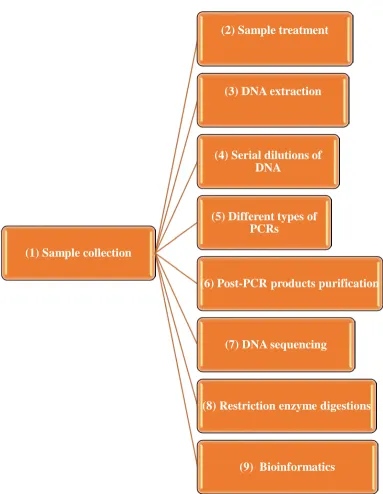
Figure 2-1. The methods that were followed in this present study ... 53
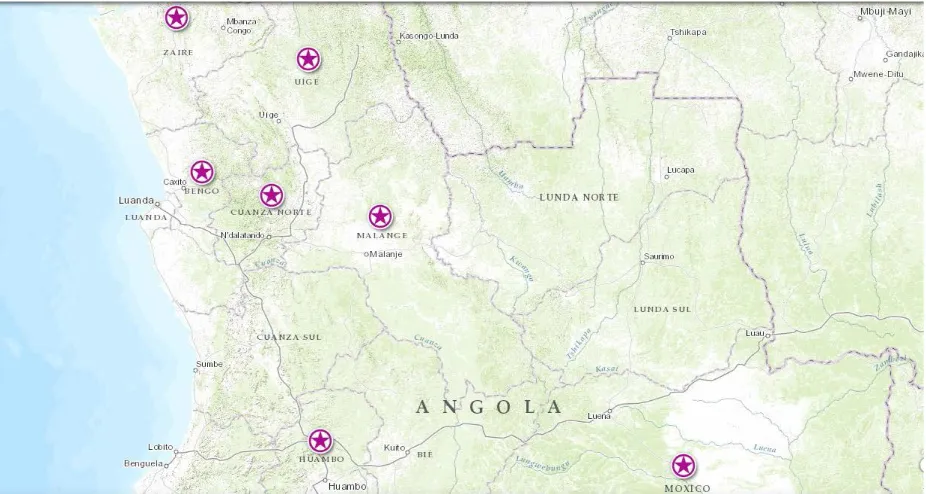
Figure 3-1. Angolan map showing the locations of the collection of patients ... 69
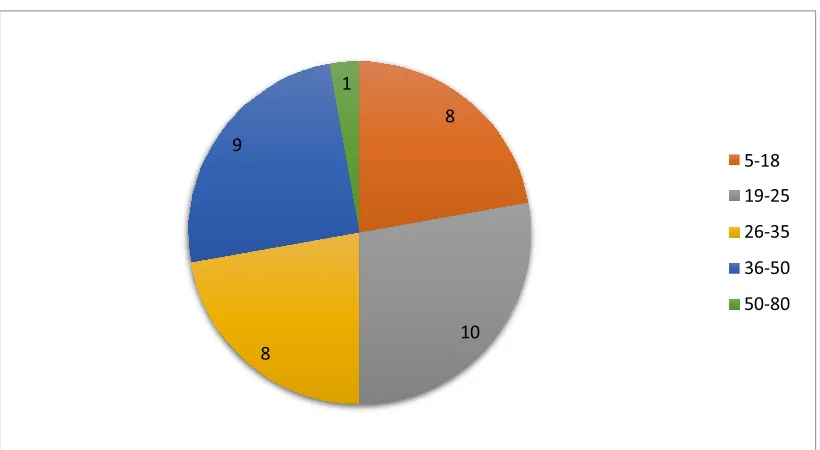
Figure 3-2. The age groups of the patients who participated from Angola ... 71
Figure 3-3. Angolan patients medical history ... 72
Figure 3-4. Duration of symptoms for each Patient ... 73
Figure 3-5 Nested ITS-PCR of Trypanosome DNA and blood spotted on FTA cards . 75 Figure 3-6 Nested ITS-PCR of Trypanosome DNA spotted on FTA cards at different concentrations. ... 76
Figure 3-7. The relationship between the concentration of the DNA and detection of the trypanosome by nested ITS-PCR... 81
Figure 3-8. Mammalian Tubulin PCR amplification of the Angolan samples ... 82
Figure 3-9. Mammalian Tubulin PCR amplification of the Angolan samples ... 83
Figure 3-10. Nested ITS-PCR amplification of DNA that was extracted from 5 punches from the FTA cards of the Angolan patients using Chelex® 100 ... 84
Figure 3-11. Nested ITS-PCR amplification of DNA that was extracted from 5 punches from the FTA cards of the Angolan patients using Chelex® 100 method ... 85
Figure 3-12. Nested ITS-PCR amplification of DNA that was extracted from 10 punches from the FTA cards of the Angolan patients ... 86
Figure 3-13. The nucleotides comparison between X02483.1 (Trypanosoma brucei gene for 5.8S ribosomal RNA) and sample 1 ... 92
JX993625.1(Malassezia restricta strain 99B internal transcribed spacer 1). ... 94
Figure 3-16. The number of positive detection of trypanosome by nested ITS-PCR/Chelex between the two genders participated in this study ... 96
Figure 3-17. The trypanosomes detection rate by nested ITS-PCR versus the patient’s treatment history ... 97
Figure 4-1. MGE-PCR using 10pmol primer REV B Amplification ... 116
Figure 4-2. MGE-PCR using amplification by the REV B primer at increased primer concentration. ... 116
Figure 4-3. MGE-PCR of FTA card samples from Angolan sleeping sickness patients. ... 117
Figure 4-4. MGE-PCR of FTA card samples from Angolan samples sleeping sickness patients.. ... 118
Figure 4-5. Screen shots of the DNA sequencing of REV B amplified products.. ... 124
Figure 4-6. Schematic diagram of MGE-PCR through REV B amplification ... 125
Figure 4-7. Restriction enzyme (AlwNI) digestion of MGE-PCR products ... 127
Figure 4-8. The DNA sequence of the digested band . ... 128
Figure 4-9. The DNA sequence of the digested band ... 129
Figure 4-10. REV B amplification of negative blood control. ... 130
Figure 4-11. RIME A and B amplification of Angolan samples1-17. ... 131
Figure 4-12. RIME A and B Amplification of Angolan samples 18-36. ... 132
Figure 4-13. Screen shots of DNA sequence of RIME A and RIME B amplification. 133 Figure 4-14. The screen shot from Finch TV of the DNA sequencing by RIME A and RIME B. of the two bands resulted from Angolan sample 8 amplification. ... 136
Figure 5-1. A schematic illustration of ingi and RIME elements ... 146
Figure 5-2. RHS /pseudo genes found in chromosome 2 in TREU927 genome using NCBI map viewer ... 153
Figure 5-3. The number of the RHS genes according to their families in TREU927 genome. ... 155
Figure 5-4. Molecular phylogenetic analysis using the Maximum Likelihood method showing the relationship between the RHS genes ... 156
Figure 5-5. Schematic diagram of the RHS pseudogenes inserted with retroelements. ... 157
the role of duplication evolving of RHS genes.. ... 159
Figure 5-7. Schematic of putative RHS pseudogene duplication and chromosomal
translocation of Tb927.2.1180, a functional RHS gene (Parent gene) in T. brucei.. . 162
Figure 5-8. Nucleotide alignment between the parent gene (Tb927.2.1180) and
duplicated pseudogene (Tb927.6.5160)... 165
Figure 5-9. Schematic diagram illustrating possible evolutionary scenario for the RHS
pseudogenes ... 166
Figure 5-10. Schematic diagram of the duplicated 12bp repeat similarities between
Tb927.2.5180 and Tb927.2.1210 and Tb927.1.70. ... 169
Figure 5-11. Schematic diagram of the nucleotide comparison between RHS
pseudogenes of theTREU927 (upper line) and DAL972 (lower line) genomes. ... 172
Figure 5-12. The nucleotide comparison between Tb927.6.5180 and Tbg972.6.4970
List of Tables
Table 1-1. The number of cases reported of T. b. gambiense sleeping sickness between 2004
and 2013 in Angola ... 32
Table 1-2. The primers developed for use in T. b. gambiense molecular diagnosis ... 44
Table 1-3. The genetic markers used in diagnosing T.b.rhodesiense ... 46
Table 3-1. Demographic data for the Angolan patients. . ... 70
Table 3-2. Interpretation of mammalian tubulin PCR amplification ... 83
Table 3-3. Expected and observed band sizes resulting from nested ITS-PCR from Angolan patient samples 1-17... 87
Table 3-4. Summary of the detection of trypanosomes by Chelex/ITS nested PCR on Angolan patient samples. ... 89
Table 3-5. BLAST search results of nucleotide sequences of the ITS-PCR amplified products from three Angolan samples. ... 95
Table 4-1. Summary of the MGE-PCR data from the Angolan samples.. ... 11
Table 5-1. The duplicated repeat sequence flanking the MGE insertions in RHS pseudogenes in the TREU927 genome. ... 167
Table 5-2.The RHS genes that have an MGE insertion. ... 171
Acknowledgment
First of all I would like to thank my supervisor Professor Geoff Hide, as he collectively have provided me with a unique and complimentary mix of influences and assets. His support was an absolute help to me during my research. Professor Geoff always listens and his advice was always a solution for the issues I faced during my research.
I would also like to thank Dr Belgees Boufana for her advice and encouragement in the labs, and her ability to discuss and solve problems related to the devices in the labs. Also, I would like to thank Dr David Clough from University of Sheffield for reading my thesis for proof reading purposes
This thesis is dedicated to my mother and father, who works very hard to support me during my educational career and throughout my life.
Finally I would also like to thank my family and friends for their moral support during my research.
Declaration Form
This is to certify that the thesis comprises only my original work towards the
PhD. Due acknowledgement has been made in the text to all other material used.
This work has not been submitted for any other degree or professional qualification
Gaber Adwik
………
Abbreviations
bp Base pair
CATT Card agglutination test for trypanosomiasis
CSF Cerebrospinal fluid
DNDi Drugs for Neglected Diseases Initiative
ESAG Expression site associated genes
FTA Flinders technology Australia
HAT Human African Trypanosomiasis
HCT haematocrit centrifugation technique
ITS Internal Transcribed subunit
LAMP Loop-Mediated Isothermal Amplification
MDA Multiple displacement amplification
MGE Mobile Genetic Elements
NCBI National Centre of Biotechnology Information
PCR Polymerase chain reaction
RAPD Random Amplified Polymorphic DNA
RFLP Restriction fragment length polymorphism
RHS retrotransposon hot spot
RIME Ribosomal Insertion Mobile Element
SRA serum resistance associated
TE Transposable Element
Abstract
Human African trypanosomiasis (HAT), also known as sleeping sickness, has been a
major health problem for populations in Africa caused by the Trypanosoma brucei
spp parasite. Although, the current number of the reported cases is on the decrease,
more efforts are required to try to control or eliminate the disease. The recent
advances in molecular techniques have contributed towards identifying taxonomic
groups at all levels (species, subspecies, populations, strains and isolates).
Commonly, field samples are collected and stored using Whatman FTA cards. Many
molecular epidemiological tools are available for detection and strain typing in
trypanosomes. These tools include nested ITS-PCR, which is based on size variation
of the ITS genes and MGE-PCR, which is based on variations in position of mobile
genetic elements (MGEs). Although commonly used, these tools have not been fully
validated. For example, the ITS-PCR has not been used or validated against blood
samples obtained from sleeping sickness patients in Angola. Furthermore, the
MGE-PCR system has not been evaluated for use directly from FTA cards.
The aim of this thesis is to develop improved molecular tools to assist diagnostic and
epidemiological studies. In order to improve the molecular diagnostic use of Whatman
FTA cards, an extraction method based on Chelex was investigated. Using Chelex to
extractT. brucei DNA from FTA cards, followed by a nested ITS-PCR detection
system, allowed parasite DNA detection to 1ng/µl. To evaluate this tool on field
samples, ITS-PCR amplification was carried on DNA eluted by Chelex extraction from
36 FTA cards spotted with blood from Angolan patients tested positive for
trypanosomiasis by the card agglutination test (CATT). Twenty four of these samples
were successfully PCR amplified using mammalian tubulin primers. Of these 24
ITS-PCR based approach. As such, this indicates that further work is necessary to
improve the PCR-based reliability of diagnosis.
To this end, an MGE-PCR approach was used to attempt parasite strain identification..
Although the MGE-PCR was found to be more sensitive than ITS-PCR in
amplification of DNA from FTA cards, the resulting sequence data was not able to
confirm that the amplicons were of trypanosome origin and hence further analysis, or
approaches, are required.
With a view to developing new diagnostic tools a bioinformatic analysis of mobile
elements inserted in RHS/pseudogenes in the T.brucei genome was carried out. The
aims of this were to locate variable regions of these genes that could be used as
detailed markers for trypanosome strain identification. Sequences of the RHS genes
were retrieved from the T.brucei brucei and T. brucei gambiense genomes to
investigate positional diversity of MGEs within this family of genes. Differences were
found in the presence/absence of RIME elements in one RHS gene between the two
subspecies. More detailed investigation of all RHS gene classes in T. b. brucei showed
six classes of RHS gene types and within each class, individual sequences showed
evidence of insertion by MGEs. In some specific instances, evidence of pre-insertion,
insertion and subsequent removal of MGEs was seen. This enabled a temporal
evolutionary sequence of events to be interpreted. As such, the RHS genes offer the
opportunity to develop specific molecular epidemiological tools for investigating the
evolution of MGEs in field samples and to carry out temporally informed epidemiological
Introduction
Human African Trypanosomiasis (HAT) which is also known as sleeping sickness is
a disease was associated with sleeping inappropriately. This is due to neurological
disturbances associated with the second stage of the disease, when parasites have
become manifest in the central nervous system (Barrett, 1999; Kennedy, 2005). The
African trypanosomiases comprise a group of economically important animal
diseases and medically important zoonotic diseases that affect much of sub Saharan
Africa. With economic losses in cattle production alone being in the range of US$ 1.0
- 1.2 billion (Daffala et al., 2013). HAT is considered as a serious public health
problem that is caused by trypanosomes, protozoan parasites, transmitted by tsetse
flies (Glossina). However, it is not considered as important on the world stage as
diseases such as malaria and AIDS, but it is an important disease and responsible
for an extensive degree of suffering and mortality in countries where it is endemic
(Hide, 1999).
In addition, it occurs in 36 African countries between latitudes 14° North and 29°
south. Following the geographical distribution of the tsetse fly, more than 50 million
people living in some 200 foci in this area are at risk of acquiring the infection
(Kuzoe, 1993).
The World Health Organisation (WHO) estimates suggest that 500,000 new cases of
sleeping sickness occur each year with about 60 million people considered at risk,
variations in the annual number of reported cases must be interpreted with caution
due to the impact of the civil war on case-finding (TDR, 2004). Furthermore, according
to TDR, (2002) less than 4 million people are under surveillance and only about 40,000
are diagnosed and treated.
However, thanks to an ambitious campaign led by WHO, many nongovernmental
organizations and a public private partnership with Sanofi- Aventis and Bayer
donates and distributes the necessary drugs to WHO for use in affected countries
(Simarro et al., 2011a). According to WHO (2012) in 2012 the number of reported
cases was fewer than 8000, thus WHO have designed a road map to eliminate
sleeping sickness as a public health problem by 2020.
1.1 History of human sleeping sickness (HAT)
The first report of human sleeping sickness is ascribed to Arabic historians describing
the death of King Diata II, Sultan of Mali in 1373 (De Raadt, 1999), whereas, nagana
of cattle has been known since 15th century (Nash, 1969). At the beginning of 1900,
the importance of trypanosomes as pathogens was recognized by Timothy Richards
Lewis and Griffith Evans in India and by Sir David Bruce in East Africa all of whom
gave their names to species of trypanosomes (Goodwin, 1985). However, the first time
that a trypanosome infection was reported in humans was by Forde in the Gambia in
1901 (Forde, 1902) he managed to find the parasites in the blood of a European
suffering from recurrent fevers. Furthermore, between 1900 and 1915 Portuguese,
British, French, German and Belgian scientific teams were sent out to Africa. Their aim
was to study the cause, the factors which help the spreading of the disease, and the
severity of the problem in the respective colonies. Since then sleeping sickness has
become part of the domains of biological and medical science (WHO, 2005).
On the other hand, between 1895 and 1910 there were serious epidemics in several
regions, mainly in the Congo basin, especially northern Angola and around the Lake
Victoria basin for this epidemic period the total number of deaths due to
trypanosomiasis in the Congo basin was estimated at 500,000 and in the Lake Victoria
Moreover, by the end of 19th century, the colonial authorities in Africa had become
more seriously concerned about the trypanosomiasis problems (livestock and
human disease). Between 1939 and 1960 mobile teams in French colonies of west
and central Africa had examined 73,000,000 individuals and detected 250,000 cases
(Pépin and Méda, 2001). In the 1960s, tsetse and trypanosomiasis research and
control services were well established throughout most of the endemic regions of
Africa. The number of cases of human sleeping sickness decreased to an estimated
level of no more than 15,000 and 25,000 per year for the whole continent (TDR, 2004).
1.2 The pathogenic parasite- Trypanosoma brucei
The trypanosome is a spindle-shaped cell (20 to 30 by 1.5 to 3.5 nm) with a single
flagellum. The flagellum is structured as the posterior end, runs along the cell
membrane, to which it is attached by an undulating membrane, and extends beyond
the anterior part of the cell. The base of the flagellum is associated with the
kinetoplast, a large particle containing the DNA of the single mitochondrion
(Chappuis et al., 2005).
Although there are many species of trypanosome, several species cause important
veterinary diseases, and only two cause significant human diseases. In
sub-Saharan Africa, Trypanosoma brucei causes sleeping sickness, and in America,
Trypanosoma cruzi causes Chagas disease, transmission of both species can also
be via blood transfusion, contaminated needles, or the congenital route.
Rarely, transmission of T cruzi by breastfeeding or through contaminated food has
been reported (Barrett et al., 2003). On the other hand, cattle infections caused by T.
congolense and T. vivax are by far the most serious, both for frequency and for
economic influence (Flneile et al., 1983). Moreover, T. brucei is taxonomically
divided into three subspecies; largely based on their geographical origin, infectivity to
humans and severity of disease T. b. brucei, T. b. gambiense and T. b. rhodesiense.
T. b. brucei is distributed across sub-Saharan Africa, and is restricted to non-human
vertebrates, in which it can cause nagana, a chronic wasting disease (Hoare, 1972).
T. b. gambiense is restricted to West and Central Africa, where it causes a chronic
form of sleeping sickness in humans the Gambian form of sleeping sickness caused
by. T. b. gambiense, was traditionally viewed as primarily a human infection, but it
has become clear that a broad range of wild and domestic animal reservoirs also
harbor the parasite (Mehlitz et al., 1982; Cordon-Obra et al., 2009). T. b. rhodesiense
is a human infective subspecies and is found in eastern and southern Africa and
causes an acute form of sleeping sickness. T. b. rhodesiense is a zoonotic disease
for which non-human vertebrates are the primary reservoir (Hoare, 1972). Since T. b.
gambiense is less virulent than T. b. rhodesiense there is a widespread belief that T.
b. gambiense is evolutionarily older than T. b. rhodesiense and T. b. brucei based on
the hypothesis that parasites generally evolve towards becoming more benign as
they adapt to their host, an assumption that is not necessarily supported by evidence
(Bull, 1994; Ebert et al., 1996).
Besides this, another hypothesis is that T. b. rhodesiense may evolve through
frequent genetic exchange with sympatric T. b. brucei, leading to a mosaic of
different T. b. rhodesiense genotypes distributed throughout endemic regions of
eastern Africa (Komba et al., 1997; Gibson et al., 2002). Laboratory studies have
demonstrated that T. brucei is capable of sexual reproduction (Jenni et al., 1986)
and that crosses between T. b. brucei and T. b. rhodesiense can produce viable
progeny (Gibson, 1985). Although, T. b. gambiense and T. b. rhodesiense shares
causative agents of human African trypanosomiasis (Simarro et al., 2011a). In vitro
tests, in which trypanosomes are incubated with human blood or serum (e.g.
blood-incubation- infectivity test (Rickman and Robson, 1970) or human-serum-resistance
test (Jenni and Brun., 1980) are based on the trypanosome lytic factors (TLFs)
present in human blood, which can lyse T. b.brucei but not T.b.rhodesiense (due to
the presence of human-serum-resistance-associated (SRA) ) or T.brucei.gambiense
(Raper et al., 2001). Surprisingly, African trypanosomes have more than one
mechanism of human-serum resistance, because SRA was not detectable in T. b.
gambiense by analysis of mRNA or DNA (Wellburn et al., 2001) Attempts to
discover the corresponding mechanism in T.b.gambiense have not yet fully
succeeded, although similar approaches to that used to discover the SRA gene in
T.b.rhodesiense have been tried (Berberof et al., 2001). However, Berberof et al.
(2001) have reported a gene which is absolutely specific to T. b. gambiense, termed
as T. gambiense-specific glycoprotein (TgsGP). In contrast to SRA, TgsGP cannot
confer normal human serum, progressive deletion of the TgsGP sub-telomeric
region revealed that TgsGP is necessary for resistance to normal human serum
(Uzureau et al., 2013). Genetic analysis indicated that T. b. brucei is closely related
to T. b. rhodesiense. The hypothesis of a common ancestor for both T. b.
rhodesiense and T. b. brucei was mentioned (Gibson et al., 1999).
T. b. gambiense (chronic) is responsible for 95% of the current cases of HAT
(WHO, 2012). Rhodesiense HAT has epidemic potential in humans, as it has been
responsible for large outbreaks in the past (Köerner et al., 1995; Hide, 1999). As
between 1900 and 1915 T. b. rhodesiense recorded the largest epidemic killed
more than 250 000 people over 15 years (Langlands, 1999). Due to different
factors, the geographical gap between the two forms has been reducing in
the Democratic Republic of Congo, and in the future, an overlap of the two forms
could occur (Piccozzi et al., 2005). The three subspecies share all the
morphological features, which make the diagnosis and identification harder. Also
these taxonomic criteria have some gaps, for instance it is clear that both T. b.
gambiense and T. b. rhodesiense have animal reservoir hosts, thus by implication
an isolate from animal is not necessarily non-human infective (Hide, 1999).
T.b. gambiense is fatal which may lead to death if left untreated. In addition, it is
found as two stages; first stage and second stage. First stage starts from the bite of
testse fly which characterized chronic and intermittent fever, headache, pruritus,
lymphadenopathy and, to a lesser extent, hepato-splenomegaly. Whereas, in the
second stage is characterized by sleeping disturbances, neuro-psychiatric disorders
and the rare presence of fever. Neurological symptoms in second stage is described
by tremor, fasciculation, general motor weakness, paralysis of an extremity,
hemiparesis, akinesia and abnormal movements such as dyskinesia or
choreoathetosi (Kennedy, 2006).
1.3 Life cycle of T. brucei
Trypanosome life cycles can be considered relatively complex, and can be divided
into two events in the tsetse fly and inside the mammalian (figure 1-1) (Vickerman,
1985; Dyer et al., 2013). Firstly, the life cycle of the trypanosome inside the
mammalian host; the life-cycle begins when the tsetse fly injects the metacyclic
forms into the mammalian host, and then starts the adaption phase adapted for life
in the bloodstream inside a tsetse. The metacyclic form is morphologically
characterized including differentiating and proliferating into; long, slender
bloodstream forms known as trypomastigote forms (infective form) (Vickerman,
the variant surface glycoprotein (VSG) coat that will protect the parasite in order to
survive in the host. (Despommier et al., 2005; MacGregor et al., 2010). Then the
blood form can enter into different body fluids, such as lymph and cerebrospinal fluid,
and can also enter the placenta (WHO, 2013). From the fluids the parasite will
migrate to the organs particularly the brain and central nervous system (CNS).
T. b. rhodesiense establishes itself within the CNS within a few weeks (Odiit et al.,
1997) while T. b. gambiense takes an average of 300–500 days to manifest in the
CNS (Checchi et al., 2008a).
On the other hand, events occurring inside the vector begins when the tsetse fly
takes a blood meal and the parasites are in bloodstream trypomastigote forms, then
they migrate to the midgut. Next, once they arrive to the midgut, trypomastigote
forms start to differentiate, via the oesophagus, proboscis, and hypopharynx they
migrate to the salivary gland, where they are able to multiply and some of them can
transform into infectious metacyclic forms (Sharma et al., 2009). During this
migration from the midgut to the salivary glands, the parasite population size
experiences a pronounced reduction (Oberle et al., 2010). The whole cycle in the
vector takes 18–35 days, and once infected, a tsetse fly remains so for the rest of its
lifespan (Vickerman et al., 2003).
1
Figure 1-1. The life cycle of T. brucei in the vector and in the host; numbers represent the number of stages in order
1.4 Transmission cycle
According to (WHO, 2013) HAT has two forms of transmission according to the
form of the disease whether it is chronic that caused by T. b. gambiense, or it
is acute form, caused by T. b. rhodesiene. Gambiense HAT is an infectious
disease that involves a minor role for animal reservoirs, while Rhodesiense
HAT is a zoonotic disease, affecting mainly animals; humans are only
accidental hosts (Franco et al., 2014a). Although, the tsetse fly has a considerably
low capability as vector for gambiense HAT, also the amount of parasitemias in
transmission cycle (Robays et al., 2004). However, rarely animals can play role
in transmission of Gambiense HAT. As Njiokou et al., 2010 described that
T.b.gambiense was found in domestic and wild animals, shows the transmission
cycle of the T. b. gambiense. Some studies show that experimental infections of
animals with T. b. gambiense are limited in time, always lasting less than 1 year
(Schütt et al., 1981). Therefore, more data are needed to clarify the role played by
the animal reservoir in maintaining gambiense transmission when the prevalence
of human infection is low and elimination is envisaged.
On the other hand, domestic and wild animals play a major role in T. b. rhodesiense
sleeping sickness transmission cycle. Intensified man to man transmission occurs
during epidemic. The strong zoonotic character of the T. b. rhodesiense form of the
disease considerably complicates surveillance and control issues, requiring action on
the fly or on the animals hosting the parasite.
1.5 The vector- Tsetse fly
Tsetse fly (Glossina spp.) is the only known biological vector of human
trypanosomiasis. It can be described as brown in colour with an extended snout, the fly
ranges from one-quarter to two-thirds inches (0.6 to 1.7 cm) long, the smaller
varieties being slightly larger than a housefly. Of the 30 known living tsetse species,
only eleven are of positive or possible epidemiological importance as trypanosome
vector (Knight, 1971). Tsetse flies are subdivided into three subgenera based on
morphological differences in the structure of the genitalia: Morsitans (Glossina),
Palpalis (Nemorhina), and Fusca (Austenina) groups (Despommier et al., 2005).
Tsetse flies are geographically restricted to sub-Saharan Africa, between the latitudes
of 14°N and 29°S, south of the Sahel desert, and north of the Namibian and Kalahari
deserts (Figure 1-2) (Fèvre et al., 2006). Some pockets of G. morsitans and G.fuscipes
have been reported in south western Saudi Arabia (Elsen et al., 1991). All the species
of tsetse flies are potentially cyclical vectors of trypanosomes, but in nature the
infection is carried almost exclusively by G. fuscipes, G. palpalis, and G. morsitans
[image:23.596.82.514.179.645.2](Franco et al., 2014a).
Figure 1-2. The distribution of T. b. gambiense (highlighted in yellow) and T. b. rhodesiense (highlighted in blue) and subgenera of tsetse fly in Africa
Source: Atlas of Human Infectious Diseases (2012)
Recently the full genome of Glossina morsitans has been fully sequenced (Attardo et
understanding the pathways of transmission particularly those which occur in the
tsetse fly saliva. As the authors have reported a family of genes, the tsal genes, which
are particularly active in the salivary glands of the tsetse fly. This allows the tsetse fly
to counteract the responses from the host to stop bloodfeeding. This finding and
several others could be useful in developing new tools that could reduce or even
eradicate tsetse flies.
1.6 Epidemiology African sleeping sickness
The first reported isolation of T. b. rhodesiense from a sleeping sickness patient was
in 1908 (Hide, 1999). On the other hand, T. b. gambiense HAT at the turn of the
twentieth century (1896– 1906), is estimated to have killed 800 000 people in
equatorial Africa. The disease (HAT) resurged in the 1920s, threatening both West
and Central Africa; the T. b. rhodesiense outbreak lasted for a decade in some
localized areas and for much longer in larger countries. The epidemics are raging in
the worn- torn areas of southern Sudan, northern Uganda, the Democratic Republic
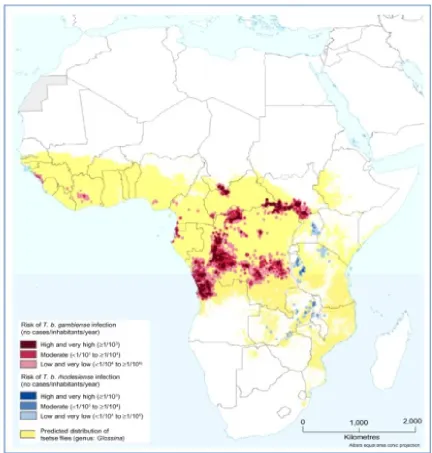
of Congo, and Angola (Hide, 1999). (Figure 1-3) shows the distribution of HAT across
Africa reported in 2013.
Figure 1-3. The number of HAT (T.b.gambiense and T.b.rhodesiense ) cases and the geographical distribution in 2013.
Source: http://www.who.int/mediacentre/factsheets/fs259/en/ (Accessed on 20/12/14).
According to figure (1-3), out of the known 36 endemic countries, over 90% of the
cases were reported from Angola, Democratic Republic of Congo, southern Sudan
and Uganda. Thus, T. b. gambiense trypanosomiasis is considered one of the major
public health problems in Central Africa, especially in the Democratic Republic of
Congo (DRC), Angola and southern Sudan, where ongoing civil wars have negative
effect on the control efforts to such an extent that national statistics give only a very
incomplete view of the problem. Better information is available in DRC, the total
number of people at risk is estimated by the national control programme to be
12,500,000. The WHO Expert Committee on HAT control and surveillance in 1995
estimated that the true prevalence of gambiense HAT was 300 000 cases. The
to more than 27,000 in 1998 in DRC. About 2% of DRC’s population carries
the disease, with prevalence in some communities reaching 70% (Barrett,
1999).
Moreover, Angola is considered as the second highest incidence of HAT;
respectively 8275 and 6610 new cases were reported in 1997 and 1998 by the national
control programme. The disease is endemic in the north-west provinces, the
prevalence rates reported vary between 1.3% and 9.7% (Barrett, 1999).
From 1997-2006 24 countries out of the 36 endemic countries showed greatest
burden of the disease due to T.b.gambiense (WHO, 2006). In 2006 11 out of these 24
countries have reported no cases (Wellburn and Maudlin, 2012). These data,
especially for T.b. gambiense, illustrate an encouraging trend for countries where
concerted efforts have been mounted (mainly Angola, DRC, and Sudan) to control
HAT and the decrease in incidence in recent years is due in large part to enormous
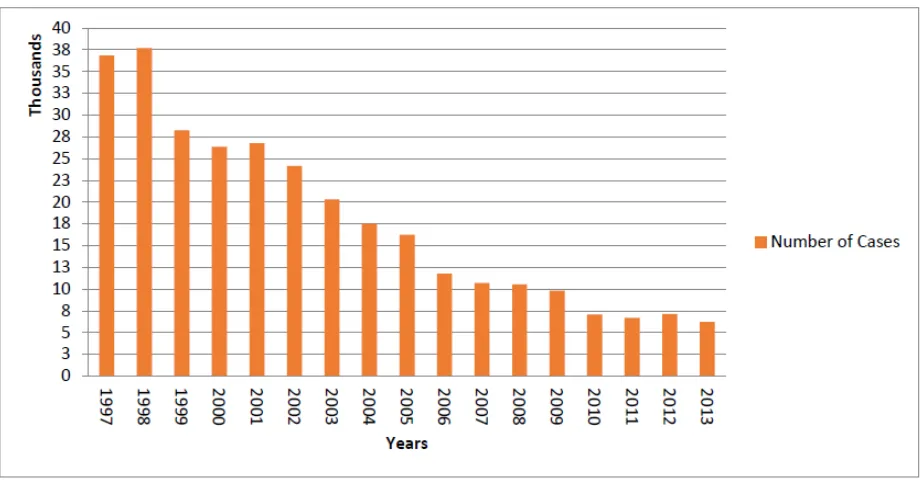
efforts involving active case detection (Fèvre et al., 2008). (Figure1-4) illustrate the
number of HAT cases reported from 1997 to 2013.
Figure 1-4. The number of cases of HAT reported from 1997-2013
(Simarro et al., 2011; WHO, 2013)
Furthermore, Uganda is the only country where both sub-species are found as they
are currently less than 100 km apart T. b. gambiense in the north –west and T.
b. rhodesiense in the south-east. Between 1000 and 1200 T .b. gambiense cases
were reported annually in 1995-2000. Whereas, T. b. rhodesiense cases it is less than
T .b. gambiense, only 271 cases were reported in 1997. In addition, a major
epidemic of Rhodesian HAT devastated south-east Uganda from the mid-1970s, with a
cumulative total of about 40,000 new cases for 15 years (Pépin and Méda, 2001).
Picozzi et al., (2005) have screened 231 blood samples were collected from the
central Uganda (2001-2005) and 91 from northeast of Uganda (2003). The screening
was carried based on the detection of SRA andTgsGP genes. The authors have
reported that all the samples from central Uganda are classified as T.b.rhodesiense,
where as all the samples from northeast Uganda are classified as T.b.gambiense
Moreover, in Sudan where reliable statistics are not available, the foci of T. b.
Nile, within 100 kilometres of the borders with Central African Republic (CAR), the
DRC and Uganda. Extrapolations suggest that there must be at least a few thousand
cases per year. In other countries of Central Africa, HAT is more or less an emerging
public health problem (Franco et al., 2014a).
The increase of gambiense HAT cases in the first third of the 20th century, which
reached, in some cases, epidemic levels, generated a response from colonial
governments that were initially based on the application of vector control measures,
and later on the deployment of mobile teams that visited the villages in the at-risk areas
to conduct systematic screening of the entire population and to treat the detected
cases (Ekwanzala et al., 1996; Moore and Richer, 2001).
The trend in cases reported of gambiense HAT showed a decrease in the reported
cases of the disease of 76% since 2000, with a number of around 7,000 cases
reported in the last 3 years (WHO, 2013). Between 2000 and 2009, the annual case
detection rate decreased by 63% at the same time as geographical and population
coverage by active screening increased (Simarro et al., 2011a). This promising result
continued in 2010 and 2011. In 2011, the number of new cases reported to WHO
was 6631 (Simarro et al., 2013). The Democratic Republic of the Congo currently
bears most of the disease burden. Nevertheless, HAT mainly affects remote rural
communities where the health infrastructure is basic; furthermore, there are other
endemic areas where accessibility is complicated because of security problems or
topography constraints. Therefore, a certain number of cases are not recognized and
diagnosed (Simarro et al., 2011a) despite the fact that epidemiological knowledge
about the disease has improved considerably in the past decade there is still a gap
between the number of cases declared and the number of actual cases.
Elsewhere in East and Southern Africa, the incidence of T. b. rhodesiense
trypanosomiasis remains low. In West Africa, the disease has regressed or
disappeared from several countries as ecological changes reduced the intensity of
man-fly contact (Pépin and Méda, 2001). Reporting from most countries endemic T . b.
rhodesiense trypanosomiasis is fairly irregular, as the disease is not regarded as
priority. For instance Tanzania report between 200 and 400 cases per year, and there
are several foci throughout the country. Additionally, lower figures are reported in
Zambia and in Kenya, where the disease is seen essentially near the Ugandan border,
in contrast fewer than 20 cases per year are reported in Rwanda, Mozambique, Malawi,
Furthermore, trypanosomiasis is not found equally in males and females, in some foci
the incidence and prevalence is higher in males if the tsetse population is denser in
areas of typically male activities (Pépin and Méda, 2001). Females often participate
more regularly in case-finding sessions, which can lead to a higher number of cases
(WHO, 2001). Which may causes a misleading if the estimation was only by the
number of cases (Pépin and Méda, 2001).
On the other hand, children under the age of 10 years usually have a three to five folds
lower incidence than adults, and the reason is the differential exposure, as tsetse
populations are often more abundant in fishing and farming sites than in the villages.
Furthermore, individuals over 50 to 60 years of age are less risk to trypanosomiasis,
than in middle-aged adults. Occupation is also related to exposure and to incidence,
for example in Côte d’Ivoire HAT is more frequent in coffee and cocoa plantation
workers or in people who fetch water than in other inhabitants. Nearly 80% of cases
occur in people who not only work but live in small plantation settlements; a case
control study showed that such people were five times more likely to develop
trypanosomiasis, than their counterpart who lived in villages (Pépin and Méda, 2001).
1.6.1 Sleeping sickness in Angola
The total population of Angola is about 24 million (World Bank, 2014) Since gaining
independence in 1975, Angola has seen a cruel civil war, which over nearly 30 years,
has devastated the country, destroyed the infrastructure and left a severely
traumatized population (Abel et al., 2004). Daily conditions of life throughout the
country and specifically Luanda (population approximately 6 million) mirror the
collapse of administrative infrastructure as well as many social institutions. Attempts
were made by the United Nations (UN) to promote a process of peace and
reconciliation failed (United Nations Department of Public Information 1995), and only
after the death of the UNITA opposition leader Jonas Savimbi in February 2002, has
raised a new glimpse of hope. The peace agreement signed on 4 April 2002 between
the Angolan government and UNITA, which have initiated a new era of stability and
progress for the country (Abel et al., 2004). Since the adoption of a new constitution
in 2010, the politics of Angola takes place in a framework of a presidential republic,
whereby the President of Angola is both head of state and head of government, and
of a multi-party system. Executive power is exercised by the government. Legislative
power is vested in the President, the government and parliament. The health system
has witnessed signs of improvements (constitution net [online]).
Moreover, HAT was first considered as a health problem in Angola in 1871. The first
reported case of HAT in Angola was in the
Quicama municipality province (Janssens, 1996). However, it took several decades
for the fight against the disease to be systematically organized. By 1926, the
Portuguese colonial government had created the first specialized unit for HAT control.
In 1949, the first mobile team was formed to screen the population in the affected
areas. Less than 10 years later, nearly the whole population in the endemic zones
was under constant surveillance. At the same time, antitrypanosomal treatment
became available (Abel et al., 2004). In 1974, a year before the independence, only
three cases were reported the entire country (Stanghellini and Josenando, 2001).
Subsequently, due to the civil war the number of population screening fell
dramatically. The level of professional performance of health workers declined
constantly, as the activities of nursing schools and regular training programmes for
laboratory technicians gradually came to a standstill. As a result, HAT returned to
Angola in a devastating dimension, as the number of cases have risen from 3 in 1974
combining the two words Angola and trypanosomiasis. As part of Caritas de Angola,
ANGOTRIP could make use of the widespread and sustainable infrastructure of the
Catholic Church, which was of great advantage even during highly volatile periods,
when the UN and international NGOs were no longer able to reach the local
population. However, it did not have a major impact on reducing the reported number
of cases, as the number of cases has increased dramatically to 6610 in 1998
(Stanghellini and Josenando, 2001).
Since 2001 in Angola, 80% of patients have been found to be in the
meningoencephalitic stage of the disease (Truc et al., 2012). Moreover, in 2001,
during a resurgence of the infection, WHO and partners established a public–
private partnership to bring the disease under control. This was effective within a
short time, in terms of reducing the number of reported cases of HAT (Figure 1-4).
Angola was not an exception as the number of cases fell to 4577 (WHO, 2013).
Also, in 2004, therefore, the World Health Assembly passed a resolution
(WHA57.2) to enhance control in order to move towards elimination. In 2011, in
view of the 70% decrease in the number of cases reported to WHO in the previous
decade. The resolution could be considered as a huge relief for Angolans as the
number of reported cases kept falling. Finally, The Atlas was initiated in 2007 as a
collaborative project between WHO and the Food and Agriculture Organization of
the United Nations (FAO) in the framework of the programme against African
trypanosomiasis. The Atlas is an excellent basis for monitoring changes in
distribution and epidemiology and for using spatial analytical methods to estimate
the size and location of populations at risk (WHO, 2013). Again Angola has majorly
benefited from this project as the number of cases has decreased since the number
of reported cases has fallen noticeably to 517 cases in 2008 (WHO, 2013).In the
Democratic Republic of the Congo, 5.5% from the Central African Republic, 4%
from Chad, 3.5% from South Sudan, 2% from Angola, and the remaining 3% from
another five countries (Cameroon, Congo, Cote d’Ivoire, Equatorial Guinea, Gabon
(Franco et al., 2014a). The current trends of the number of cases has shown
promising signs of controlling the disease in Angola since fewer than 100 cases
have been reported per year in Angola (Table 1-1). (WHO, 2015)
Country 2004 2005 2006 2007 2008 2009 2010 2011 2012 2013
Angola 2280 1727 1105 648 517 247 211 154 70 69
Table 1-1. The number of cases reported of T. b. gambiense sleeping sickness between 2004 and 2013 in Angola(Simarro et al., 2008; WHO, 2013).
Moreover, Angola (northwest region) is considered as high intensity transmission
country along with Chad (southern region); the Central African Republic (Northwestern
and Southeastern regions), Equatorial Guinea (Southwestern region), Gabon
(Northwestern region), Congo (central and Southern regions), the Democratic Republic
of the Congo (in Northern, Northwestern, central, and Eastern parts), South Sudan
(Southwestern region), and Uganda (Northwestern region) (Simmaro et al., 2013).
There are three subgenus of tsetse fly responsible for transmitting HAT which are; G.
Figure 1-5. Geographical locations of tsetse fly sub-species in Angola, the circle highlights the provinces which are endemic for HAT. (Stanghellini & Josenando, 2001) and (Truc et al., 2011)
Angola is divided into 18 provinces (see Figure1-5). The chronic form of HAT, caused
by T.b.gambiense, occurs in seven of the 14 provinces where tsetse flies are present
(in Bengo, Cuanza Norte, Uige, Cuanza Sul, Zaire, Malange, and the periphery of
Luanda). The acute form of the disease, caused by T. b. rhodesiense transmitted by
Glossina morsitans centralis, could once be found in the southern province of
Cuando Cubango (where 30% of new Angolan HAT cases were diagnosed between
1964 and 1974; Josenando, unpubl. obs.) (Truc et al., 2011).
1.6.2 Current situation of HAT
Although the current situation of the reported gambiense HAT number of cases is
promising, but it should be observed with some caution. The infection affects
mainly remote rural communities, where the health infrastructure is basic, and
cases may be unrecognized or unreported. Some of the known active foci are
difficult to access because they are insecure or the topography is challenging.
When active case detection is conducted in previously inaccessible or neglected
foci, gambiense HAT can be found, often at a substantial prevalence (Chappuis et
al., 2010). Despite these gaps, knowledge of the current epidemiological situation
has improved considerably in the past decade. In 1995, the gap between the
numbers of reported and actual cases was estimated to be factor of 12(WHO,
1998) by 2006 the number has decreased to factor of three(Weekly
Epidemiological Record, 2006). Despite these achievements, much effort is still
required to gather more accurate data on HAT in order that its designation as a
Neglected Tropical Disease may be eliminated (Fèvre et al, 2008). Out of 36
countries listed as endemic, only 30 have received the exclusive support of WHO
including assessing the epidemiological status of HAT or to establish control and
surveillance activities, the 6 countries which have not received WHO support are;
Botswana, Burundi, Ethiopia, Gambia, Namibia and Niger. (WHO, 2013). The
support of WHO was given as; firstly technical assistance, which given by WHO
staff. Secondly, provide the patients easy access to diagnosis; this is can be given
by providing the equipment, reagents, logistics, and funds which will allow the
national teams to reach HAT transmission areas to perform active case-finding
surveys and set up passive surveillance. Also, WHO gave support in form of
Furthermore, between 2000 and 2010, 94 HAT cases were diagnosed in 19 non-
endemic countries, of which 72% were due to T. b. rhodesiense: of them, 82% were
diagnosed at the first stage. For comparison, among 26 cases of T. b. gambiense
HAT cases, 77% were diagnosed at the second stage (Simarro et al., 2011b).
As for gambiense HAT, current trends in the number of cases reported by countries
endemic for rhodesiense HAT are encouraging. Although, is difficult to make firm
predictions about changes in the incidence of rhodesiense HAT. As long as
reservoirs and environments for transmission exist, there will be a risk, and
unpredictable ecological or social changes may result in extensive transmission
(WHO, 2013).
http://apps.who.int/iris/bitstream/10665/95732/1/9789241209847_eng.pdf). Finally, WHO have designed a road map to eliminate gambiense HAT by 2020,
Elimination as a public health problem is defined as less than 1 new case per 10
000 inhabitants in at least 90% of foci, with fewer than 2000 cases reported
annually at continental level. The 2020 goal is an intermediate step. The final goal,
in accordance with the recommendations of the Neglected Tropical Disease (NTD),
is to interrupt transmission of gambiense-HAT by 2030 (WHO, 2012).
In term of disease transmission risk, the risk is only limited to the foci of the disease
and cannot be generalized on a national or continental scale. Based on new
longitudinal analysis of the data included in the WHO Atlas of HAT and global
population distribution layers, the extension and the location of different levels of risk
has been estimated. Hence, it has been estimated that~70 million people live at
different levels of risk for HAT infection. In addition to 57 million (81%) people
distributed over an area of approximately 1.38 million km2 are at risk of gambiense
HAT; this population is distributed in 14 of the 24 countries listed as endemic for
gambiense HAT. Moreover, 12.3 million people are at risk of contracting
rhodesiense HAT, and they are distributed over an area of 0.171 million km2
(Simarro et al., 2012). More than 5 million people live in areas classified as high or
very high risk for contracting HAT. The Democratic Republic of the Congo has the
greatest number of people at risk (36 million) for HAT and the largest risk area
[image:37.596.80.512.229.682.2](790,000 km2) (Simarro et al., 2012) (Figure 1-6).
Figure 1-6. Population at risk of HAT in Africa
(Franco et al., 2014).
important role in meeting the “road map” set by WHO. The symptoms of the early
stage of HAT including headaches, fever, fatigue and joint pain cannot considered as
a definitive indicators of trypanosome infection, thus HAT is often mistakenly
identified as other diseases such as influenza or malaria (Odiit et al, 2004)). Also,
since the available drugs to treat sleeping sickness are either toxic or cumbersome
to administer, and because symptoms are generally not specific enough to start
treatment (Debaorggraeve and Büscher, 2010). The classical diagnosis of human
African trypanosomiasis (HAT) is a 3-step approach: identification of suspects,
parasitological confirmation, and disease staging. For the diagnosis of T. b.
gambiense infection, relatively simple, reliable antibody tests can be used for
screening (WHO, 2013). Most tests for detecting antibodies of T. b. gambiense
contain selected VSGs of variable antigen types LiTat 1.3 and 1.5. Despite the
abundance of VSG genes, most patients with T. b. gambiense infection appear to
carry antibodies in their blood that react with at least one of the two VSGs.
For the diagnosis of T. b. gambiense infection, a rapid agglutination test is available
that can be used in mass screening. Individual rapid diagnostic tests have also been
developed, which are more appropriate for passive screening and are under
evaluation. Tests based on immunofluorescence and enzyme-linked immunosorbent
assays (ELISAs) are more appropriate for laboratory testing (WHO, 2013). The
immune trypanolysis test is considered to be for use in reference laboratories.
Serological tests detect antibodies only 3–4 weeks after infection, which may be one
of the reasons for false-negative reactions. Cross-reactivity with other parasitoses
may occur, particularly in whole blood or at low serum or plasma dilutions. In some
rapid diagnostic tests for HIV and malaria, cross-reactions with HAT blood
specimens may occur, decreasing the specificity of those tests (4, 5).
1.7.1 Parasitological Diagnosis
Microscopy is considered as the most widely used and simplest of diagnostic
techniques and relies on direct observation (identification stage) of the parasites
either in blood, lymph or cerebrospinal fluid. Although being widely used, these
techniques are not considered sensitive enough to detect low parasite levels,
especially in chronic cases (Luckins, 1992). The sensitivity of the microscopy
examination can be increased; with haematocrit centrifugation technique (HCT)
developed by Woo (1970) using centrifugation of microhaematocrit capillary tubes
containing the blood sample and examination of the buffy coat/plasma junction under
the microscope. In a positive diagnosis, trypanosomes are found wriggling at the
junction of the buffy layer and the plasma (Woo, 1970), with an estimated detection
threshold of 500 trypanosomes/ml (Chappuis et al., 2005).
1.7.2 Card Agglutination Test for Trypanosomiasis
The card agglutination test for trypanosomiasis (CATT) is a rapid, simple assay for
the detection of specific antibodies in patients with gambiense HAT (Magnus et al.,
1978). Because of its simplicity, reliability and low cost, it is used in all control
programmes for serological screening of populations at risk for T. b. gambiense
(WHO, 2013).
The antigens originate from particular variable antigen types (VATs) of T. b.
gambiense that are highly conserved across the range of this species and they are
expressed early with infection. Therefore, the majority of infected individuals develop
antibodies that cause visible agglutination when whole blood or serum is mixed with
the antigen on the card (Eisler et al., 2004). The CATT antigen consists of complete
bloodstream forms of T. b. gambiense variable antigen type LiTat 1.3. To prepare
control sera and materials for performing the test on whole blood (capillary tubes,
test cards, stirring rods, suction bulbs, syringe and droppers) (WHO, 2013).The
specificity of the test for T. b. gambiense varies between 87% and 98%, with an
average of 95% (Robays et al., 2004). Despite a specificity of about 97%, the
positive predictive value remains limited when the test is used for mass screening in
populations in which the overall prevalence of gambiense HAT is low (Checchi et al.,
2011). On the other hand, False-negative CATT results may be obtained for patients
infected with strains of trypanosomes that do not express the LiTat 1.3 gene,
resulting in lower sensitivity of CATT in some endemic areas (Dukes et al., 1992).
False-negative CATT results in the presence of high antibody concentrations may
also be found because of prozone (disequilibrium between the relative amounts of
antibody and antigen) when undiluted blood, plasma or serum dilutions below 1/4
are tested (WHO, 2013).
However, decisions to treat should not be made when only CATT on undiluted blood
is positive and parasite tests are negative. CATT titration on diluted blood, serum or
plasma is imperative. Taking into account the disease prevalence and the feasibility
of maintaining control activities, a cut-off point should be selected from a preceding
study on serological characteristics in the area (Simarro et al., 1999).
Simarro et al. (1991) have previously reported a sera from 124 parasitologically
confirmed individuals from the same focus that yielded a positive
CATT/T.b.gambiense in 120 individuals (97%)and the end titre point was
determined optimal at 1/8.. The authors suggested on the basis of these results,
non-parasitologically confirmed CATT-positives should be divided into three groups:
individuals with an end titre of 1/4 were considered not infected and were not
followed-up; those with end-titres of 1/4 or 1/8 were suspected of trypanosomiasis
and were included in group A for follow-up andindividuals with end titres above 1/8
were strongly suspected of trypanosomiasis and were included in group B for
follow-up. However, according to a CATT/T.b.gambiense study on 4753 individuals from
the focus of Quiçama (Angola), it was concluded that the treatment should be given
to all cases with an end titre > 1/8 even without parasitological confirmation, but
always after lumbar puncture for staging and selection of the appropriate drug
(Simarro et al, 1999). It should be kept in mind that some individuals could be
treated unnecessarily, probablywith a not extremely toxic drug such as pentamidine,
but many trypanosomiasis patients who otherwise would not have been detected
would receive appropriate treatment.
The diagnostic method regarding the T. b. rhodesiense disease is different from that
for T. b. gambiense in several ways; first there is no involvement of serological
screening test for T. b. rhodesiense, the detection of suspected cases depends on
the non-specific clinical presentation and history of exposure. Second, since the
density of blood circulating parasites is higher than for T. b. gambiense
parasitological confirmation is easier for T. b. rhodesiense. A thin or thick blood
smear is usually sufficient to confirm diagnosis. Third, biological indicators such as
haemoglobin and platelet counts and coagulation tests are more frequently or
substantially changed in African trypanosomiasis caused by T. b. rhodesiense than
in that caused by T. b. gambiense, but these findings remain non-specific (Brun et
al., 2010).
1.7.3 Molecular Diagnosis
The identification and surveillance of infectious agents and in determining sources of
infection had a major boost by the involvement of molecular tools.
parasites with morphologically identical life cycle stages, include eggs or cysts, from
faecal samples, or when attempting to match different life cycle stages of the same
parasite from intermediate and definitive hosts (Crsione et al., 2005). For instance,
Thomson et al., 2011 have reported that in some endemic areas of hookworm,
human may be infected with more than one species. However, the identified eggs in
the faeces are morphologically identical.
Also, molecular tools play a major role in studying the epidemiology of infectious
agents (Traub et al., 2005). According to Dorman (1992) the molecular definition is
known as “a science that focuses on the contribution of potential genetic and
environmental risk factors, identified at molecular level, to the aetiology, distribution
and prevention of disease within families and cross populations”.
The most used tool is the polymerase chain reaction (PCR), which allows direct
examination of clinical or environmental isolates has had an enormous impact on the
genetic characterization, diagnosis and taxonomy of parasite (Lymbery and
Thompson, 2012). PCR is considered as a sensitive and specific method for the
detection and identification of human-infective trypanosomes .PCR also prevent the
need for laboratory amplification of parasite isolates, as it was the major obstacle in
characterising parasites refractory to in vitro culture (Lymbery and Thompson, 2012).
Defined gene sequences of infectious agents can be detected from small quantities
of material and the resultant data can be detected by PCR, which can be used not
only for diagnosis, but also to assess the effect of interventions on the population
structure of infectious agents, assessment of intra-species diversity, and
transmission studies (Lymbery and Thompson, 2012).
Furthermore, molecular tools play an important role in solving taxanomic issues that
resulted in controversy in the past, when new species or strains were described on
observations. Molecular applications function to solve such problems is can be
described in two stages; first different genetic groups are found within what is
ostensibly a single morphologically defined species, secondly these groups are
defined as taxonomic categories, either at intraspecifc level or as different species or
higher taxa (Lymbery and Thompson, 2012).
Moreover, the first development of PCR use in identification and detection of
trypanosome was first published in 1989 by Moser et al. (1989). They used PCR to
amplify a 188-base pair (bp) segment of the repetitive 195-bp nuclear DNA
sequence of T.cruzi that is the most abundant sequence in this organism.
Kouadio et al. (2014) compared between buffy coat technique (BCT) and species-
specific PCR to detect trypanosome species in 363 cattle samples from Côte
d’Ivoire; out of 363 cattle examined with BCT, 33 were found positive with all
trypanosome species accounting for an average of 9.09% prevalence whereas PCR
using species-specific primers showed that 81 out of 363 cattle were infected with
savanah type, T.vivax and T. brucei sl. accounted for 28.39%, 49.38% and 23.45%
of the infection rate respectively.
1.7.3.1 Genetic Markers
There are 11 different pathogenic trypanosomes in trypanosomiasis endemic regions
of Africa which are can be identified by molecular methods, and which relies on
species-specific markers (Njiru et al., 2005). In addition, the sensitivity and specificity
of a diagnostic PCR is largely related to DNA sequence targeted by the primers.
(Table 1-2 and Table 1-3) shows the number of markers designed for T.b.gambiense
and T.b.rhodesiense respectively. Satellite DNA markers has been a common target
used for detection and identification of Trypanosoma ( brucei spp., evansi and
equiperdum), the species vivax and simiae, and the three main Trypanosoma
congolense types (savannah, forest, and Kenya Coast) (Clausen et al., 1998). In the
case of satellite DNA one pair of primers is needed to detect each subgenus, species
or type, which leads to the processing of three to five different PCRs per sample.
Thus, many attempts were tried to carry out multiplex reactions, but the sensitivity
of the tests decreased and some combinations of primers induced the synthesis
of `non-specific (and non-expected) size products (Picozzi et al., 2008).
Thus, the conserved sequences which are unique for the target group that occurs in
multiple copies in the parasite genome, acts as templates in the diagnostic PCRs
(Debaorggraeve and Büscher, 2010). Several DNA sequences have been used for
the sensitive and specfic PCR-based detection of livestock trypanosome DNA in host
blood and/or in tsetse flies (Masiga et al., 1992). T. b. gambiense has been
characterized by another specific molecular marker, the T. b. gambiense TgsGP.
The sequence of the TgsGP which encodes a flagellar pocket glycoprotein, were
found to be diagnostic for T. b. gambiense only (Berberof et al., 2001). Primers
targeting this sequence were designed by Radwanska et al. (2002a) and were found
to be specific for the amplification of TgsGP of T. b. gambiense when tested against
non-T.b.gambiense populations revealing negative results. The detection limit of the
reaction was evaluated; it reached 1000 trypanosomes/ml of blood after a single
PCR.
Target Size of
amplified Products
Primer Sequences Ref
AnTat 11.17 VSG gene
653 bp AnTA: 5’-CAC AGA CGA CAG AAG CGA TA-3’
(Bromidge et al., 1993)
AnTB: 5’-GAA AGT GGG AGT TGT TGCTC-3’
Non conserved sequence of kDNA
930 bp MDF: 5’- CGC CCA TAA GAT TTC CGGTT-3’
(Mathieu-Daude et al.,
1994) MDR: 5’- GGT GTA ATA CTC
ACC CGGTT-3’
Non conserved sequence of kDNA
930 bp MDF: 5’- CGC CCA TAA GAT TTC CGGTT-3’
(Schares and Mehlitz, 1996) MDR: 5’- GGT GTA ATA CTC
ACC CGGTT-3’
MDN: 5’-CGA GGT ACT TCG AAA GGGTT-3’
TgsGP 308 bp Sense primers: 5’- GCT GCT GTG
TTCGGAGAGC-3’
(Radwanska et al., 2002a)
Anti-sense primers: 5’- GCC ATC GTG CTTGCC GCT C-3’
Table 1-2. The primers developed for use in T. b. gambiense molecular diagnosis
On the other hand, Moser et al. (1989) reported that T. b. rhodesiense universal
primers that are used to prime the amplification of 177 bp sequences from
Trypanozoon genomic DNA, are able to detect 0.1 pg of parasite DNA, this is about