UK
Eadie, R and Perera, SC
Title
The state of construction eBusiness in the UK
Authors
Eadie, R and Perera, SC
Type
Monograph
URL
This version is available at: http://usir.salford.ac.uk/39948/
Published Date
2016
USIR is a digital collection of the research output of the University of Salford. Where copyright
permits, full text material held in the repository is made freely available online and can be read,
downloaded and copied for noncommercial private study or research purposes. Please check the
manuscript for any further copyright restrictions.
e-Business in the UK
Dr Robert Eadie
School of the Built Environment, University of Ulster, United Kingdom
Professor Srinath Perera
Authors: Dr Robert Eadie and Professor Srinath Perera
Dr Robert Eadie ([email protected])
Dr Robert Eadie is Course Director for the MEng/BEng (Hons) Civil Engineering courses at Ulster University. His PhD was related to e-procurement in construction, and his research focuses on procurement and pedagogy. He spent 20 years in industry before moving into academia. A Fellow of Engineers Ireland, he is currently Northern Region Secretary and is on the Professional College of CIGNI. He is a Chartered Northern Ireland Committee Member of CIHT.
Professor Srinath Perera ([email protected])
Professor Srinath Perera holds a personal chair in Construction Economics at the Faculty of Engineering and Environment, Northumbria University. He is a coordinator of the CIB TG83 Task Group, e-business in Construction. He is a chartered Quantity Surveyor and Project Manager and a member of the Royal Institution of Chartered Surveyors (RICS) and the Australian Institute of Quantity Surveyors (AIQS). He has over 100 peer reviewed publications and is co-author of Cost Studies of Buildings 6th edition.
International Council for Building (CIB) Task Group TG83: e-business in Construction
www.construction-ebusiness.org
The TG83 is an international collaboration forum established to generate a programme of actions directed at identifying best practice and promoting e-business in construction. It was established in March 2011 with the objectives of conducting joint research with interested parties, to appraise and promote the use of web-based technologies for collaboration and e-business in construction, and to provide a forum for discussion, debate and the evaluation of technologies, research and concepts in the area. This survey and the report have been produced as a key output of TG83 in association with Construct IT for Business.
Construct IT for Business
www.salford.ac.uk/construct-it
Construct IT for Business is an industry-led not-for-profit collaborative membership-based network, comprising leading edge organisations representative of the construction industry supply chain in addition to professional institutes and R&D/academic institutions. Its aim is to improve industry performance through the innovative application of IT and act as a catalyst for academic and industrial collaboration.
The mission of Construct IT is “to be
an effective enabling and co-ordinating force (agent) in the application of IT within
the construction process as a contribution to innovation and the development of best
practice”.
The State of Construction
e-Business in the UK
TG83: e-Business in Construction
2 | P a g e
Contents
1.0 Background ... 4
2.0 Purpose of the study ... 4
3.0 The Questionnaire Survey ... 5
3.1 Overall Method ... 5
3.2 Survey Method and Composition ... 5
3.2.1 Respondent Profile ... 6
4.0 Questionnaire Survey Results ... 10
4.1 e-Business in your organisation ... 10
4.1.1 e-Business activities ... 10
4.1.2 Communications Network... 14
4.1.2.1. Network communication type ... 14
4.1.2.2. Internal and External Communication Levels ... 15
4.1.3 Level of e-business usage ... 16
4.2 IT investment advice and e-Skills development ... 17
4.2.1. IT investment advice ... 17
4.2.2 IT expenditure ... 17
4.2.3 e-Skill Development ... 18
4.3 Drivers, Impact and Barriers of e-Business ... 18
4.3.1 Drivers for implementing e-Business ... 18
4.3.2 Impact identified for e-business implementation ... 19
4.3.3 Barriers to e-Business implementation ... 20
4.4 Improvement of e-Business ... 21
4.4.1 Internal resources ... 21
4.4.2 Business process ... 21
4.4.3 Organisational culture ... 22
4.4.4 Business Goals ... 22
4.5 Future of e-Business in your organisation ... 22
4.5.1 Future investment in e-Business ... 23
4.5.2 Launch of e-Business policy... 23
5.0 Summary and Key Findings ... 23
6.0 Way Forward ... 24
7.0 References ... 25
Contents
The TG83 is an international collaboration forum established under the auspices of International Council for Building (CIB) to generate a programme of actions directed at identifying best practice and promoting e-business in construction. The primary objectives of TG83 are:
to conduct joint research with interested parties
appraise and promote the use of state of the art web-based technologies for collaboration and e-business in construction
provide a forum for discussion, debate and evaluation of technologies, research and concepts in the area.
TG83: e-Business in Construction
1.0 Background
3
The UK Construction industry hasgradu-ally ebbed out of the great recession which started in 2008. Output from the construction sector in the UK in 2015 currently sits at around the 2005 level in real terms (Rhodes, 2015). However, its direct
contribution to the GDP (over 6.5%) makes it a key sector in the national economy (DBIS, 2013). This is due to its size: the contracting sector is responsible for 2 million jobs, the services sector for 580,000 jobs and the products sector for another 310,000 jobs (DBIS, 2013). ONS (2015) states that compared with April 2014, output in April 2015 in the construction industry increased by 1.5%, resulting in positive growth for the 23rd consecutive month year-on-year. Despite this growth within the construction industry, little work has been carried out to determine the current level of Information and Communication Technology (ICT) / e-Business penetration within the sector.
ICT often infuses innovation into the way that the Construction industry functions. This report defines construction
e-Business as ICT lead innovations and adoption of ICT within business processes utilised in the construction industry (Ashworth & Perera, 2015). Researchers have shown it provides a more efficient means of project delivery (Cordella and Tempini, 2015; Ashworth & Perera, 2015). In addition to producing a leaner work flow in construction, technology has also provided increased and faster
communication through the implementa-tion of Building Informaimplementa-tion Modelling (BIM), cloud based applications, internet solutions and other ICT systems (Alwan et al, 2015). This has led to a greater awareness of the importance of ICT in the construction industry. Despite this,
consideration of ICT in construction organisations has been described as piecemeal and lacking depth (Ashworth & Perera, 2015).
For the purposes of this research e-Busi-ness has been
defined as process innovation and adoption of ICT in construction related activities.
Government reports have often promoted the use of ICT from time to time, with government led initiatives stipulating various targets and deadlines for adoption. An example of this is the deadline for the implementation of BIM on UK government contracts being April 1st 2016 (McKane, 2015). ICT can be used for the benefit of all aspects of the construction administration process, such as all elements of the design process, specifications, estimating, cost planning / cost control, tender documentation and process, project programming, valuations and the final account, project monitoring, and communication. Bédard, (2006) acknowledges that “Undoubtedly, professionals in the AEC Industry (Architecture, Engineering and Construction) are now routinely using computing and ICT Tools in many Tasks” without examining the extent or scope of this ICT use. He considered its use from a design and maintenance perspective in the AEC industry.
Therefore this report seeks to fill this knowledge gap in the United Kingdom with an investigation into e-business implementation and future trends.
The purpose of the survey is to assess the state of adoption of ICT within the UK Construction industry. It will attempt to identify new developments and trends in relation to e-business in construction.
4
3.0 The Questionnaire Survey
3.1 Overall Method
3.2 Survey Method and
Composition
The questionnaire was structured into sixmain sections to investigate electronic business (e-Business) in the UK construction industry. The main sections of the survey were: Background Information, e-Business in Respondent Organisations, IT Investment Advice and e-Skills Development, Drivers, Impact and Barriers of e-Business, Improvement of e-Business and Future of e-Business. The survey was disseminated to UK construction organisations through LimesurveyTM software. This contains a web-based user interface linked to a MySQL database for collection and analysis of data. Analysis of responses to the questionnaire provides a transparent view of e-business activity and proposed level of future ICT implementation within the UK construction industry.
This study was carried out using a structured electronic questionnaire. Scaled questions were presented using a scale of High, Medium, Low and none. Then an elemental ranking for this scale was carried out on the basis of coding the results and using the relative importance index (RII) formula to determine the ranking. A “High” was coded 3, a “Medium” 2, “Low” 1 and “none” 0.
The standard RII formula was then used to establish the respondent’s ranking on each of the questions which related to a ranking.
RII is defined by the following
formulae:-Where:
W is the weighting given to each element by the respondents. This will be between 0 and 3, where 0 is the least significant impact and 3 is the most significant impact;
A is the highest weight (3 in our case); and
N is the total number of respondents.
Contact was made with 513 construction organisations who agreed to do the survey. However, only 69 responses were received. Of the 69 only 41 of the surveys were fully complete, another 14 were partially complete and 14 chose to opt out prior to completing any of the survey. Therefore the survey was analysed based on 55 responses.
Σ W
A x N (0 ≤ index ≤ 1)
5
TG83: e-Business in Construction
6 | P a g e
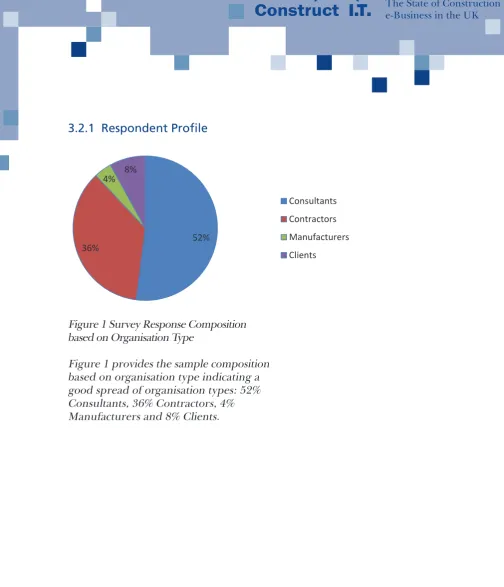
[image:8.595.41.546.50.638.2]3.2.1 Respondent Profile
Figure 1 Survey Response Composition based on Organisation Type
Figure 1 provides the sample composition based on organisation type indicating a good spread of organisation types: 52% Consultants, 36% Contractors, 4% Manufacturers and 8% Clients.
52% 36%
4% 8%
Consultants Contractors Manufacturers Clients
3.2.1 Respondent Profile
Figure 1 Survey Response Composition based on Organisation Type
6
TG83: e-Business in Construction
[image:9.595.99.537.57.565.2]7 | P a g e
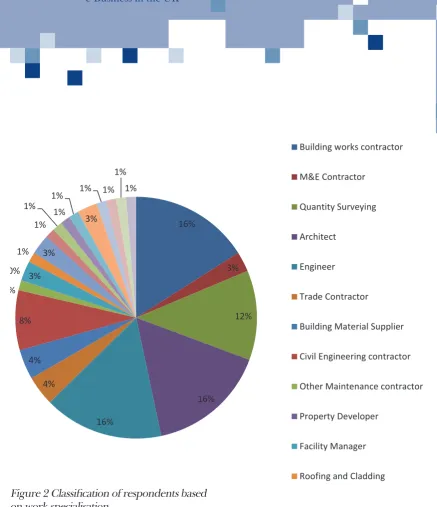
Figure 2 Classification of respondents based on work specialisation
Figure 2 provides the classification of respondents based on work specialisation and indicates the wide variety of specialisms which contributed to the survey.
16%
3%
12%
16%
16% 4%
4% 8% 1%
0% 3% 1% 3%
1% 1% 1% 1%
3% 1% 1%
1% 1%
Building works contractor
M&E Contractor
Quantity Surveying
Architect
Engineer
Trade Contractor
Building Material Supplier
Civil Engineering contractor
Other Maintenance contractor
Property Developer
Facility Manager
Roofing and Cladding
Figure 2 Classification of respondents based on work specialisation
Figure 2 provides the classification of respondents based on work specialisation and indicates the wide variety of
7
TG83: e-Business in Construction
8 | P a g e
Figure 3 Classification of respondents based on area of work
Figure 3 indicates the breakdown of respondents based on the area of work: Seventy three percent (73%) of these were involved in building work, 53% in civil engineering work, 57% in refurbishment, 28% in historic preservation and 2% in external works.
Figure 4 Classification of respondents based on job title
Figure 4 indicates that the majority of responses came from Senior Management 67%, with 24% from middle management and only 9% support staff. This indicates that the sample is ideal for the construction industry in the UK.
73%
53% 57%
28% 2%
Building Work Civil Engineering work Refurbishment Work Historic Preservation External works
67% 24%
0% 9%
Senior Management Middle Management Junior Staff
Support Staff
Figure 3 Classification of respondents based on area of work
Figure 3 indicates the breakdown of respondents based on the area of work: Seventy three percent (73%) of these were involved in building work, 53% in civil engineering work, 57% in refurbishment, 28% in historic preservation and 2% in external works.
Figure 4 Classification of respondents based on job title
8
Figure 5 IT Specialist or not
Figure 5 indicates that only 9% of the sample work solely as an IT specialist within the organisation. This indicates that in the Construction Industry most combine their initial specialism with their ICT skills.
Figure 6 Classification of organisations based on number of employees
Figure 6 indicates that larger companies dominated the response with 49% of the sample having 250 employees or more. The remainder of the sample was evenly matched 1 – 9 employees 16%, 10 – 49 employees 19%, and 50 – 249 employees 16%.
The sample targeted companies which are larger and therefore more likely to use ICT thus providing a more accurate view of ICT usage within the construction industry.
TG83: e-Business in Construction
9 | P a g e
Figure 5 IT Specialist or not
Figure 5 indicates that only 9% of the sample work solely as an IT specialist within the organisation. This indicates that in the Construction Industry most combine their initial specialism with their ICT skills.
Figure 6 Classification of organisations based on number of employees
Figure 6 indicates that larger companies dominated the response with 49% of the sample having 250 employees or more. The remainder of the sample was evenly matched 1 – 9 employees 16%, 10 – 49 employees 19%, and 50 – 249 employees 16%.The sample targeted companies which are larger and therefore more likely to use ICT thus providing a more accurate view of ICT usage within the
construction industry.
9%
91%
IT Specialist - Yes IT Specialist - No
49%
16% 19%
16%
250 employees or more 50 – 249 employees 10 – 49 employees 1 – 9 employees
TG83: e-Business in Construction
9 | P a g e
Figure 5 IT Specialist or not
Figure 5 indicates that only 9% of the sample work solely as an IT specialist within the organisation. This indicates that in the Construction Industry most combine their initial specialism with their ICT skills.
Figure 6 Classification of organisations based on number of employees
Figure 6 indicates that larger companies dominated the response with 49% of the sample having 250 employees or more. The remainder of the sample was evenly matched 1 – 9 employees 16%, 10 – 49 employees 19%, and 50 – 249 employees 16%.The sample targeted companies which are larger and therefore more likely to use ICT thus providing a more accurate view of ICT usage within the
construction industry.
9%
91%
IT Specialist - Yes IT Specialist - No
49%
16% 19%
16%
4.0 Questionnaire Survey Results
9
The survey results are reported in asimilar structure to the layout of the questionnaire. Therefore the details are in the following divisions: e-Business in your organisation; IT investment and e-Skills development; Drivers, impact and barriers of e-Business; improvement of e-Business and future of e-business in your organisation. There are a wide variety of different applications of ICT in construction. This section of the report discusses applications from an e-business standpoint. E-business can be defined as business conducted electronically or using electronic means. Zhua et al (2015) show that the processes incorporated in e-business can be divided into technical, relational and business components. These can all be part of a computerised Enterprise Resource Planning (ERP) system. ERP systems streamline organisational activities, through the automation and replacement of paper based existing systems, by combining the activity into a single information system connected to a database. This database allows access to all necessary information and aids communication and access to data across the organisation. Duan et al (2012) draw distinctions between hosted and on-premise ERP solutions. Licensed software is installed on servers in-house accessible only to employees internally within the organisation. This is known as an intranet. An intranet is maintained by the organisation itself and care must be taken to ensure that backup and recovery methods are in place. An extranet provides an ERP through a hosted service provided by an external organisation with storage space elsewhere that is normally specific to an organisation, project or group of collaborating organisations. An extension to this has been the advent of cloud
computing. Tang (2015) states that ERP systems have advantages if they are integrated with cloud-based technologies.
However, extensive study of these different methods has not previously been carried out in a construction context. This section of the report examines the elements of business sometimes connected via an ERP and most affected by the
transition to electronic processes.
This section considers the elements of e-business within a particular organisation. It firstly considers the activities related to e-business in relation to document management and then core activities. It further examines the communication networks used and level of e-business usage.
This section examines the different elements within a construction organisation that can be dealt with electronically. Figure 7 indicates the degree to which documentation is exchanged electronically within the UK construction sector.
4.1 e-Business in your
organisation
10
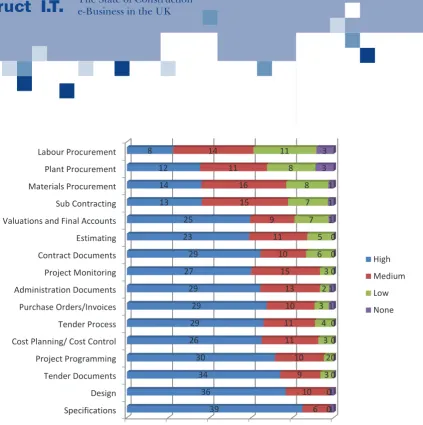
Figure 7 degree to which construction documents are exchanged electronically This indicates that elements of procurement such as Labour, Plant and Materials are underutilising electronic methods of document dissemination. Table 1 ranks the different elements using the Relative Importance Index (RII). This shows that, in the investigation of the various elements exchanged electronically, specifications are the most likely documents to be exchanged electronically, followed by design
documentation such as calculations. It is interesting that the top six types of documentation most commonly transferred electronically are all included in the design and tender process and are therefore linked to mandatory government deadlines related to implementation. These are 1) Specifications which are included in the tender documentation, 2) Design which will include the Building Information Model and related
calculations, 3) The Tender Documents themselves,
4) Project Programming which is included as a prerequisite in all NEC forms of contract documents which are specified by government departments, 5) Cost Planning/ Cost Control which is necessary to complete a construction tender and finally, 6) The Tender Process itself. E-tendering is being made mandatory across Europe from 2016. Costa and Grilo (2013) examined the link between Building Information Modelling (BIM) and the procurement process. They suggested incorporating Model-Driven Architecture (MDA), Service-Oriented Architecture (SOA) and Cloud Computing in advancing the interoperability aspects of e-procurement and BIM. The development and implementation of e-procurement first commenced in the late 1990’s through development of Electronic data Interchange technologies via the internet (Neef, 2001). Zarli et al (2009) indicated that “E-Procurement has gained huge popularity” but did not gather empirical evidence on this.
TG83: e-Business in Construction
11 | P a g e
Figure 7 degree to which construction documents are exchanged electronically
This indicates that elements of procurement such as Labour, Plant and Materials are underutilising electronic methods of document dissemination. Table 1 ranks the different elements using the Relative Importance Index (RII). This shows that in the investigation of the various elements exchanged electronically that specifications are the most likely documents to be exchanged electronically followed by design documentation such as calculations. It is interesting that the top six types of documentation most commonly transferred electronically are all included in the design and tender process and therefore linked to mandatory government deadlines related to implementation. These are 1) Specifications which are included in the tender documentation, 2) Design which will include the Building Information Model and related calculations, 3) The Tender Documents themselves, 4) Project Programming which is included as a prerequisite in all NEC forms of contract documents which are specified by government departments, 5) Cost Planning/ Cost Control which is necessary to complete a construction tender and finally, 6) The Tender Process itself. E-tendering is being made mandatory across Europe from 2016. Costa and Grilo (2013) examined the link between Building Information Modelling (BIM) and the procurement process. They suggested incorporating Model-Driven Architecture (MDA), Service-Oriented Architecture (SOA) and Cloud Computing in advancing the interoperability aspects of e-procurement and BIM. The development and implementation of e-procurement first commenced in the late 1990’s through development of Electronic data Interchange technologies via the internet (Neef, 2001). Zarli et al (2009) indicated that “E-Procurement has gained huge popularity” but did not gather empirical evidence on this. They considered it vital for supply chain management. Griloa and Jardim-Goncalves (2011) concluded that while other industries were implementing e-procurement, the construction industry was lagging behind. Eadie et al (2010) indicated that “Process, Transaction and Administration Cost Savings” was
0% 20% 40% 60% 80% 100%
11
They considered it vital for supply chainmanagement. Griloa and Jardim-Goncalves (2011) concluded that while other industries were implementing e-procurement, the construction industry was lagging behind. Eadie et al (2010) indicated that “Process, Transaction and Administration Cost Savings” was the greatest benefit of e-procurement from a construction professional’s perspective. This work indicates that Government department deadlines in relation to BIM and e-tendering have worked to some extent, pushing
electronic documentation in these areas to the top of the rankings in Table 1.
Core activities within the organisations were considered next and each element ranked in order of its use in the
[image:14.595.109.529.422.740.2]Construction Industry. Figure 8 provides the results in a bar chart.
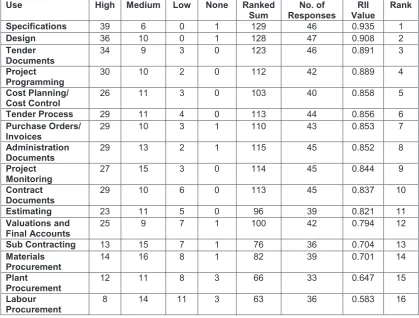
Table 1 ranked degree to which construction documents are exchanged electronically TG83: e-Business in Construction
12 | P a g e
the greatest benefit of e-procurement from a construction professional’s perspective. This work indicates that Government department deadlines in relation to BIM and e-tendering have worked to some extent pushing electronic documentation in these areas to the top of the rankings in Table 1.
Table 1 ranked degree to which construction documents are exchanged electronically Use High Medium Low None Ranked
Sum Responses No. of Value RII Rank Specifications 39 6 0 1 129 46 0.935 1
Design 36 10 0 1 128 47 0.908 2
Tender
Documents 34 9 3 0 123 46 0.891 3
Project
Programming 30 10 2 0 112 42 0.889 4
Cost Planning/
Cost Control 26 11 3 0 103 40 0.858 5 Tender Process 29 11 4 0 113 44 0.856 6 Purchase Orders/
Invoices 29 10 3 1 110 43 0.853 7
Administration
Documents 29 13 2 1 115 45 0.852 8
Project
Monitoring 27 15 3 0 114 45 0.844 9
Contract
Documents 29 10 6 0 113 45 0.837 10
Estimating 23 11 5 0 96 39 0.821 11
Valuations and
Final Accounts 25 9 7 1 100 42 0.794 12 Sub Contracting 13 15 7 1 76 36 0.704 13 Materials
Procurement 14 16 8 1 82 39 0.701 14
Plant
Procurement 12 11 8 3 66 33 0.647 15
Labour
Procurement 8 14 11 3 63 36 0.583 16
12
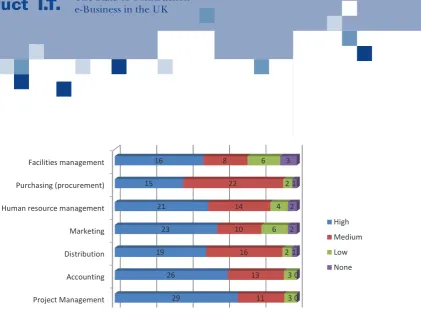
Figure 8 and Table 2 indicate that financial systems such as electronic banking, programming with project management and accounting are the most used and therefore highest ranked electronic enabled core activities within UK construction organisations. The financial health of an organisation is necessity for survival and it is good to see that it ranks at the top of the list in relation to ICT incorporation within UK Construction organisations. ICT has allowed computerised systems to be developed to deal electronically with organisational income and expenditure. Vital to the construction industry many of these ICT applications have modules allowing project specific elements such as
rental of plant, salaries, and material costs to be determined against individual projects. Depending on the complexity of the ICT system, some systems allow tax documentation, payment to be completed and automatic invoicing generated. Just Payroll Systems (2015) is an example of a system with these capabilities with a construction specialism. Most banking systems now allow transactions relating to loans and money exchange to be transferred electronically so it is no surprise that it came top of the rankings. TG83: e-Business in Construction
[image:15.595.110.532.46.358.2]13 | P a g e
Figure 8 degree to which core business documents are electronic
[image:15.595.111.534.656.815.2]Figure 8 and Table 2 indicate that financial systems such as electronic banking, programming with project management and accounting are the most used and therefore highest ranked electronic enabled core activities within UK construction organisations. The financial health of an organisation is necessity for survival and it is good to see that it ranks at the top of the list in relation to ICT incorporation within UK Construction organisations. ICT has allowed computerised systems to be developed to deal electronically with organisational income and expenditure. Vital to the construction industry many of these ICT applications have modules allowing project specific elements such as rental of plant, salaries, and material costs to be determined against individual projects. Depending on the complexity of the ICT system, some systems allow tax documentation, payment to be completed and automatic invoicing generated. Just Payroll Systems (2015) is an example of a system with these capabilities with a construction specialism. Most banking systems now allow transactions relating to loans and money exchange to be transferred electronically so it is no surprise that it came top of the rankings.
Table 2 ranked degree to which core business documents are electronic
0% 20% 40% 60% 80% 100%
Finance Project Management Accounting Distribution Marketing Human resource management Purchasing (procurement) Facilities management 28 29 26 19 23 21 15 16 13 11 13 16 10 14 22 8 1 3 3 2 6 4 2 6 0 0 0 1 2 2 1 3 High Medium Low None
Use High Medium Low None Ranked
Sum Responses No. of Value RII Rank
Finance 28 13 1 0 111 42 2.643 1
Project
Management 29 11 3 0 112 43 2.605 2
Accounting 26 13 3 0 107 42 2.548 3
Distribution 19 16 2 1 91 38 2.395 4
Marketing 23 10 6 2 95 41 2.317 5
Human resource
management 21 14 4 2 95 41 2.317 5
Purchasing
(procurement) 15 22 2 1 91 40 2.275 7
Facilities
management 16 8 6 3 70 33 2.121 8
TG83: e-Business in Construction
13 | P a g e
Figure 8 degree to which core business documents are electronic
Figure 8 and Table 2 indicate that financial systems such as electronic banking, programming with project management and accounting are the most used and therefore highest ranked electronic enabled core activities within UK construction organisations. The financial health of an organisation is necessity for survival and it is good to see that it ranks at the top of the list in relation to ICT incorporation within UK Construction organisations. ICT has allowed computerised systems to be developed to deal electronically with organisational income and expenditure. Vital to the construction industry many of these ICT applications have modules allowing project specific elements such as rental of plant, salaries, and material costs to be determined against individual projects. Depending on the complexity of the ICT system, some systems allow tax documentation, payment to be completed and automatic invoicing generated. Just Payroll Systems (2015) is an example of a system with these capabilities with a construction specialism. Most banking systems now allow transactions relating to loans and money exchange to be transferred electronically so it is no surprise that it came top of the rankings.
Table 2 ranked degree to which core business documents are electronic
0% 20% 40% 60% 80% 100%
Finance Project Management Accounting Distribution Marketing Human resource management Purchasing (procurement) Facilities management 28 29 26 19 23 21 15 16 13 11 13 16 10 14 22 8 1 3 3 2 6 4 2 6 0 0 0 1 2 2 1 3 High Medium Low None
Use High Medium Low None Ranked
Sum Responses No. of Value RII Rank
Finance 28 13 1 0 111 42 2.643 1
Project
Management 29 11 3 0 112 43 2.605 2
Accounting 26 13 3 0 107 42 2.548 3
Distribution 19 16 2 1 91 38 2.395 4
Marketing 23 10 6 2 95 41 2.317 5
Human resource
management 21 14 4 2 95 41 2.317 5
Purchasing
(procurement) 15 22 2 1 91 40 2.275 7
Facilities
management 16 8 6 3 70 33 2.121 8
Figure 8 degree to which core business documents are electronic
13
What is surprising is the low ranking givento Human Resource (HR) Management. Troshani et al (2011) show that Human Resources are key to the smooth and efficient running of any organisation. In order to get the maximum gain from ICT HRM has been incorporated into
Enterprise Resource Planning (ERP) systems. Burger (2015) shows that HRM is one element of an ERP system that can be fully automated by ICT. There are many examples of HRM software available such as Sage HRMS (formerly Sage Abra HRMS) which is HRM system software that includes modules which automate integrated HR, payroll, benefits, and attendance functionality and provide reporting and analysis (Practical Software Solutions, 2010). Laursen and Foss (2003) in a study into HRM of 1900 organisations in Denmark showed that ICT had a major beneficial effect on the HRM function especially in the region of organisational financial performance. Unfortunately its low ranking shows that these benefits are not being fully realised by many construction organisations.
Another disappointing element along with
the HRM ranking is the joint ranking with
marketing. The invention of the internet
has seen the invention of a whole new brand
of marketing known as digital marketing.
Where previously people were using glossy
brochures as a sole means of marketing their
organisations, they have now moved on to
a web presence in digital form. Berg (2015)
indicates that social media can be used to
allow construction organisations to connect
to their key stakeholders and address a large
audience using limited financial resources.
Using Web 2.0 technologies such as Facebook
or Twitter allows dissemination of
information and interaction at little or no
cost to the organisation. Therefore getting
involved in this type of e-Business would
be a “win-win” solution for many
construction organisations.
Distribution of documentation electronically has been identified by Alaghbandrad et al (2012) as being more efficient and cheaper than paper based processes. This is especially relevant to the tendering process where large tender documents, often many hundreds of pages, need to be transmitted to tenderers. Liao (2002) illustrates this with a Taiwanese case study showing that the “Electronic Tender
Obtaining and Submitting System” results in savings of US$40 million each year through making the process more efficient. The Hong Kong government, similarly, have achieved savings through the “Electronic Tendering System (ETS)” system as documents are downloaded and submitted via the Internet (Chu et al., 2004). In UK procurement the devolved administrations are responsible for documentation. Therefore England, Scotland, Wales and Northern Ireland have implemented systems for distribut-ing procurement tender documentation leading to process transaction savings. More take-up of electronic distribution systems is necessary to fully realise the potential of the savings on offer.
The responses to the questionnaire in this section provide answers to two main issues: the type of network the firms/organisations use and the degree to which they
communicate electronically internally and externally.
The results of this section shown in Figure 9 and Table 3 indicate that the various types of network are equally balanced in the UK. While Intranet use is the largest way of transferring documents on a network, particularly of interest is that Sky Drives / Cloud Networks are just above the use of an Intranet and an extranet together.
4.1.2 Communications Network
14
The cloud computing result is interesting as AutoCAD 360 and other software for
construction related activities have moved many of the design drawings and 3D models to the cloud. Matthews et al (2015) indicate that this move has meant that many paper-based processes have been re-engineered to encompass the use of cloud-based BIM during construction. As the deadline for BIM for all government projects in the UK approaches in 2016, it is anticipated that this percentage will grow.
This section compared the degree
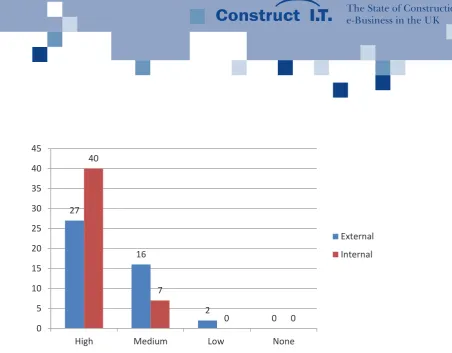
respondents communicated electronically internally and externally. Figure 10 indicates that internal communication within an organisation outstripped the external communication. It can be seen that Medium to High levels of both internal and external communications exist in the UK construction industry.
TG83: e-Business in Construction
[image:17.595.110.371.48.338.2] [image:17.595.109.441.586.647.2]15 | P a g e
Figure 9 Communication networks in respondent organisations
The cloud computing result is interesting as AutoCAD 360 and other software for construction related activities have moved many of the design drawings and 3D models to the cloud. Matthews et al (2015) indicate that this move has meant that many paper-based processes have been re-engineered to encompass the use of cloud-based BIM during construction. As the deadline for BIM for all government projects in the UK approaches in 2016, it is anticipated that this percentage will grow.
Table 3 Communication Networks in Respondent Organisations
Communications Network No. of Responses Percentage of responses
Intranet 25 29.1%
Extranet 14 16.3%
Both 22 25.6%
Neither 1 1.1%
Sky drives / Cloud networks 24 27.9%
4.1.2.2. Internal and External Communication Levels
This section compared the degree respondents communicated electronically internally and externally. Figure 10 indicates that internal communication within an organisation outstripped the external communication. It can be seen that Medium to High levels of both internal and external communications exist in the UK construction industry.
16%
29%
26% 28%
1%
Extranet
Intranet
Both
Sky drives / Cloud networks Neither
TG83: e-Business in Construction
15 | P a g e
Figure 9 Communication networks in respondent organisations
The cloud computing result is interesting as AutoCAD 360 and other software for construction related activities have moved many of the design drawings and 3D models to the cloud. Matthews et al (2015) indicate that this move has meant that many paper-based processes have been re-engineered to encompass the use of cloud-based BIM during construction. As the deadline for BIM for all government projects in the UK approaches in 2016, it is anticipated that this percentage will grow.
Table 3 Communication Networks in Respondent Organisations
Communications Network No. of Responses Percentage of responses
Intranet 25 29.1%
Extranet 14 16.3%
Both 22 25.6%
Neither 1 1.1%
Sky drives / Cloud networks 24 27.9%
4.1.2.2. Internal and External Communication Levels
This section compared the degree respondents communicated electronically internally and externally. Figure 10 indicates that internal communication within an organisation outstripped the external communication. It can be seen that Medium to High levels of both internal and external communications exist in the UK construction industry.
16%
29%
26% 28%
1%
Extranet
Intranet
Both
Sky drives / Cloud networks Neither
Figure 9 Communication networks in respondent organisations
Table 3 Communication Networks in Respondent Organisations
15
Organisations were asked to respond onthe degree certain activities were carried out on the internet. The responses are listed in Table 4. Ranking using the RII resulted in project collaboration and management being the activity the internet is most used for. This supports the findings of Eadie et al (2013)
which indicated that the greatest driver for Building Information Modelling was that communication is vital. BIM allows this to take place and communication between team members increases. The use of BIM in e-business use for communication purposes is not to be underestimated.
4.1.3 Level of e-business usage
TG83: e-Business in Construction
[image:18.595.80.533.45.398.2]16 | P a g e
Figure 10 degree of electronic communication internally and externally
4.1.3 Level of e-business usage
[image:18.595.112.534.577.817.2]Organisations were asked to respond on the degree certain activities were carried out on the internet. The responses are listed in Table 4. Ranking using the RII resulted in project collaboration and management being the activity they most use the internet for. This supports the findings of Eadie et al (2013) which indicated that the greatest driver for Building Information Modelling was that communication is vital. BIM allows this to take place and communication between team members increases. The use of BIM in e-business use for communication purposes is not to be underestimated.
Table 4 Ranking of preferred activities for internet use
Use High Medium Low None Ranked Sum Responses No. of Value RII Rank
Project
collaboration and management
23 18 4 0 109 45 0.807 1
Electronic Procurement (purchase material and equipment)
18 18 6 0 96 42 0.762 2
Bidding and tendering online (whole project delivery)
22 12 8 1 98 43 0.760 3
Product Service
Promotion 14 20 4 2 86 40 0.717 4
Supply Chain
Management 14 17 9 0 85 40 0.708 5
Customer relationship management
8 25 9 1 83 43 0.643 6
Lessons Learned
Documentation 11 15 13 1 76 40 0.633 7
27 16 2 0 40 7
0 0
0 5 10 15 20 25 30 35 40 45
High Medium Low None
External Internal TG83: e-Business in Construction
16 | P a g e
Figure 10 degree of electronic communication internally and externally
4.1.3 Level of e-business usage
Organisations were asked to respond on the degree certain activities were carried out on the internet. The responses are listed in Table 4. Ranking using the RII resulted in project collaboration and management being the activity they most use the internet for. This supports the findings of Eadie et al (2013) which indicated that the greatest driver for Building Information Modelling was that communication is vital. BIM allows this to take place and communication between team members increases. The use of BIM in e-business use for communication purposes is not to be underestimated.
Table 4 Ranking of preferred activities for internet use
Use High Medium Low None Ranked Sum Responses No. of Value RII Rank Project
collaboration and management
23 18 4 0 109 45 0.807 1
Electronic Procurement (purchase material and equipment)
18 18 6 0 96 42 0.762 2
Bidding and tendering online (whole project delivery)
22 12 8 1 98 43 0.760 3
Product Service
Promotion 14 20 4 2 86 40 0.717 4
Supply Chain
Management 14 17 9 0 85 40 0.708 5
Customer relationship management
8 25 9 1 83 43 0.643 6
Lessons Learned
Documentation 11 15 13 1 76 40 0.633 7
27 16 2 0 40 7
0 0
0 5 10 15 20 25 30 35 40 45
High Medium Low None
External Internal
Figure 10 degree of electronic communication internally and externally
16
Respondent organisations were then asked if they use e-business enabling technologies and comment on the degree of usage within their organisation. Again RII was used to rank the most preferred e-business enabling technologies. It can be seen from Table 5 that the Internet was the greater enabling tech-nology for e-business.
This part of the report explores how
respondents operate and maintain e-business systems with a view to the future. This section contains an investigation of IT investment advice, IT expenditure and e-Skills development.
This section investigates respondent’s average annual IT budgets, including hardware, software, services and personnel over the last five years. It can be seen from Table 7 that over half (52.9%) only spent 1-4% of their annual budget on IT on average over the last 5 years. Eighty-eight (88%) percent of the respondents spent less than 9% of their annual budget on IT over the last five years. This indicates either that there is underinvestment in keeping up to date with the latest software or that existing software functions correctly to the correct level of efficiency required to make the required return on investment. It would be expected that this might rise over the next number of years as relatively expensive BIM software needs to be purchased to meet the UK Government deadlines for implementation. Respondents were asked to identify
where they sourced their IT advice from. Table 6 indicates that the majority obtain advice on IT investment from professional IT providers. This indicates that the salespersons who sell IT need to be aware of all the developments and what meets the needs of the organisations that they are visiting.
TG83: e-Business in Construction
17 | P a g e
Respondent organisations were then asked if they use e-business enabling technologies and comment on the degree of usage within their organisation. Again RII was used to rank the most preferred e-business enabling technologies. It can be seen from Table 5 that the Internet was the greater enabling technology for e-business.
Table 5 Ranking of preferred e-business enabling technologies Use High Medium Low None Ranked
Sum Responses No. of Value RII Rank
Internet 40 6 1 0 133 47 0.943 1
CAD 27 9 8 2 107 46 0.775 2
BIM 15 9 14 7 77 45 0.570 3
Cloud Computing 7 17 12 5 67 41 0.545 4
4.2 IT investment advice and e-Skills development
This part of the report explores how respondents operate and maintain e-business systems with a view to the future. This section contains an investigation of IT investment advice, IT Expenditure and e-skills development.
4.2.1. IT investment advice
[image:19.595.108.527.707.815.2]Respondents were asked to identify where they sourced their IT advice from. Table 6 indicates that the majority obtain advice on IT investment from professional IT providers. This indicates that the salespersons who sell IT need to be aware of all the developments and what meets the needs of the organisations that they are visiting.
Table 6 type of IT investment advice
Advice Count Percentage of Responses
Obtain advice on IT investment
from professional IT providers 30 38.96%
Obtain advice from own IT
department or IT practitioners 29 37.66%
Learn through university or
other research parties 9 11.69%
Implement IT investment through government/third party recommendations
9 11.69%
4.2.2 IT expenditure
This section investigates respondent’s average annual IT budgets, including hardware, software, services and personnel over the last five years. It can be seen from Table 7 that over half (52.9%) only spent 1-4% of their annual budget on IT on average over the last 5 years. Eighty-eight (88%) percent of the respondents spent less than 9% of their annual budget on IT over the last five years. This indicates either that there is underinvestment in keeping up to date with the latest software or that existing software functions correctly to the correct level of efficiency required to make the required return on investment. It would be expected that this might rise over the next number of years as relatively expensive BIM software needs to be purchased to meet the UK Government deadlines for implementation.
TG83: e-Business in Construction
17 | P a g e
Respondent organisations were then asked if they use e-business enabling technologies and comment on the degree of usage within their organisation. Again RII was used to rank the most preferred e-business enabling technologies. It can be seen from Table 5 that the Internet was the greater enabling technology for e-business.
Table 5 Ranking of preferred e-business enabling technologies Use High Medium Low None Ranked
Sum Responses No. of Value RII Rank
Internet 40 6 1 0 133 47 0.943 1
CAD 27 9 8 2 107 46 0.775 2
BIM 15 9 14 7 77 45 0.570 3
Cloud Computing 7 17 12 5 67 41 0.545 4
4.2 IT investment advice and e-Skills development
This part of the report explores how respondents operate and maintain e-business systems with a view to the future. This section contains an investigation of IT investment advice, IT Expenditure and e-skills development.
4.2.1. IT investment advice
Respondents were asked to identify where they sourced their IT advice from. Table 6 indicates that the majority obtain advice on IT investment from professional IT providers. This indicates that the salespersons who sell IT need to be aware of all the developments and what meets the needs of the organisations that they are visiting.
Table 6 type of IT investment advice
Advice Count Percentage of Responses
Obtain advice on IT investment
from professional IT providers 30 38.96%
Obtain advice from own IT
department or IT practitioners 29 37.66%
Learn through university or
other research parties 9 11.69%
Implement IT investment through government/third party recommendations
9 11.69%
4.2.2 IT expenditure
This section investigates respondent’s average annual IT budgets, including hardware, software, services and personnel over the last five years. It can be seen from Table 7 that over half (52.9%) only spent 1-4% of their annual budget on IT on average over the last 5 years. Eighty-eight (88%) percent of the respondents spent less than 9% of their annual budget on IT over the last five years. This indicates either that there is underinvestment in keeping up to date with the latest software or that existing software functions correctly to the correct level of efficiency required to make the required return on investment. It would be expected that this might rise over the next number of years as relatively expensive BIM software needs to be purchased to meet the UK Government deadlines for implementation.
Table 5 Ranking of preferred e-business enabling technologies
Table 6 type of IT investment advice
4.2.1. IT investment advice
4.2.2 IT expenditure
4.2 IT investment advice and
17
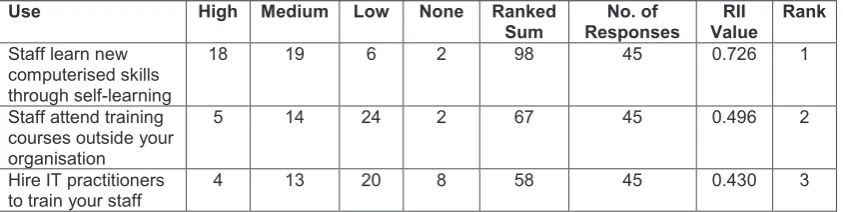
Organisations were asked to rank how theiremployees developed e-Skills in this section. They were given three options: Staff learnt new computerised skills through self-learning, Staff attend training courses outside your organisation and the organisation hires IT practitioners to train their staff. It can be seen from Table 8 that the majority of staff are self-taught. This emphasises the importance of manuals and step-by-step guides to new software. The RII value given to this shows that this type of learning is 23% higher than the next ranked method which is that staff attend courses outside the organisation.
This section of the report comments on three elements of e-business: the drivers for it, the impact of it and the barriers to it.
The drivers or positive forces behind e-business were ranked by the respondents. The reasons were ranked in order of importance in Table 9.
It can be seen from Table 9 that
organisations acknowledged that competitive advantage is the most convincing reason to engage in e-business. In second place is customer expectations and this is impacted on by the demands of public sector clients.
4.2.3 e-Skills Development
4.3.1 Drivers for implementing
e-Business
TG83: e-Business in Construction
18 | P a g e
Table 7 degree of IT expenditure in the last 5 years
Average annual share of your IT budget, including hardware, software, services and personnel, as percentage of your total company costs in last 5 years
Count Percentage
1-4% 18 52.9%
5-9% 12 35.3%
10-14% 3 8.8%
20%+ 1 3.0%
4.2.3 e-Skill Development
[image:20.595.111.533.532.638.2]Organisations were asked to rank how their employees developed e-skills in this section. They were given three options: Staff learnt new computerised skills through self-learning, Staff attend training courses outside your organisation and the organisation hires IT practitioners to train their staff. It can be seen from Table 8 that the majority of staff are self-taught. This emphasises the importance of manuals and step-by-step guides to new software. The RII value given to this shows that this type of learning is 23% higher than the next ranked method which is that staff attend courses outside the organisation.
Table 8 Ranking of e-skills development
Use High Medium Low None Ranked
Sum Responses No. of Value RII Rank Staff learn new
computerised skills through self-learning
18 19 6 2 98 45 0.726 1
Staff attend training courses outside your organisation
5 14 24 2 67 45 0.496 2
Hire IT practitioners
to train your staff 4 13 20 8 58 45 0.430 3
4.3 Drivers, Impact and Barriers of e-Business
This section of the report comments on three elements of e-business: the drivers for it, the impact of it and the barriers to it.
4.3.1 Drivers for implementing e-Business
The drivers or positive forces behind e-business were ranked by the respondents. The reasons were ranked in order of importance in Table 9. It can be seen from Table 9 that organisations acknowledged that competitive advantage is the most convincing reason to engage in e-business. In second place is customer expectations and this is impacted on by the demands of public sector clients.
Table 9 Ranking of drivers for e-business
Use High Medium Low None Ranked
Sum Responses No. of Value RII Rank Competitive
advantage 26 12 1 0 103 39 0.880 1
TG83: e-Business in Construction
18 | P a g e
Table 7 degree of IT expenditure in the last 5 years
Average annual share of your IT budget, including hardware, software, services and personnel, as percentage of your total company costs in last 5 years
Count Percentage
1-4% 18 52.9%
5-9% 12 35.3%
10-14% 3 8.8%
20%+ 1 3.0%
4.2.3 e-Skill Development
Organisations were asked to rank how their employees developed e-skills in this section. They were given three options: Staff learnt new computerised skills through self-learning, Staff attend training courses outside your organisation and the organisation hires IT practitioners to train their staff. It can be seen from Table 8 that the majority of staff are self-taught. This emphasises the importance of manuals and step-by-step guides to new software. The RII value given to this shows that this type of learning is 23% higher than the next ranked method which is that staff attend courses outside the organisation.
Table 8 Ranking of e-skills development
Use High Medium Low None Ranked
Sum Responses No. of Value RII Rank Staff learn new
computerised skills through self-learning
18 19 6 2 98 45 0.726 1
Staff attend training courses outside your organisation
5 14 24 2 67 45 0.496 2
Hire IT practitioners
to train your staff 4 13 20 8 58 45 0.430 3
4.3 Drivers, Impact and Barriers of e-Business
This section of the report comments on three elements of e-business: the drivers for it, the impact of it and the barriers to it.
4.3.1 Drivers for implementing e-Business
The drivers or positive forces behind e-business were ranked by the respondents. The reasons were ranked in order of importance in Table 9. It can be seen from Table 9 that organisations acknowledged that competitive advantage is the most convincing reason to engage in e-business. In second place is customer expectations and this is impacted on by the demands of public sector clients.
Table 9 Ranking of drivers for e-business
Use High Medium Low None Ranked
Sum Responses No. of Value RII Rank Competitive
advantage 26 12 1 0 103 39 0.880 1
Table 7 degree of IT expenditure in the last 5 years
Table 8 Ranking of e-Skills development
The State of Construction e-Business in the UK
18
This section ranks the perspectives of the respondent organisations in regard to the impact of e-business. Table 10 provides the rankings from the analysis of the results. Table 10 shows that efficiency of business process was ranked as the most important impact area.
The management and control provided by the project management elements of e-Business is ranked in second position, followed by the time and cost savings. Productivity ranked in fourth position with competitive advantage in fifth position.
TG83: e-Business in Construction
19 |P a g e Customer
expectation 20 13 6 0 92 39 0.786 2
Supply chain
expectation 15 16 8 0 85 39 0.726 3
Competitors engage in e-business
14 16 5 4 79 39 0.675 4
4.3.2 Impact identified for e-business implementation
Use High Medium Low None Ranked Sum ResponsesNo. of RII Value Rank
Efficiency of business
processes 28 11 0 0 106 39 0.906 1
Management and control 27 12 0 0 105 39 0.897 2
Time and cost savings 27 10 2 0 103 39 0.880 3
Productivity 24 15 0 0 102 39 0.872 4
Competitive advantage 28 8 1 2 101 39 0.863 5
Accounting and
administration 21 16 2 0 97 39 0.829 6
Improving collaboration 18 20 1 0 95 39 0.812 7
Quality of customer
service 18 14 6 0 88 38 0.772 8
Innovation 18 15 5 1 89 39 0.761 9
Organisational innovation 18 14 6 1 88 39 0.752 10
Growth of revenue 15 18 5 1 86 39 0.735 11
Procurement cost of
supplied goods 14 18 6 1 84 39 0.718 12
Market reach 13 17 8 1 81 39 0.692 13
Visibility to supply chain 13 15 9 2 78 39 0.667 14
Staff training 9 21 9 0 78 39 0.667 14
Research and
development 15 11 10 3 77 39 0.658 16
Internal organisation
relationship 11 16 12 0 77 39 0.658 16
Quality of products 9 21 8 1 77 39 0.658 16
Expansion of partnership 10 15 11 3 71 39 0.607 19
4.3.3 Barriers to e-Business implementation
[image:21.595.107.536.43.343.2]It is evident from the findings in Section 4.1.3 that the use of e-business can expand in the UK. It must therefore also be evident that there are a number of barriers that aspire to hold it back from full implementation. Respondent organisations were asked to rank the importance of these barriers. The ranking is provided in Table 11. It is interesting that Security of data transaction and submission is the biggest barrier to e-business. This matches the largest barrier to e-procurement in construction described in Eadie et al (2010) where prevention of Tampering with Documents - changes to documents and confidentiality of information - unauthorised viewing were viewed as the greatest barriers to e-procurement implementation. A similar situation exists in relation to e-business. Cost of
Table 10 Ranking of impact of e-business
4.3.2 Impact identified for e-business
implementation
18 | P a g e
personnel, as percentage of your total company costs in last 5 years
Count Percentage
1-4% 18 52.9%
5-9% 12 35.3%
10-14% 3 8.8%
20%+ 1 3.0%
4.2.3 e-Skill Development
Organisations were asked to rank how their employees developed e-skills in this section. They were given three options: Staff learnt new computerised skills through self-learning, Staff attend training courses outside your organisation and the organisation hires IT practitioners to train their staff. It can be seen from Table 8 that the majority of staff are self-taught. This emphasises the importance of manuals and step-by-step guides to new software. The RII value given to this shows that this type of learning is 23% higher than the next ranked method which is that staff attend courses outside the organisation.
Table 8 Ranking of e-skills development
Use High Medium Low None Ranked
Sum Responses No. of Value RII Rank Staff learn new
computerised skills through self-learning
18 19 6 2 98 45 0.726 1
Staff attend training courses outside your organisation
5 14 24 2 67 45 0.496 2
Hire IT practitioners
to train your staff 4 13 20 8 58 45 0.430 3
4.3 Drivers, Impact and Barriers of e-Business
This section of the report comments on three elements of e-business: the drivers for it, the impact of it and the barriers to it.
4.3.1 Drivers for implementing e-Business
The drivers or positive forces behind e-business were ranked by the respondents. The reasons were ranked in order of importance in Table 9. It can be seen from Table 9 that organisations acknowledged that competitive advantage is the most convincing reason to engage in e-business. In second place is customer expectations and this is impacted on by the demands of public sector clients.
Table 9 Ranking of drivers for e-business
Use High Medium Low None Ranked
Sum Responses No. of Value RII Rank Competitive
advantage 26 12 1 0 103 39 0.880 1
TG83: e-Business in Construction
19 | P a g e Customer
expectation 20 13 6 0 92 39 0.786 2
Supply chain
expectation 15 16 8 0 85 39 0.726 3
Competitors engage in e-business
14 16 5 4 79 39 0.675 4
4.3.2 Impact identified for e-business implementation
[image:21.595.109.537.492.812.2]This section ranks the perspectives of the respondent organisations in regard to the impact of e-business. Table 10 provides the rankings from the analysis of the results. Table 10 shows that efficiency of business process was ranked as the most important impact area. The management and control provided by project management elements of e-business is ranked in second position, followed by the time and cost savings. Productivity ranked in fourth position with competitive advantage in fifth position.
Table 10 Ranking of impact of e-business
Use High Medium Low None Ranked
Sum Responses No. of Value RII Rank Efficiency of
business processes
28 11 0 0 106 39 0.906 1
Management and
control 27 12 0 0 105 39 0.897 2
Time and cost
savings 27 10 2 0 103 39 0.880 3
Productivity 24 15 0 0 102 39 0.872 4
Competitive
advantage 28 8 1 2 101 39 0.863 5
Accounting and
administration 21 16 2 0 97 39 0.829 6
Improving
collaboration 18 20 1 0 95 39 0.812 7
Quality of
customer service 18 14 6 0 88 38 0.772 8
Innovation 18 15 5 1 89 39 0.761 9
Organisational
innovation 18 14 6 1 88 39 0.752 10
Growth of
revenue 15 18 5 1 86 39 0.735 11
Procurement cost
of supplied goods 14 18 6 1 84 39 0.718 12
Market reach 13 17 8 1 81 39 0.692 13
Visibility to supply
chain 13 15 9 2 78 39 0.667 14
Staff training 9 21 9 0 78 39 0.667 14
Research and
development 15 11 10 3 77 39 0.658 16
Internal organisation relationship
11 16 12 0 77 39 0.658 16
Quality of
products 9 21 8 1 77 39 0.658 16
19
It is evident from the findings in Section 4.1.3that the use of e-business can expand in the UK. It must therefore also be evident that there are a number of barriers that conspire to hold it back from full implementation. Respondent organisations were asked to rank the importance of these barriers. The ranking is provided in Table 11. It is interesting that Security of data transaction and submission is the biggest barrier to e-Business. This matches the largest barrier to e-procurement in construction described in Eadie et al (2010) where prevention of Tampering with Documents - changes to documents and confidentiality of information
-unauthorised viewing were viewed as the greatest barriers to e-procurement implementation. A similar situation exists in relation to e-business. Cost of investment ranks in joint first position suggesting that government subsidies to assist with the purchase of e-business software would increase implementation. The interoperability issue again ranks highly in third position overall suggesting that “open” systems need to be developed to increase uptake. Three barriers are ranked in joint fourth place: Resistance to change, Lack of technical skills and Confidence in using new technology. All three of these relate to the personnel involved in e-business and training should lessen the impact of these barriers.
4.3.3 Barriers to e-Business
implementation
TG83: e-Business in Construction
20 |P a g e
investment ranks in joint first position suggesting that government subsidies to assist with the purchase of e-business software would increase implementation. The interoperability issue again ranks highly in third position overall suggesting that “open” systems need to be developed to increase uptake. Three barriers are ranked in joint fourth place: Resistance to change, Lack of technical skills and Confidence in using new technology. All three of these relate to the personnel involved in e-business and training should lessen the impact of these barriers.
Table 10 Ranking of barriers of e-business
Use High Medium Low None Ranked Sum No. of Responses RII Value Rank
Security of data transaction
and submission 15 9 13 1 76 38 0.667 1
Cost of investment 11 18 7 2 76 38 0.667 1
Interface with other systems 10 17 10 1 74 38 0.649 3
Resistance to change 9 17 10 2 71 38 0.623 4
Lack of technical skills 9 16 12 1 71 38 0.623 4
Confidence in using new
technology 7 20 10 1 71 38 0.623 4
Modification of legacy
systems 7 14 15 2 64 38 0.561 7
Changeable IT technical
needs of an organisation 6 18 10 4 64 38 0.561 7
Legal barriers 3 8 24 3 49 38 0.430 9
Lack of research in IT in
construction (R&D) 2 11 21 4 49 38 0.430 9
Availability of professional
software 2 11 19 6 47 38 0.412 11
Cultural influence 2 7 22 7 42 38 0.368 12
Basic competency in IT 1 8 23 6 42 38 0.368 12
Socio-economic problems 0 8 21 9 37 38 0.325 14
Lack of power supply (mainly
developing countries) 2 1 8 27 16 38 0.140 15
4.4 Improvement of e-Business
4.4.1 Internal resources
[image:22.595.111.543.464.776.2]Organisations were asked to select allthe statements that best describe their organisation’s desire to improving e-business with regard to internal resources. The responses were added together and a percentage of the responses that related to each element examined. Table 12 indicated that the best internal resource to improve e-business was the training working staff