a s s o ci a t e d wi t h s p a ti al
s t r u c t u r i n g a n d s o ci al
in t e r a c ti o n s i n s e m i-f e r al Wels h
m o u n t a i n p o ni e s
An t wi s, R E, L e a , JMD, U n w i n , B a n d S h ul t z, S
h t t p :// dx. d oi.o r g / 1 0 . 1 1 8 6 / s 4 0 1 6 8-0 1 8-0 5 9 3-2
T i t l e
G u t m i c r o bi o m e c o m p o si tio n is a s s o ci a t e d wi t h s p a ti al
s t r u c t u r i n g a n d s o ci al in t e r a c tio n s in s e m i-f e r a l Wels h
m o u n t a i n p o ni e s
A u t h o r s
An t wi s, R E, L e a, JMD, U n wi n , B a n d S h u l t z, S
Typ e
Ar ticl e
U RL
T hi s v e r si o n is a v ail a bl e a t :
h t t p :// u sir. s alfo r d . a c . u k /i d/ e p ri n t/ 4 8 8 8 9 /
P u b l i s h e d D a t e
2 0 1 8
U S IR is a d i gi t al c oll e c ti o n of t h e r e s e a r c h o u t p u t of t h e U n iv e r si ty of S alfo r d .
W h e r e c o p y ri g h t p e r m i t s , f ull t e x t m a t e r i al h el d i n t h e r e p o si t o r y is m a d e
f r e ely a v ail a bl e o nli n e a n d c a n b e r e a d , d o w nl o a d e d a n d c o pi e d fo r n o
n-c o m m e r n-ci al p r iv a t e s t u d y o r r e s e a r n-c h p u r p o s e s . Pl e a s e n-c h e n-c k t h e m a n u s n-c ri p t
fo r a n y f u r t h e r c o p y ri g h t r e s t r i c ti o n s .
R ES EAR CH
Open Access
Gut microbiome composition is associated
with spatial structuring and social
interactions in semi-feral Welsh Mountain
ponies
Rachael E. Antwis
1*, Jessica M. D. Lea
2, Bryony Unwin
1and Susanne Shultz
2Abstract
Background:Microbiome composition is linked to host functional traits including metabolism and immune function. Drivers of microbiome composition are increasingly well-characterised; however, evidence of group-level microbiome convergence is limited and may represent a multi-level trait (i.e. across individuals and groups), whereby heritable phenotypes are influenced by social interactions. Here, we investigate the influence of spatial structuring and social interactions on the gut microbiome composition of Welsh mountain ponies.
Results:We show that semi-feral ponies exhibit variation in microbiome composition according to
band (group) membership, in addition to considerable within-individual variation. Spatial structuring was also identified within bands, suggesting that despite communal living, social behaviours still influence microbiome composition. Indeed, we show that specific interactions (i.e. mother-offspring and stallion-mare) lead to more similar microbiomes, further supporting the notion that individuals influence the microbiome composition of one another and ultimately the group. Foals exhibited different microbiome composition to sub-adults and adults, most likely related to differences in diet.
Conclusions: We provide novel evidence that microbiome composition is structured at multiple levels within populations of social mammals and thus may form a unit on which selection can act. High levels of within-individual variation in microbiome composition, combined with the potential for social interactions to influence microbiome composition, suggest the direction of microbiome selection may be influenced by the individual members present in the group. Although the functional implications of this require further research, these results lend support to the idea that multi-level selection can act on microbiomes.
Keywords:16S rRNA gene, Amplicon sequencing, Harem, Horizontal transmission, Life stage, Multi-level trait, Spatial proximity, Social networks, Vertical transmission
Background
All metazoan species harbour complex communities of microorganisms referred to as host microbiomes. The host plus its microbiome can be considered as a dis-tinct biological entity, the holobiont, with a comple-mentary genome, the hologenome [1]. Although the concept of a holobiont remains a topic of debate [2,3],
there are several compelling arguments for why this approach is biologically relevant. First, microbiome composition can be heritable such that offspring microbiomes resemble those of their parents [4]. Sec-ond, microbiome genomes are much more plastic and evolvable over short periods of time than host ge-nomes, providing hosts with phenotypic plasticity that can respond more rapidly to external and internal challenges [5]. Third, these diverse communities are associated with host functional traits, such as immune function and metabolism, as demonstrated across a
* Correspondence:[email protected]
1School of Environment and Life Sciences, University of Salford, Salford, UK
Full list of author information is available at the end of the article
range of host sites for both mammalian and non-mammalian taxa [6–8]. For example, microbiome composition and complexity has been associated with disease prevalence for many host taxa at the in-dividual and population level [9–12]. Many host spe-cies have a considerable 'core' microbiome that is stable with a body site across individuals, time, and space [13–17]. This core microbiome is thought to represent the heritable "house-keeping" component of the microbiome, while there is also a flexible component to the microbiome that varies based on environmental influences [5]. At the same time, there is significant temporal variation in microbiome composition between and within individuals of a given species [18, 19].
Intriguingly, group-level microbiome similarity may represent an example of a multi-level trait, where herit-able phenotypes are influenced by association patterns [20]. In fact, social structure can lead to adaptive and evolutionary changes within the microbiome and, poten-tially, the host organism [3]. For example, social pollina-tors, such as honeybees and bumblebees, share a distinct community of bacteria not identified in solitary bee spe-cies [21]. The presence of this distinct microbiome pro-vides social bee species with protection from parasitic infection and thus confers fitness benefits not present in solitary species lacking this shared microbiome [22]. In communities, interaction patterns defined by social net-works can be used to characterise the nature of interac-tions between individuals. These networks have long been suggested to impact on transmission dynamics of disease in humans [23, 24] and animals [25,26], but so-cial interactions should also be associated with the op-portunity to share microbiomes and thus may confer fitness benefits [27].
Spatial proximity between individuals has been shown to facilitate microbiome exchange even when social behaviours are minimal. For example, gut microbiomes of solitary North American red squirrels (Tamiasciurus hudsonicus; [28]) and mouthpart microbiomes of Phofung river frog tadpoles (Amietia hymenopus; [29]) are spatially structured. Similarly, gopher tortoise (Gopherus polyphemus) gut micro-biome composition is determined by the geographic proximity of burrows, as well as home ranges and kinship [30]. If spatial proximity promotes micro-biome similarity, then social structuring determined by patterns of interaction, association and spatial proximity between individuals provides an ideal mechanism for driving subpopulation level patterns in host microbiome communities [31]. The role of social interactions in transmitting pathogens and parasites between individuals is well known; however, such be-haviours can also alter and influence the composition
of the microbiome [27]. For example, yellow baboon (Papio cynocephalus) group membership, social net-works, and grooming interactions predict the taxo-nomic structure of the gut microbiome even after controlling for the effects of diet, kinship and shared environments [32, 33]. Similarly, gut microbiomes of chimpanzees (Pan troglodytes) are associated with interaction frequency [34] and human milk micro-biomes are influenced by the size of the social net-work and physical/proximal contact with an infant [35]. Despite the growing interest in the role of social interactions in determining gut microbiome compos-ition [34, 36], the majority of studies focus on primates.
Equids provide an interesting test case for micro-biome dynamics at the subpopulation level. As hind-gut fermenters, the Equidae are particularly reliant on microbial digestion for energy and nutrition [5,
37]. Free-ranging horses (Equus ferus caballus) form harem bands (i.e. family groups) composed of (usu-ally) one mature stallion, multiple mares, and their immature offspring. Found in Snowdonia National Park, the semi-feral Carneddau pony is the closest to a wild unmanaged pony population in the UK [38,
39]. They are direct descendants of the wild Welsh mountain pony and are a genetically unique and distinct population, rendering them a high conserva-tion priority [38]. Over 300 individuals exist within smaller scattered bands that form complex social networks [38–40]. Individuals within bands engage in varying levels of affiliative behaviour with conspe-cifics dependant on various factors such as kinship, age, social status, and season. Males are socially cen-tral (i.e. well connected), while females are more peripheral and tend to have weak bonds with other mares [40]. Although female relationship strength varies between seasons, their position within the so-cial network is stable across years [40].
Methods
Study animals
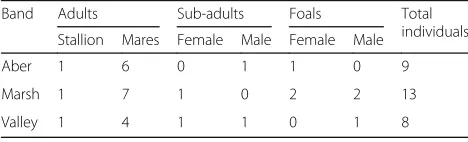
Carneddau Welsh mountain ponies are located in the Carneddau mountain range, Snowdonia National Park, North Wales (53.22°N, 3.95°W) over an area of approxi-mately 35–40 km2 of commons land between 287 and 610 m above sea level. The land is used primarily for sheep farming and recreational hiking and thus ponies are habituated to human presence but not to physical contact. The population is essentially unmanaged aside from an annual roundup event each November, during which individuals are herded onto adjacent farmland for 1 to 2 days for population monitoring and management purposes. Individuals can be identified using their age-sex classification and a photographic database that depicts coat colour, face and leg markings, and ear tags/ notches. For this study, we collected data from 30 indi-viduals across three focal bands (Aber, Marsh, and Val-ley) that have been the subjects of long-term behavioural and demographic data collection [39,40] (Table1).
Distribution mapping and social network analysis
Demography and proximity data were collected over ten sampling days between the 21 August and 14 November 2014 (the same time period when faecal sampling also occurred). All ponies included in the spatial analyses were sighted a minimum of 5 days, sampled opportunis-tically within the study area. Upon encountering a group, we recorded time, pony IDs, and GPS location along with an approximate spatial network of the ponies. We plotted the geographic distribution of the bands over the study period using the ggmap package [41] in RStu-dio (v1.0.153) [42] for R (v3.4.1) [43].
For the social network analysis, we approximated the distance in metres between individuals. All individuals less than ~ 100 m apart and moving as a cohesive unit were considered to be associated with each other [40]. Association matrices were constructed for each day of sampling; individuals that were close together (< 15 m) or interacted were given a score of 2, other individuals (i.e. those 15–100 m apart) were given a score of 1 and more than 100 m apart scored 0. Using these association scores, an overall weighted association index for each dyad was calculated using a modified version of the sim-ple ratio index [44], where edge weight was calculated as:
EAB¼ xSUM
2xCOUNTþyABþyAþyB
where xSUM is the sum of associations between indi-vidualsAandB,xCOUNT is the number of timesAand
B have been sighted together (where xCOUNT multi-plied by two is the maximum possible association score),yAB is the number of times both Aand B were
observed but not together, yA is the number of times
only individual A was seen, and yB is the number of
times onlyBwas seen.
Sample collection and 16S rRNA gene amplicon sequencing
For each band, faecal samples were collected from the stallion plus 4–7 mares and 2–5 juveniles (Table 1 and Additional file1: Table S1) between the 21st August and 11th November 2014, prior to the annual round-up. Fae-cal samples were collected using sterile gloves. Most samples were collected within 10 minutes of defecation, but on rare occasions, this took up to a maximum of 1 hour when multiple individuals defecated within a short period. Several samples were collected from differ-ent parts of the dung pile, but no faeces in contact with the ground were collected (thus, there was minimal risk of environmental contamination). The samples were mixed thoroughly by hand in a sterile bag and a sub-sample retained for analysis. Three to five sub-samples were collected per individual across the four study months (Additional file 1: Table S1). Samples were stored and transported in cool bags to the University of Manchester the same day and frozen at −80 °C prior to DNA extraction.
[image:4.595.56.290.688.759.2]DNA was extracted using the QIAamp DNA Stool Mini Kit (Qiagen, UK) following the manufacturer’s protocol with an additional incubation time of 30 min at 95 °C. A blank extraction was also included to act as a negative control for sequencing. DNA was amplified for the 16S rRNA gene (v4 region) using dual-indexed for-ward and reverse primers according to Kozich et al. [45] and Griffiths et al. [29]. Briefly, PCRs were run in dupli-cate using Solis BioDyne 5x HOT FIREPol® Blend Mas-ter Mix, 2 μM primers and 1 μl of sample DNA. Thermocycling conditions were as follows: 95 °C for 15 min; 28 cycles of (95 °C for 20 s, 50 °C for 60 s, 72 °C for 60 s), and a final extension at 72 °C for 10 min. PCR replicates were checked on an Agilent 2200 TapeStation, combined into a single PCR plate and cleaned using HighPrep™ PCR clean up beads (MagBio, USA) accord-ing to the manufacturers’ instructions. Products were quality checked using an Agilent 2200 TapeStation and quantified using a Qubit™ 3.0 Fluorometer according to the manufacturers’ protocol. Samples were pooled according to concentrations in order to minimise
Table 1Demographic data for each band used in this study
Band Adults Sub-adults Foals Total
individuals Stallion Mares Female Male Female Male
Aber 1 6 0 1 1 0 9
Marsh 1 7 1 0 2 2 13
sequencing bias. Paired-end (2×250 bp) amplicon se-quencing was conducted on an Illumina MiSeq platform with negative and positive (mock community) controls.
Pre-processing of microbiome data
We conducted all analyses in RStudio (v1.0.153) [42] for R (v3.4.1) [43]. A total of 3,208,334 raw sequence reads from 112 samples were generated during sequencing. We conducted sequence processing in dada2 v1.5.0 [46] using the default pipeline (see Additional files 1, 2, 3, and4). Modal contig length was 253 bp once paired-end reads were merged. We removed sequence variants (SVs) with length > 260 bp (4 SVs; 0.086% of total se-quences) along with chimeras and two SVs found in the negative controls, leaving an average of 22,294 reads per sample (range 8071–42,869). We assigned taxonomy using the SILVA v128 database [47, 48]. To provide greater taxonomic detail about unidentified SVs and to stop the removal of these during analyses that agglomer-ate to a given taxonomic level, we fully annotagglomer-ated the taxonomy table to species level using higher levels as-signments (e.g. SV1 was named “Family_Prevotellaceae”
at the genus and species levels). We exported the final SV table, taxonomy table, and sample metadata to the phyloseq package [49] and converted the data to relative abundance for further analyses.
Microbiome variation according to ID
We produced an NMDS plot in phyloseq using the Bray-Curtis distance matrix to visualise the variation within and between individuals according to community composition. To determine the microbiome variation at-tributable to individual variation (ID), we conducted a permutational ANOVA (PERMANOVA; adonis) in the vegan package [50].
We calculated the core microbiome of individual sam-ples using a detection threshold of 0.001% and a preva-lence threshold of 99.9% (i.e. a given SV must be present in 99.9% of individuals with a relative abundance of at least 0.001%) in the microbiome package [51]. We used an NMDS plot to visualise the variation in core micro-biome according to ID and analysed the data using an adonis analysis (as above).
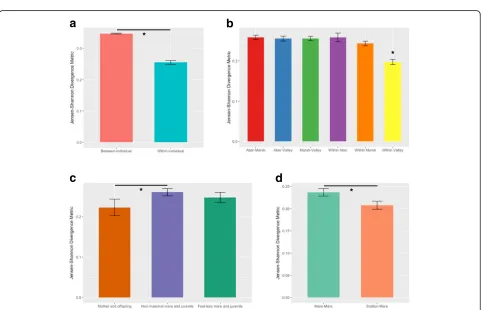
To determine whether there was greater microbiome variation within an individual than between individuals, we calculated Jensen-Shannon Divergence (JSD) values in the phyloseq package [49]. JSD values give a measure of similarity between all individual samples (i.e. by calculat-ing the distance between samples) either from the same individual (i.e. within-individual variation) or from differ-ent individuals in the same band (i.e. between-individual variation). Smaller JSD values indicate more similar mi-crobial communities and conversely, larger values indicate a less similar community. We used a generalised linear
mixed model with ID and band as random factors to com-pare JSD distances within individuals to JSD distances be-tween individuals and visualised the data using a bar chart.
Microbiome variation according to band, life stage, and sex
We categorised individuals under the age of 1 year as foals and for older individuals, females < 2 years old and males < 3 years old as sub-adults (females are usually re-productively mature from 2 years onwards but males take longer to mature, disperse, and attract mares). We classified all others as adults, with the exception of one female who still displayed sub-adult behaviours, did not disperse from her natal band, and had not foaled by age 3, and so was considered a sub-adult. We visualised the taxonomic composition (at the class level) of the com-munities according to band and life stage using stacked plots in phyloseq [49] and ggplot2 [52].
To obtain the“average microbiome” for an individual, we merged raw sample data within an individual using the merge_samples function in phyloseq (using “fun = mean”) [49]. To determine whether there was greater microbiome variation between bands than within bands, we calculated Jensen-Shannon Divergence (JSD) values between individuals using data from their average micro-biome, as described above. We used a one-way ANOVA with Tukey’s post hoc analysis to compare JSD distances within and between bands and visualised the data using a bar chart.
We produced NMDS plots in phyloseq using the Bray-Curtis distance matrix to visualise differences in beta diversity according to band and life stage. We used an adonis analysis to test for significant effects of band, life stage, and sex on total microbiome community com-position. We then calculated the core microbiome as de-scribed above and repeated the adonis analysis for this core community. Additionally, we agglomerated the core taxa to genus level and visualised the core microbiome as a heat map to give a representation of the bacterial taxa present.
To identify differences in microbiome composition be-tween foals (which at approximately 5–8 months old, were most likely still nursing) and sub-adults (which were most likely fully weaned), we conducted an indica-tor analysis using the multipatt function in the indicspe-cies package [53].
Effects of spatial structuring and social interactions on the microbiome
using the igraph package [54] with edges weighted by ei-ther microbiome similarity (the inverse of the NMDS dis-tance) or the association index as described above. As the microbiome distance matrix is fully connected, we delated edges with a similarity less than the mean value for the population. We calculated JSD values between merged samples in the phyloseq package [49] and used general lin-ear mixed models (with ID and band as random factors) to identify whether mares had more similar microbiomes to other mares within the same band or to the band stal-lion and whether mares had more similar microbiomes to their own offspring than to other mares’offspring within the same band. We visualised these using bar charts.
Results
Bacteria primarily belonged to the Bacteroidia, Clos-tridia, Spirochaetes, and Fibrobacteria classes (Bacteroi-detes, Fibrobacteres, Firmicutes, and Spirochaetae phyla) (Additional file 1: Figure S1 and S2). The dominant families represented in the core microbiome were anaer-obic bacteria associated with grass-eating mammals, in-cluding Prevotellaceae, Ruminococcaceae, Rikenellaceae, Lachnospiraceae, Spirochaetaceae, Fibrobacteraceae, Chris-tensenallaceae, Erysipelotrichaceae, Acidaminococcaceae, and various groups of Bacteroidales.
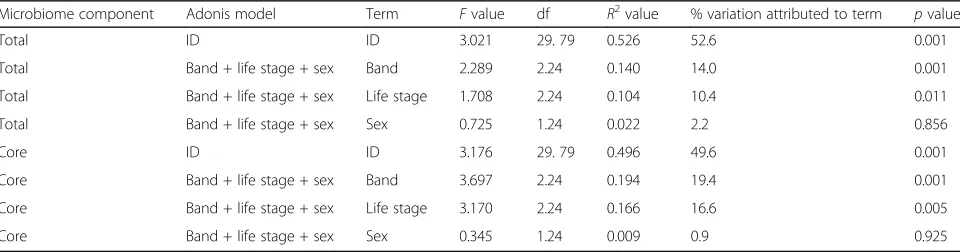
An adonis analysis showed pony ID had a significant ef-fect on total microbiome composition (p< 0.001; Table2), with 52.6% of the variation in the microbiome attributable to individual variation (Fig.1). We obtained similar results for the adonis with the core microbiome (p< 0.001; Table 2), with 49.6% of the variation explained by ID. Despite the large amount of microbiome variation ex-plained by ID, within-individual samples had significantly lower JSD values (mean of 0.255 ± 0.006) than between-in-dividual samples (mean of 0.347 ± 0.001) (χ2= 391.62, df =
1,p< 0.001) (Fig.2a). That is, there is greater variation be-tween individuals (average of 35%) than within individuals (average of 26%).
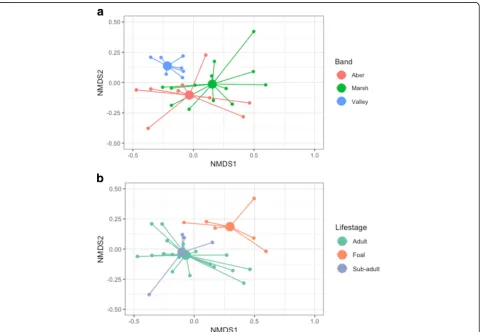
There were significant effects of band and life stage on total microbiome composition, but not sex (Table 2, Fig. 3a and b). In both cases, the proportion of the
variation in the microbiome for these significant factors (14.0% for band and 10.4% for life stage) was much lower than for pony ID alone (52.6%). The results of the adonis analysis for the core microbiome were similar to those for the total microbiome, where band and life stage both significantly affected core microbiome com-position, but sex did not (Table 2). Band and life stage account for a slightly larger proportion of the variation in the core microbiome (19.4% and 16.6%, respectively) than the total microbiome.
Consistent with the spatial distribution of the bands (Fig. 4a), microbiome composition of individuals in Val-ley differed considerably to those in Aber and Marsh, which are more similar to each other but still display some degree of separation (Fig.3a). There was a signifi-cant difference in JSD metric values within and between the bands (F5,424= 6.557, p< 0.001), and the Tukey
post-hoc indicated that within-band variation for Valley was significantly lower than the variation within the other two bands, and significantly lower than between-band variation for all three combinations (Fig.2b). In addition to this band-level differentiation of microbiomes, there was a significant correlation between social network tie weight (i.e. spatial distribution) and microbiome com-position (τ=−0.11, p< 0.001) within bands, such that individuals that associate more have more similar micro-biomes (Fig.4b, c).
The microbiome of foals was considerably different from that of sub-adults and adults, whereas these latter two groups were very similar to one another (Fig. 3b and Additional file 1: Figure S2). An indicator analysis identified six bacterial genera (out of a possible 188) that were significantly associated (p< 0.05) with sub-adults compared with foals;Prevotellaceae Ga6A1 group, Deni-trobacterium, Oscillibacter, Anaerovibrio, Famil-y_CR-115, and Anaerostipes. There were no genera significantly (i.e. uniquely) associated with foals com-pared with sub-adults.
Maternal relationship had a significant effect on micro-biome similarity (χ2= 8.425, df = 2, p= 0.015; Fig. 2c).
[image:6.595.58.538.631.757.2]Pairwise comparisons showed significant differences in
Table 2Statistical outputs for adonis analyses of microbiome composition
Microbiome component Adonis model Term Fvalue df R2value % variation attributed to term pvalue
Total ID ID 3.021 29. 79 0.526 52.6 0.001
Total Band + life stage + sex Band 2.289 2.24 0.140 14.0 0.001
Total Band + life stage + sex Life stage 1.708 2.24 0.104 10.4 0.011
Total Band + life stage + sex Sex 0.725 1.24 0.022 2.2 0.856
Core ID ID 3.176 29. 79 0.496 49.6 0.001
Core Band + life stage + sex Band 3.697 2.24 0.194 19.4 0.001
Core Band + life stage + sex Life stage 3.170 2.24 0.166 16.6 0.005
Fig. 1NMDS plot of the total microbiome of individual ponies in the study. Larger filled circles indicate the centroid for each individual
a
c
b
d
[image:7.595.57.540.113.373.2] [image:7.595.58.540.410.720.2]microbiome divergence between mother-offspring rela-tionships and non-maternal mares and juveniles (foals and sub-adults combined) (p= 0.017). Microbiome diver-gences between foal-less mares and juveniles were not sig-nificantly different to those of mother-offspring relationships (p= 0.313) or non-maternal mares and juve-niles (p= 1.000). Mares had significantly more similar
microbiomes to the band stallion than the other mares in their band (χ2= 4.206, df = 1,p= 0.040; Fig.2d).
Discussion
The effects of population structuring, in general, and so-cial interactions, in particular, on microbiome compos-ition remains poorly understood; challenges often arise
Fig. 3NMDS plots of the total microbiome of ponies plotted according to band membership (a) and life stage (b). Larger filled circles indicate group centroids
a
b
c
[image:8.595.59.539.112.444.2] [image:8.595.57.539.581.728.2]in the separation of direct microbiota transmission via social interactions from effects of communal living such as a shared diet or physical environment [27, 32]. Here, we show that despite large variation between individuals in microbiome composition, spatial structuring, social relationships (i.e. mother-offspring and stallion-mare), and network ties account for microbiome similarities. The main predictor of microbiome composition is indi-vidual identity (pony ID), accounting for around 50% of microbiome variation, with ~26% variation across mul-tiple samples collected for each individual and ~34% variation between individuals. Significant inter-individual variation in microbiome composition has been shown in other species [18,19,28,55–57]. Given that such a large component of microbiome variation is due to individual ID, which individuals are present in the band (both mares and stallions) may well influence the composition of the total group microbiome.
Band membership also predicted microbiome compos-ition, with ~ 14% of the total microbiome variation and ~ 19% of the core microbiome variation explained by this factor. That the microbiome composition of ponies belonging to Aber and Marsh are more similar to one another than Valley may be driven by both spatial struc-turing and diet, given that the home ranges of these bands overlap. The home ranges of Aber and Marsh are also somewhat different to that of Valley in terms of ele-vation, slope, and soil moisture; these are more low-lying and marshier in comparison to the steeper, more well-drained, and exposed slopes that charac-terised the home range of Valley during the study period. The type and quality of grasses or forage across the study area (approximately 5 km2) also vary according to
habitat type and thus, diet quality may be driving the ob-served differences in bands. In addition, variation in browsing behaviour may be driving differences in micro-biome composition between individuals. Dietary com-position has been shown to affect the microbiome of vertebrates, with consequences for microbiome function and fitness traits such as reproductive success [37, 56,
58–60]. The microbiome of Equidae is highly susceptible to changes in diet with implications for nutrient assimi-lation [37] and diet can have a significant effect on population performance [61]. Microbes acquired from the environment (horizontal transfer) are likely to have greater genomic variation than vertically transmitted symbionts and thus may provide greater variation for microbiome-derived functional advantages [5]. Thus, spatial variation in microbial communities between sub-populations may have implications for fitness traits [5]. Aber and Marsh also showed higher within-band ation, comparable in magnitude to between-band vari-ation, whereas Valley had significantly lower microbiome variation within the band. This may reflect the spatial
and environmental differences experienced by members of Valley compared with Aber and Marsh, as well as fewer interactions between Valley and the other two bands. This lower microbiome variation across the group as a whole may have implications for group-level fitness. More work is required to understand how group-level microbiome variation relates to population resilience [27].
Although it may be difficult to dissociate between the influence of shared living and diet on microbiome com-position between bands, we also identified spatial struc-turing of microbiome composition within bands, suggesting that despite communal living, social behav-iours still influence microbiome composition. Social be-haviours, such as grooming, that occur between members of the same band provide an opportunity for individuals to share microbial communities. Moreover, close spatial proximity also promotes the sharing of gut microbiomes through contact with recently deposited faeces, including potential coprophagy [62]. Thus, microbiomes of individuals with close social ties are more likely to converge and, indeed, our data show that specific interactions (i.e. mother-offspring and stallion-mare) lead to more similar microbiomes. This further supports the notion that individuals influence the microbiome composition of one another and ultim-ately the group. Affiliative behaviours occur more fre-quently between mothers and their offspring than between foals and non-maternal mares, but vertical transmission of microbiomes between mothers and their foals may also derive from birth and during nursing [35,
quickly these converge and whether microbial signatures of the original band remain. It would also be of interest to compare the microbiome composition of males in bachelor groups to those of stallions to further deter-mine the propensity for mares to alter stallion microbiomes.
Although we can estimate similarity between micro-bial communities across bands and individuals, we do not yet know how this relates to functional variation or fitness proxies at the subpopulation (i.e. band) level. Genetic determinants of microbiome composition, and thus the heritability of microbiomes, have been demonstrated across a range of host taxa [4, 29, 30,
57]. That band-level differences in microbiome com-position were also significant in the core microbiome further supports the notion that group-level selection may occur within host microbiomes. However, disper-sal of individuals between bands means that subpopu-lations are not genetically isolated. To further understand the potential for microbiome to act as a unit that selection can act on, it would be valuable to quantify the relative contributions of genetic, environ-mental, and social factors that determine microbiome composition within this system (and across a range of hosts) and to link these to fitness outcomes such as reproductive success and disease susceptibility.
We also demonstrate differences between life stages in microbiome composition of Carneddau ponies; foals had considerably different microbiome composition to both sub-adults and adults. Similar changes in microbiome composition across host development have been seen in other host organisms [10, 29, 65]. For mammals, this is particularly evident for nursing young compared with weaned individuals [66–68], and this most likely explains the results we see in our data. There was an absence of unique genera in the microbiome of foals, indicating the transition to a grass-based diet leads to the assimilation of additional bacterial groups into the gut microbiome, potentially through environmental transmission. Al-though gut microbiome composition has been shown to differ between sexes [69], we found that microbiomes were not significantly different between males and fe-males for this population of semi-feral ponies. However, this may reflect a low number of males in the analysis. It would be of interest to follow changes in male micro-biome across dispersion and particularly shifts in com-position as stallions form new family groups and their microbiome is influenced by, and influences, new mares joining their band.
Conclusions
Here, we show that semi-feral ponies exhibit variation in microbiome composition between bands, which may relate to social, dietary, and environmental factors. In addition,
due to the high level of within-individual variation, the dir-ection of group seldir-ection may be influenced by the individ-ual members present in the band. Spatial structuring was also identified within bands, suggesting that despite com-munal living, social behaviours still influence microbiome composition. We identify two such interactions; mother-offspring and stallion-mare, that lead to more simi-lar microbiomes, indicating that individuals influence the microbiome composition of one another and ultimately the group. Thus, we provide novel evidence that microbiome composition is structured at multiple levels within popula-tions. The functional implications of this require further research.
Additional files
Additional file 1:Table S1.Ponies from which data were collected in the study.Figure S1.Relative abundance of bacterial classes identified in the faecal samples of ponies belonging to the three study bands.Figure S2.Relative abundance of bacterial classes identified in the faecal samples of juvenile and adult ponies.Figure S3.Relative abundance of genera in the core microbiome. (PDF 273 kb)
Additional file 2:Microbiome analysis code as an RMarkdown file. (RMD 29 kb)
Additional file 3:Additional code for maps and network analysis. (RMD 6 kb)
Additional file 4:Sample sheet. (CSV 4 kb)
Acknowledgements
The authors would like to thank BEI Resources (Human Microbiome project) for supplying the mock community used in this study.
Funding
SS is supported by a Royal Society University Research Fellowship. JMDL was supported by a University of Manchester faculty studentship.
Availability of data and materials
The datasets generated and analysed for this study are available in the NCBI SRA repository under BioProject PRJNA478495 (https://www.ncbi.nlm.nih.gov/ bioproject/478495), SRA accession number SRP151639. All R code is available as Rmd files in Additional files2and3.
Authors’contributions
RA, JL, and SS conceived the study. JL and RA collected the samples. BU and RA conducted the lab work. RA, JL, and SS analysed the data. BU, SS, JL, and RA wrote and revised the paper. All authors read and approved the final manuscript.
Ethics approval and consent to participate
This study was approved by the University of Salford Research, Innovation, and Academic Engagement Ethical Approval Panel (ST1617-83) and the University of Manchester (Cat-D; non-licenced procedure).
Consent for publication
Not applicable.
Competing interests
The authors declare that they have no competing interests.
Publisher’s Note
Author details
1School of Environment and Life Sciences, University of Salford, Salford, UK. 2School of Earth and Environmental Sciences, University of Manchester,
Manchester, UK.
Received: 24 July 2018 Accepted: 7 November 2018
References
1. Bordenstein SR, Theis KR. Host biology in light of the microbiome: ten principles of holobionts and hologenomes. PLoS Biol. 2015;13:1–23. 2. Douglas AEW. Holes in the hologenome: why host-microbe symbioses are
not holobionts. MBio. 2016;7:1–7.
3. Rosenberg E, Zilber-Rosenberg I. The hologenome concept of evolution after 10 years. Microbiome. 2018;6:78.
4. Blekhman R, Goodrich JK, Huang K, Sun Q, Bukowski R, Bell JT, et al. Host genetic variation impacts microbiome composition across human body sites. Genome Biol. 2015;16:1–12.
5. Shapira M. Gut microbiotas and host evolution: scaling up symbiosis. Trends Ecol Evol. 2016;31:539–49.
6. Fitzpatrick CR, Copeland J, Wang PW, Guttman DS, Kotanen PM, Johnson MTJ. Assembly and ecological function of the root microbiome across angiosperm plant species. Proc Natl Acad Sci. 2018;115:E1157–65 201717617.
7. Hanning I, Diaz-Sanchez S. The functionality of the gastrointestinal microbiome in non-human animals. Microbiome. 2015;3:51.
8. Morgan XC, Kabakchiev B, Waldron L, Tyler AD, Tickle TL, Milgrom R, et al. Associations between host gene expression, the mucosal microbiome, and clinical outcome in the pelvic pouch of patients with inflammatory bowel disease. Genome Biol. 2015;16:1–15.
9. McKenna P, Hoffmann C, Minkah N, Aye PP, Lackner A, Liu Z, et al. The macaque gut microbiome in health, lentiviral infection, and chronic enterocolitis. PLoS Pathog. 2008;4:e20.
10. Arrieta M-C, Stiemsma LT, Amenyogbe N, Brown EM, Finlay B. The intestinal microbiome in early life: health and disease. Front Immunol. 2014;5:1–18. 11. Bates KA, Clare FC, O’Hanlon S, Bosch J, Brookes L, Hopkins K, et al.
Amphibian chytridiomycosis outbreak dynamics are linked with host skin bacterial community structure. Nat Commun. 2018;9:1–11.
12. Jack ALH, Nelson EB. A seed-recruited microbiome protects developing seedlings from disease by altering homing responses of Pythium aphanidermatum zoospores. Plant Soil. 2018;422:209–22.
13. Turnbaugh PJ, Hamady M, Yatsunenko T, Cantarel BL, Duncan A, Ley RE, et al. A core gut microbiome in obese and lean twins. Nature. 2009;457:480–5.
14. Huse SM, Ye Y, Zhou Y, Fodor AA. A core human microbiome as viewed through 16S rRNA sequence clusters. PLoS One. 2012;7:1–12.
15. Kueneman JG, Parfrey LW, Woodhams DC, Archer HM, Knight R, McKenzie VJ. The amphibian skin-associated microbiome across species, space and life history stages. Mol Ecol. 2014;23:1238–50.
16. Loudon AH, Woodhams DC, Parfrey LW, Archer H, Knight R, McKenzie V, et al. Microbial community dynamics and effect of environmental microbial reservoirs on red-backed salamanders (plethodon cinereus). ISME J. 2014;8:830–40.
17. Laforest-Lapointe I, Messier C, Kembel SW. Host species identity, site and time drive temperate tree phyllosphere bacterial community structure. Microbiome. 2016;4:1–10.
18. Falony G, Joossens M, Vieira-Silva S, Wang J, Darzi Y, Faust K, et al. Population-level analysis of gut microbiome variation. Science. 2016; 352:560–4.
19. Laforest-Lapointe I, Messier C, Kembel SW. Tree phyllosphere bacterial communities: exploring the magnitude of intra- and inter-individual variation among host species. PeerJ. 2016;4:e2367.
20. Bijma P. Multilevel selection 2: estimating the genetic parameters determining inheritance and response to selection. Genetics. 2007;175:289–99.
21. Martinson VG, Danforth BN, Minckley RL, Rueppell O, Tingek S, Moran NA. A simple and distinctive microbiota associated with honey bees and bumble bees. Mol Ecol. 2011;20:619–28.
22. Koch H, Schmid-Hempel P. Socially transmitted gut microbiota protect bumble bees against an intestinal parasite. Proc Natl Acad Sci. 2011;108: 19288–92.
23. Eubank S, Guclu H, VSA K, Marathe MV, Srinivasan A, Toroczkai Z, et al. Modeling disease outbreaks in realistic urban social networks†. Nonlinear Stud. 2004;429(6988):180.
24. Read JM, Eames KTD, Edmunds WJ. Dynamic social networks and the implications for the spread of infectious disease. J R Soc Interface. 2008; 5:1001–7.
25. Naug D. Structure of the social network and its influence on transmission dynamics in a honeybee colony. Behav Ecol Sociobiol. 2008;62:1719–25. 26. Krause J, Croft DP, James R. Social network theory in the behavioural
sciences: potential applications. Behav Ecol Sociobiol. 2007;62:15–27. 27. Archie EA, Tung J. Social behavior and the microbiome. Curr Opin Behav
Sci. 2015;6:28–34.
28. Ren T, Boutin S, Humphries MM, Dantzer B, Gorrell JC, Coltman DW, et al. Seasona, spatial, and maternal effects on gut microbiome in wild red squirrels. Microbiome. 2017;5:1–14.
29. Griffiths SM, Harrison XA, Weldon C, Wood MD, Pretorius A, Hopkins K, et al. Genetic variability and ontogeny predict microbiome structure in a disease-challenged montane amphibian. ISME J. 2018;12:2506–17.
30. Yuan ML, Dean SH, Longo AV, Rothermel BB, Tuberville TD, Zamudio KR. Kinship, inbreeding and fine-scale spatial structure influence gut microbiota in a hindgut-fermenting tortoise. Mol Ecol. 2015;24:2521–36.
31. Lombardo MP. Access to mutualistic endosymbiotic microbes: an underappreciated benefit of group living. Behav Ecol Sociobiol. 2008; 62:479–97.
32. Tung J, Barreiro LB, Burns MB, Grenier JC, Lynch J, Grieneisen LE, et al. Social networks predict gut microbiome composition in wild baboons. elife. 2015;2015:1–18.
33. Grieneisen LE, Livermore J, Alberts S, Tung J, Archie EA. Group living and male dispersal predict the core gut microbiome in wild baboons. Integr Comp Biol. 2017;57:770–85.
34. Moeller AH, Foerster S, Wilson ML, Pusey AE, Hahn BH, Ochman H. Social behavior shapes the chimpanzee pan-microbiome. Sci Adv. 2016; 2:e1500997.
35. Meehan CL, Mcguire MK, Lackey KA, Hagen EH, Williams JE, Roulette J, et al. Social networks, cooperative breeding, and the human milk microbiome. Am J Hum Biol. 2018;e23131.
36. Lize A, McKay R, Lewis Z. Gut microbiota and kin recognition. Trends Ecol Evol. 2013;28:325–6.
37. Julliand V, Grimm P. The impact of diet on the hindgut microbiome. J Equine Vet Sci Elsevier Inc. 2017;52:23–8.
38. Winton CL, Hegarty MJ, Mcmahon R, Slavov GT, Mcewan NR, Davies-Morel MCG, et al. Genetic diversity and phylogenetic analysis of native mountain ponies of Britain and Ireland reveals a novel rare population. Ecol Evol. 2013;3:934–47.
39. Stanley CR, Shultz S. Mummy’s boys: sex differential maternal-offspring bonds in semi-feral horses. Behaviour. 2012;149:251–74.
40. Stanley CR, Mettke-Hofmann C, Hager R, Shultz S. Social stability in semiferal ponies: networks show interannual stability alongside seasonal flexibility. Anim Behav. 2018;136:175–84.
41. Kahle D, Wickham H. ggmap: spatial visualization with ggplot2. R J. 2013;5:144–61.
42. RStudio Team. RStudio: integrated development for R. Boston: p. RStudio, Inc.; 2016. URLhttps://www.rstudio.com/
43. R Core Team. R: a language and environment for statistical computing. Vienna: R Foundation for Statistical Computing; 2017. URLhttps://www. R-project.org/
44. Farine DR, Whitehead H. Constructing, conducting and interpreting animal social network analysis. J Anim Ecol. 2015;84:1144–63.
45. Kozich JJ, Westcott SL, Baxter NT, Highlander SK, Schloss PD. Development of a dual-index sequencing strategy and curation pipeline for analyzing amplicon sequence data on the miseq illumina sequencing platform. Appl Environ Microbiol. 2013;79:5112–20.
46. Callahan BJ, McMurdie PJ, Rosen MJ, Han AW, Johnson AJA, Holmes SP. DADA2: high-resolution sample inference from Illumina amplicon data. Nat Methods. 2016;13:581–3.
47. Quast C, Pruesse E, Yilmaz P, Gerken J, Schweer T, Yarza P, et al. The SILVA ribosomal RNA gene database project: improved data processing and web-based tools. Nucleic Acids Res. 2013;41:590–6.
49. McMurdie PJ, Holmes S. Phyloseq: an R package for reproducible interactive analysis and graphics of microbiome census data. PLoS One. 2013;8:e61217. 50. Oksanen J, Blanchet B, Friendly M, Kindt R, Legendre P, McGlinn D, et al.
Vegan: community ecology package. 2018.
51. Lahti Leo, Shetty S. Tools for microbiome analysis in R. Microbiome package version 1.1.10013. 2017.http://microbiome.github.com/microbiome. 52. Wickham H. ggplot2: elegant graphics for data analysis. New York:
Springer-Verlag; 2009.
53. De CM, Legendre P. Associations between species and groups of sites: \nindices and statistical inference. Ecology. 2009;90:3566–74. 54. Csárdi G, Nepusz T. The igraph software package for complex network
research. InterJournal Complex Syst. 2006;1695:1695.
55. Yatsunenko T, Rey FE, Manary MJ, Trehan I, Dominguez-Bello MG, Contreras M, et al. Human gut microbiome viewed across age and geography. Nature. 2012;486:222–7.
56. Wang J, Linnenbrink M, Künzel S, Fernandes R, Nadeau M-J, Rosenstiel P, et al. Dietary history contributes to enterotype-like clustering and functional metagenomic content in the intestinal microbiome of wild mice. Proc Natl Acad Sci. 2014;111:E2703–10.
57. Carmody RN, Gerber GK, Luevano JM, Gatti DM, Somes L, Svenson KL, et al. Diet dominates host genotype in shaping the murine gut microbiota. Cell Host Microbe. 2015;17:72–84.
58. Ben-Yosef M, Behar A, Jurkevitch E, Yuval B. Bacteria-diet interactions affect longevity in the medfly - Ceratitis capitata. J Appl Entomol. 2008;132:690–4. 59. Antwis RE, Haworth RL, Engelmoer DJP, Ogilvy V, Fidgett AL, Preziosi RF. Ex situ diet influences the bacterial community associated with the skin of red-eyed tree frogs (Agalychnis callidryas). PLoS One. 2014;9:e85563.
60. Gavriel S, Jurkevitch E, Gazit Y, Yuval B. Bacterially enriched diet improves sexual performance of sterile male Mediterranean fruit flies. J Appl Entomol. 2011;135:564–73.
61. Lea JMD, Kerley GIH, Hrabar H, Barry TJS. Recognition and management of ecological refugees: a case study of the cape mountain zebra. Biol Conserv. 2016;203:207–15.
62. Ransom JI, Cade BS. Quantifying equid behavior—a research ethogram for free-roaming feral horses. Geological Survey Techniques and Methods. 2009;2-A9:23.
63. Dominguez-Bello MG, Costello EK, Contreras M, Magris M, Hidalgo G, Fierer N, et al. Delivery mode shapes the acquisition and structure of the initial microbiota across multiple body habitats in newborns. Proc Natl Acad Sci. 2010;107:11971–5.
64. Duranti S, Lugli GA, Mancabelli L, Armanini F, Turroni F, James K, et al. Maternal inheritance of bifidobacterial communities and bifidophages in infants through vertical transmission. Microbiome. 2017;5:1–13.
65. Prest ATL, Kimball AK, Kueneman JG, McKenzie VJ. Host associated bacterial community succession during amphibian development. Mol Ecol. 2018;27: 1992–2006.
66. Meale SJ, Li S, Azevedo P, Derakhshani H, Plaizier JC, Khafipour E, et al. Development of ruminal and fecal microbiomes are affected by weaning but not weaning strategy in dairy calves. Front Microbiol. 2016;7:1–16. 67. Koenig JE, Spor A, Scalfone N, Fricker AD, Stombaugh J, Knight R, et al.
Succession of microbial consortia in the developing infant gut microbiome. Proc Natl Acad Sci. 2011;108:4578–85.
68. Frese SA, Parker K, Calvert CC, Mills DA. Diet shapes the gut microbiome of pigs during nursing and weaning. Microbiome. 2015;3:28.
69. JašarevićE, Morrison KE, Bale TL. Sex differences in the gut