International Journal of Emerging Technology and Advanced Engineering
Website: www.ijetae.com (ISSN 2250-2459, ISO 9001:2008 Certified Journal, Volume 8, Issue 9, September 2018)Quality Consideration of Processed Wheat Soya Blend (WSB)
Products in Bangladesh in the Framework of Process Capability
Sixpack
Md. Anwar Hossain
Planning and Development Division, Bangladesh Council of Scientific and Industrial Research, Dr. Qudrat-I-Khuda Road, Dhanmondi, Dhaka-1205, Bangladesh.
Abstract-- The industrially processed pack Wheat Soya Blend (WSB) Products analysed data were collected from different analytical sections of Institute of Food Science and Technology (IFST), Bangladesh Council of Scientific and Industrial Research (BCSIR), Dhaka over the year 2007 to 2012 by Single Stage Cluster Sampling method. Popular statistical qualitative technique process capability sixpack were used to analyze the physiochemical and microbial observational data. The Figure 1 to 8 shows that most of the Wheat Soya Blend (WSB) parameters of the different period are in the process out of control. Also the results showed that we are dealing with a normally distributed and stable process that most of the parameters ware not follows a Normal distribution as well as symmetric distribution.
Keywords: Single Stage Cluster Sampling; physiochemical and microbial observational data; Normal distribution; Symmetric distribution; process out of control.
I. INTRODUCTION
Fortified Blended Foods (FBFs) are blends of partially precooked and milled cereals, soya, beans, pulses fortified with micronutrients (vitamins and minerals). Special formulations may contain vegetable oil or milk powder. Corn Soya Blend (CSB) is the main blended food distributed by WFP but Wheat Soya Blend (WSB) is also sometimes used. FBFs are designed to provide protein supplements. In food assistance programs to prevent and address nutritional deficiencies. They are generally used in WFP Supplementary Feeding and Mother and Child Health programs. Also, to provide extra micronutrients to complement the general ration. Usually mixed with water and cooked as a porridge [21].
II. A.DESCRIPTION OF WHEAT SOYA BLEND (WSB)
Wheat Soya Blend is a product preferred for young children aged 6 months – 2 years.
The product is to be used as a complement to breastfeeding. The product is not a breast-milk replacer. Super Cerealplus is prepared from heat treated wheat and de-hulled soya beans, sugar, dried skim milk, refined soya bean oil, vitamins and minerals. If Super Cereal plus- Wheat Soya Blend is consumed as a porridge or gruel, it should be prepared by mixing an appropriate proportion of flour and clean water (i.e. 50g of Super Cereal plus- Wheat Soya Blend with 250 g of water) followed by a boiling time at simmering point from five to ten minutes. Super Cerealplus- Wheat Soya Blendshall be manufactured from fresh wheat grain and soy beans of good quality, free from foreign materials, substances hazardous to health, excessive moisture, insect damage and fungal contamination and shall comply with all relevant national food laws and standards. Sugar, dried milk powder and soya bean oil shall be of optimal food quality and meet the Codex standards for these commodities [1].
International Journal of Emerging Technology and Advanced Engineering
Website: www.ijetae.com (ISSN 2250-2459, ISO 9001:2008 Certified Journal, Volume 8, Issue 9, September 2018)It was used to examine multiple measures of experience and their relationship to the performance of work teams[4], the impact of adopting Six Sigma on corporate performance[20], and also in manufacturing execution
systems (MESs)[8], in information security risk
management (ISRM)[18] and in a knowledge management system[13].
This study has provide information about the quality of Wheat Soya Blend products. The result of the study will help to establish the fundamental principle of ‗Food Safety‘. Applying statistical technique to the data and learn from each other variation and fit of the technique. To evaluate and test the physiochemical characteristics of processed Wheat Soya Blend products using statistical models that examines whether the food products are acceptable or not on the basis of the norms as prescribed by the national or international food standard organization.
III. MATERIALS AND METHODS
A. Selection Of The Six Sigma Tools
There are many quality and problem solving tools from which to choose. The seven basic quality tools were selected because there are the most commonly known, promoted, and used of the quality tools[5]. These seven tools[10, 11, 14, 22] are;
Cause and effect diagram: A schematic tool that resembles a fishbone that lists causes and sub-causes as they relate to a concern, also known as fishbone diagram or Ishikawa diagram.
Check sheet: A form used to collect, organize, and categorize data so it can be easily used for further analysis.
Histogram: A graphic display of the number of times a value occurs.
Pareto diagram: A bar chart that organizes the data from largest to smallest to direct attention on the important items (usually the biggest contributors).
Process flow diagram: A graphical illustration of the actual process.
Scatter diagram: A graphical tool that plots one characteristic against another to understand the relationship between the two.
SPC control chart: A graph of time-ordered data that predicts how a process should behave.
The other tools selected for the matrix are the quality and organizational tools from the Six Sigma operation[3, 6, 7, 10, 11, 16, 22]. Alphabetically, these tools are;
Box plot: A graphical display fo data in a box format that displays the median and variation of the data.
Capability analysis: A calculation used establish the proportion of the operating window taken up by the natural variation of the process.
Control plan: A written description of the systems for controlling parts and processes.
Cost benefit analysis: A summary analysis that weighs the cost of improvement to the customer against the cost of the change to the process.
DOE: A systematic set of experiments that permit the evaluation of the effect of one or more factors on the response.
Failure mode and effects analysis (FMEA): A structured approach to identify the way the product or process can fail and eliminate or reduce the risk of failure to protect the customer.
Hypothesis testing: Data driven tests that answer the question: ―Is there a real difference between A and B?‖ using relatively small sample sizes to answer questions about the population.
Process flow diagram: A graphical illustration of the actual process.
Thought process map: A graphical representation of the logical sequence in which the Black Belt will solve the problem using Six Sigma methodology.
Trend/run chart: A graphical display of data over time to understand what the process is doing based on the pattern of the data[23].
B. Data
International Journal of Emerging Technology and Advanced Engineering
Website: www.ijetae.com (ISSN 2250-2459, ISO 9001:2008 Certified Journal, Volume 8, Issue 9, September 2018)IV. RESULTS AND DISCUSSION
A. Application Of Control Charts On Wheat Soya Blend (WSB)
In order to verify whether quality of food products were under control condition or not we have adopted following control chart of Wheat Soya Blend (WSB) for such purposes we have used several Shewhart Control Charts. In this works we present results and analysis that is application of control charts. We show the results and analysis by type of products and types of control chart.
B. Process Capability Analysis (Using Normal Distribution Curve)
In this case, we want to assess the process capability for different industries producing certain Wheat Soya Blend (WSB).
The proximate analysis of the Wheat Soya Blend (WSB) is of concern. The specification limits on the Wheat Soya Blend (WSB) are in given appendix 4. There has been a consistent problem with meeting the specification limits and the some process produces a high percentage of rejects. The histogram of the data shows that proximate analysis of Wheat Soya Blend (WSB) follow a normal distribution or approximately normal distribution. The variation from Wheat Soya Blend (WSB) toWheat Soya Blend (WSB) can be estimated using the within group standard deviation. Since the process is stable and the measurements are normally or approximately normality distributed, the normal distribution option of process capability analysis can be used.
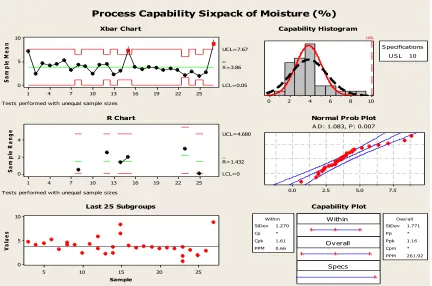
[image:3.612.92.524.358.644.2]Quality characteristic: Moisture
Figure 1: Quality Control Charts and Process Capability Analysis for Moisture (%) of Wheat Soya Blend (WSB).
25 22 19 16 13 10 7 4 1 10
5 0
S
a
m
p
le
M
e
a
n
_ _ X=3.86 UCL=7.67
LCL=0.05
25 22 19 16 13 10 7 4 1 4 2 0
S
a
m
p
le
R
a
n
g
e
_ R=1.432 UCL=4.680
LCL=0
25 20
15 10
5 10
5 0
Sample
V
a
lu
e
s
10 8 6 4 2 0
USL
U S L 10 S pecifications
7.5 5.0 2.5
0.0
W ithin
Ov erall
Specs
StDev 1.270 Cp * Cpk 1.61 PPM 0.66 Within
StDev 1.771 Pp * Ppk 1.16 Cpm * PPM 261.92
Overall 1
1
Process Capability Sixpack of Moisture (%)
Xbar Chart
Tests performed with unequal sample sizes
R Chart
Tests performed with unequal sample sizes
Last 25 Subgroups
Capability Histogram
Normal Prob Plot
A D : 1.083, P : 0.007
International Journal of Emerging Technology and Advanced Engineering
Website: www.ijetae.com (ISSN 2250-2459, ISO 9001:2008 Certified Journal, Volume 8, Issue 9, September 2018)The quality control and process capability analysis chart given as output is the chart of Moisture (%). These charts, which are pretty much self-explanatory, clearly shows the date wise sample point along with the (UCL and LCL) control limits. It is clear that the process is out of control in the control limit in mean chart.
The upper right box reports the process data including the upper specification limit. The calculated values are the process sample mean and the estimates of standard deviations.
Figure 1 shows the histogram of the data along with normal curves overlaid on the histogram. Moisture % of Wheat Soya Blend (WSB) products exceed the Upper specification limit (USL). An insignificant percentage of the Moisture (%) of Wheat Soya Blend (WSB) is outside of Upper Specification Limit.
From the Normal probability plot in Fig. 1, the Normality test shows that reject the null hypothesis, H0:
data follow a Normal distribution vs. H1: data do not follow
a Normal distribution, at the 0.05 significance level. This is due to the fact that the p-value is 0.007, which is less than 0.05 a frequently used level of significance for such a hypothesis test, as opposed to the more traditional 0.05 significance level.
The potential or within process capability of the process is reported on the right hand side. The value of Cpk =1.61 is greater than 1 means that the process is centered and capable.
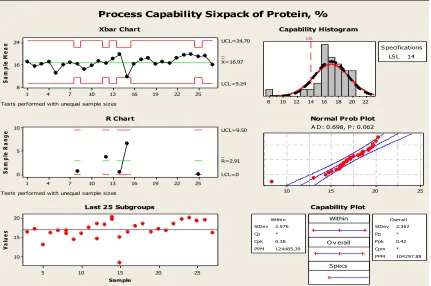
[image:4.612.93.524.351.637.2]Quality characteristic: Protein
Figure 2: Quality Control Charts and Process Capability Analysis for Protein, % of Wheat Soya Blend (WSB).
25 22 19 16 13 10 7 4 1 24 16 8
S
a
m
p
le
M
e
a
n
_ _ X=16.97 UCL=24.70
LCL=9.24
25 22 19 16 13 10 7 4 1 10
5 0
S
a
m
p
le
R
a
n
g
e
_ R=2.91 UCL=9.50
LCL=0
25 20
15 10
5 20 15 10
Sample
V
a
lu
e
s
22 20 18 16 14 12 10 8
LSL
LS L 14 S pecifications
25 20
15 10
Within
O v erall
S pecs
StDev 2.576 Cp * Cpk 0.38 PPM 124485.39
Within
StDev 2.362 Pp * Ppk 0.42 Cpm * PPM 104297.88
Overall
Process Capability Sixpack of Protein, %
Xbar Chart
Tests performed with unequal sample sizes
R Chart
Tests performed with unequal sample sizes
Last 25 Subgroups
Capability Histogram
Normal Prob Plot
A D : 0.698, P : 0.062
International Journal of Emerging Technology and Advanced Engineering
Website: www.ijetae.com (ISSN 2250-2459, ISO 9001:2008 Certified Journal, Volume 8, Issue 9, September 2018)The quality control and process capability chart given as output is the chart of Protein, %. These charts, which are pretty much self-explanatory, clearly shows the date wise sample point along with the (UCL and LCL) control limits. It is clear that the process is under control.
The upper right box reports the process data including the lower specification limit. The calculated values are the process sample mean and the estimates of standard deviations.
Figure 2 shows the histogram of the data along with normal curves overlaid on the histogram. Protein, % of Wheat Soya Blend (WSB) products are exceeding the lower specification limit (USL). A significant percentage of the Protein, % of Wheat Soya Blend (WSB) is outside Lower Specification Limit.
From the Normal probability plot in Figure 2, the Anderson-Darling (AD) Normality test shows that reject the null hypothesis, H0: data follow a Normal distribution
vs. H1: data do not follow a Normal distribution, at the α =
0.05 significance level. This is due to the fact that the p-value for the A-D test is 0.062, which is greater than 0.05 - a frequently used level of significance for such a hypothesis test, The necessary assumptions appear to have been fulfilled and investigate the capability of this process, as shown in Figure 2.
The potential or within process capability of the process is reported on the right hand side. The value of Cpk =0.38 is less than 1 means that the process is off centered and not capable.
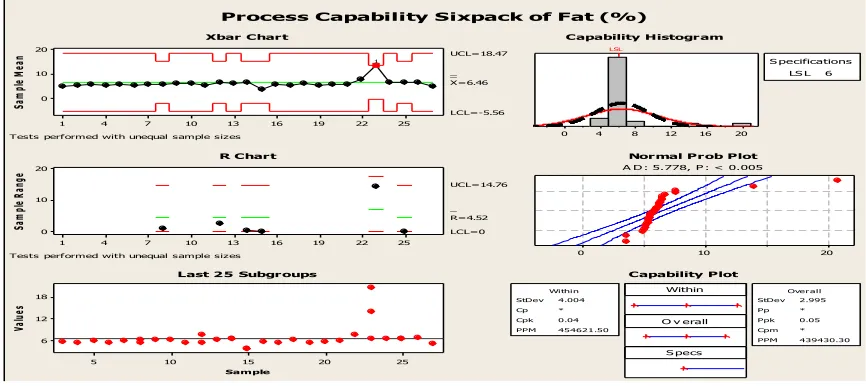
[image:5.612.89.522.352.545.2]Quality Characteristic: Fat, %
Figure 3: Quality Control Charts and Process Capability Analysis for Fat, % of Wheat Soya Blend (WSB).
The quality control and process capability chart given as output is the chart of Total Ash (on dry basis), %. These charts, which are pretty much self-explanatory, clearly shows the date wise sample point along with the (UCL and LCL) control limits. It is clear that the process is in of control except only a point outside upper control limit.
The upper right box reports the process data including the upper specification limit. The calculated values are the process sample mean and the estimates of standard deviations.
Figure 3 shows the histogram of the data along with normal curves overlaid on the histogram. Fat, % of Wheat Soya Blend (WSB) products are exceeding the Upper specification limit (USL). A significant percentage of the Fat, % of Wheat Soya Blend (WSB) is outside Upper Specification Limit.
From the Normal probability plot in Fig. 3, the Normality test shows that reject the null hypothesis, H0:
data follow a Normal distribution vs. H1: data do not follow
a Normal distribution, at the 0.05 significance level.
25 22 19 16 13 10 7 4 1 20
10
0
Sa
m
ple
M
ea
n
_ _ X=6.46 UCL=18.47
LCL=-5.56
25 22 19 16 13 10 7 4 1 20
10
0
Sa
m
ple
R
an
ge
_ R=4.52 UCL=14.76
LCL=0
25 20
15 10
5 18
12
6
Sample
Va
lue
s
20 16 12 8 4 0
LSL
LS L 6 S pecifications
20 10
0
Within O v erall
S pecs StDev 4.004
Cp * Cpk 0.04 PPM 454621.50
Within
StDev 2.995 Pp * Ppk 0.05 Cpm * PPM 439430.30
Over all 1
Process Capability Sixpack of Fat (%)
Xbar Char t
Tests performed with unequal sample sizes
R Char t
Tests performed with unequal sample sizes
Last 25 Subgr oups
Capability Histogr am
Nor mal Pr ob Plot
A D : 5.778, P : < 0.005
International Journal of Emerging Technology and Advanced Engineering
Website: www.ijetae.com (ISSN 2250-2459, ISO 9001:2008 Certified Journal, Volume 8, Issue 9, September 2018)This is due to the fact that the p-value is 0.005, which is less than 0.05 a frequently used level of significance for such a hypothesis test, as opposed to the more traditional 0.05 significance level.
The potential or within process capability of the process is reported on the right hand side. The value of Cpk =0.04 is less than 1 means that the process is off centered and not capable.
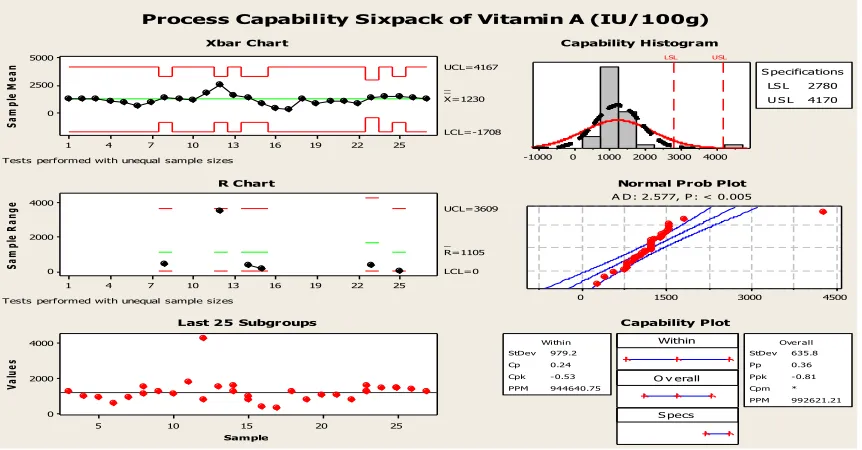
[image:6.612.93.524.232.457.2]Quality Characteristic: Vitamin A (IU/100g)
Figure 4: Quality Control Charts and Process Capability Analysis for Vitamin A (IU/100g) of Wheat Soya Blend (WSB).
The quality control chart given as output is the chart of Vitamin A (IU/100g). These charts, which are pretty much self-explanatory, clearly shows the date wise sample point along with the (UCL and LCL) control limits. It is clear that the process is under control.
The upper right box reports the process data including the upper specification limit. The calculated values are the process sample mean and the estimates of within standard deviations.
Figure 4 shows the histogram of the data along with normal curves overlaid on the histogram. The products of Wheat Soya Blend (WSB) of Vitamin A (IU/100g) analysis report by this process exceed the lower specification limit (LSL) and Upper specification limit (USL). A significant percentage of the Vitamin A (IU/100g) of Wheat Soya Blend (WSB) is outside of lower specification limit (LSL) and Upper Specification Limit.
From the Normal probability plot in Fig. 4, the Normality test shows that reject the null hypothesis, H0:
data follow a Normal distribution vs. H1: data do not follow
a Normal distribution, at the ≤ 0.05 significance level. This is due to the fact that the p-value is 0.005, which is less than 0.05 a frequently used level of significance for such a hypothesis test, as opposed to the more traditional 0.05 significance level.
The potential or within process capability of the process is reported on the right hand side. The value of Cpk =-0.53 is less than 1 means that the process is off centered and is not capable.
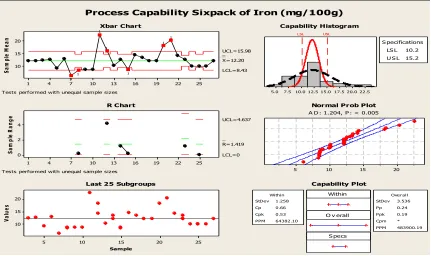
Quality Characteristic: Iron (mg/100g)
25 22 19 16 13 10 7 4 1 5000 2500 0
Sa
m
pl
e
M
ea
n
_ _ X=1230 UCL=4167
LCL=-1708
25 22 19 16 13 10 7 4 1 4000 2000 0
Sa
m
pl
e
Ra
ng
e
_ R=1105 UCL=3609
LCL=0
25 20
15 10
5 4000 2000 0
Sample
Va
lu
es
4000 3000 2000 1000 0 -1000
LSL USL
LS L 2780 U S L 4170 S pecifications
4500 3000
1500 0
Within O v erall
S pecs
StDev 979.2
Cp 0.24
Cpk -0.53
PPM 944640.75
Within
StDev 635.8
Pp 0.36
Ppk -0.81
Cpm *
PPM 992621.21
Overall
Process Capability Sixpack of Vitamin A (IU/100g)
Xbar Chart
Tests performed with unequal sample sizes
R Chart
Tests performed with unequal sample sizes
Last 25 Subgroups
Capability Histogram
Normal Prob Plot
A D : 2.577, P : < 0.005
International Journal of Emerging Technology and Advanced Engineering
Website: www.ijetae.com (ISSN 2250-2459, ISO 9001:2008 Certified Journal, Volume 8, Issue 9, September 2018)Figure 5: Quality Control Charts and Process Capability Analysis for Iron (mg/100g) of Wheat Soya Blend (WSB).
The quality control chart given as output is the chart of Iron (mg/100g). These charts, which are pretty much self-explanatory, clearly shows the date wise sample point along with the (UCL and LCL) control limits. It is clear that the process is out of control.
The upper right box reports the process data including the upper specification limit. The calculated values are the process sample mean and the estimates of within standard deviations.
Figure 5 shows the histogram of the data along with normal curves overlaid on the histogram. Iron (mg/100g) of Wheat Soya Blend (WSB) products exceed the Lower specification limit (LSL) and upper specification limit (USL). A significant percentage of the Iron (mg/100g) (%) of Wheat Soya Blend (WSB) is outside of Lower Specification Limit and upper specification limit (USL).
From the Normal probability plot in Fig. 5, the Normality test shows that we reject the null hypothesis, H0:
data follow a Normal distribution vs. H1: data do not follow
a Normal distribution, at the 0.05 significance level. This is due to the fact that the p-value is 0.005, which is less than 0.05 a frequently used level of significance for such a hypothesis test, as opposed to the more traditional 0.05 significance level.
The potential or within process capability of the process is reported on the right hand side. The value of Cpk =-0.53 is less than 1 means that the process is off centered and is not capable.
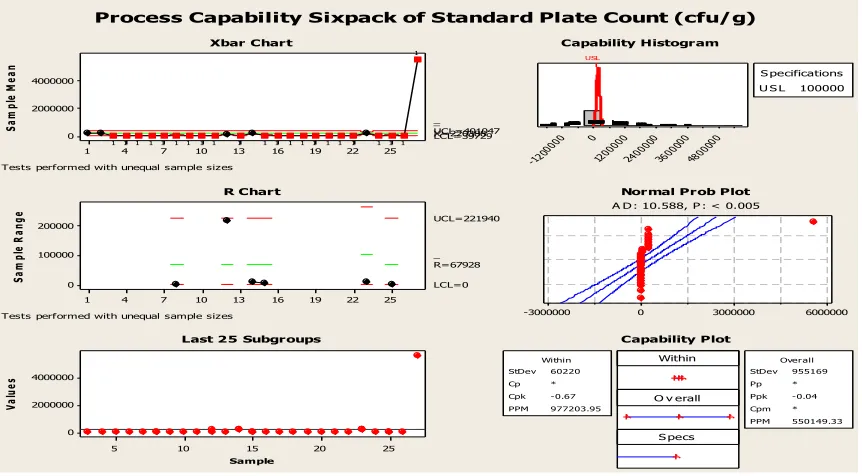
Quality Characteristic: Standard Plate Count (cfu/g)
25 22 19 16 13 10 7 4 1 20 15 10
Sa
m
pl
e
M
ea
n
_ _ X=12.20 UCL=15.98 LCL=8.43
25 22 19 16 13 10 7 4 1 4 2 0
Sa
m
pl
e
R
an
ge
_ R=1.419 UCL=4.637
LCL=0
25 20
15 10
5 20 15 10
Sample
Va
lu
es
22.5 20.0 17.5 15.0 12.5 10.0 7.5 5.0
LSL USL
LS L 10.2 U S L 15.2 S pecifications
20 15
10 5
Within O v erall
S pecs
StDev 1.258 Cp 0.66 Cpk 0.53 PPM 64382.10
Within
StDev 3.536 Pp 0.24 Ppk 0.19 Cpm * PPM 483900.19
Overall
1 1
1 1 1
1 1
Process Capability Sixpack of Iron (mg/100g)
Xbar Chart
Tests performed with unequal sample sizes
R Chart
Tests performed with unequal sample sizes
Last 25 Subgroups
Capability Histogram
Normal Prob Plot
A D : 1.204, P : < 0.005
International Journal of Emerging Technology and Advanced Engineering
Website: www.ijetae.com (ISSN 2250-2459, ISO 9001:2008 Certified Journal, Volume 8, Issue 9, September 2018)Figure 6: Quality Control Charts and Process Capability Analysis for Standard Plate Cournt (cfu/g) of Wheat Soya Blend (WSB).
The quality control chart given as output is the chart of Standard Plate Cournt (cfu/g). These charts, which are pretty much self-explanatory, clearly shows the date wise sample point along with the (UCL and LCL) control limits. It is clear that the process is out of control.
The upper right box reports the process data including the lower specification limit. The calculated values are the process sample mean and the estimates of standard deviations.
Figure 6 shows the histogram of the data along with normal curves overlaid on the histogram. Standard Plate Count of Wheat Soya Blend (WSB) products are exceeding the Upper specification limit (USL). A significant percentage of the Standard Plate Count (cfu/g) of Wheat Soya Blend (WSB) is outside Upper Specification Limit.
From the Normal probability plot in Fig. 6, the Normality test shows that reject the null hypothesis, H0:
data follow a Normal distribution vs. H1: data do not follow
a Normal distribution, at the ≤ 0.05 significance level. This is due to the fact that the p-value is 0.005, which is less than 0.05 a frequently used level of significance for such a hypothesis test, as opposed to the more traditional 0.05 significance level.
The potential or within process capability of the process is reported on the right hand side. The value of Cpk =-0.67 is less than 1 means that the process is off centered and is not capable.
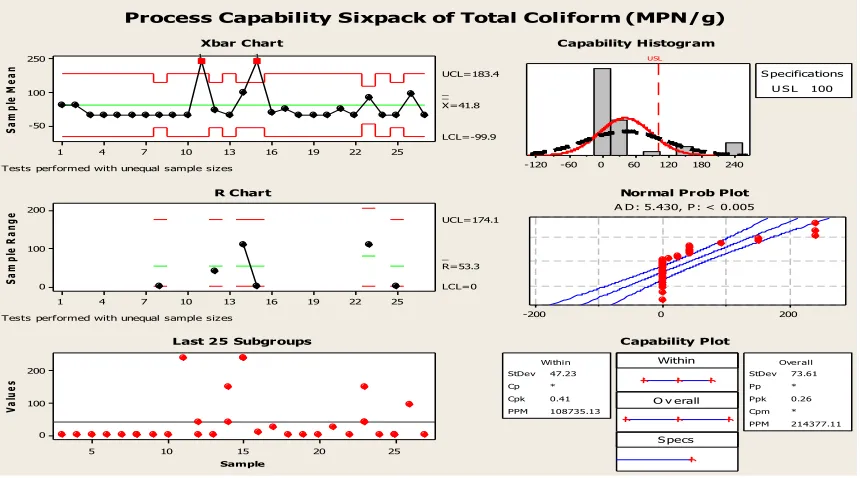
Quality Characteristic: Total Coliform (MPN/g)
25 22 19 16 13 10 7 4 1 4000000 2000000 0
Sa
m
pl
e
M
ea
n
_ _ X=220388 UCL=401047 LCL=39729
25 22 19 16 13 10 7 4 1 200000 100000 0
Sa
m
pl
e
R
an
ge
_ R=67928 UCL=221940
LCL=0
25 20
15 10
5 4000000 2000000 0
Sample
Va
lu
es
4800 000 3600
000 2400
000 1200
000 0
-1200 000
USL
U S L 100000 S pecifications
6000000 3000000
0 -3000000
Within O v erall
S pecs
StDev 60220
Cp *
Cpk -0.67
PPM 977203.95
Within
StDev 955169
Pp *
Ppk -0.04
Cpm *
PPM 550149.33
Overall 1
1 1 1 1 1 1 1 1 1 1 1 1 1 1 1 1 1 1 1 1 1
Process Capability Sixpack of Standard Plate Count (cfu/g)
Xbar Chart
Tests performed with unequal sample sizes
R Chart
Tests performed with unequal sample sizes
Last 25 Subgroups
Capability Histogram
Normal Prob Plot
A D : 10.588, P : < 0.005
International Journal of Emerging Technology and Advanced Engineering
Website: www.ijetae.com (ISSN 2250-2459, ISO 9001:2008 Certified Journal, Volume 8, Issue 9, September 2018)Figure 7: Quality Control Charts and Process Capability Analysis for Total Coliform (MPN/g) of Wheat Soya Blend (WSB).
The quality control chart given as output is the chart of Total Coliform (MPN/g). These charts, which are pretty much self-explanatory, clearly shows the date wise sample point along with the (UCL and LCL) control limits. It is clear that the process is out of control.
The upper right box reports the process data including the upper specification limit. The calculated values are the process sample mean and the estimates of standard deviations.
Figure 7 shows the histogram of the data along with normal curves overlaid on the histogram. Total Coliform of Wheat Soya Blend (WSB) products exceed the Upper specification limit (USL). A significant percentage of the Total Coliform (MPN/g) of Wheat Soya Blend (WSB) is outside Upper Specification Limit.
From the Normal probability plot in Fig. 7, the Normality test shows that reject the null hypothesis, H0:
data follow a Normal distribution vs. H1: data do not follow
a Normal distribution, at the 0.05 significance level. This is due to the fact that the p-value is 0.005, which is less than 0.05 a frequently used level of significance for such a hypothesis test, as opposed to the more traditional 0.05 significance level.
The potential or within process capability of the process is reported on the right hand side. The value of Cpk =0.41 is less than 1 means that the process is off centered and is not capable.
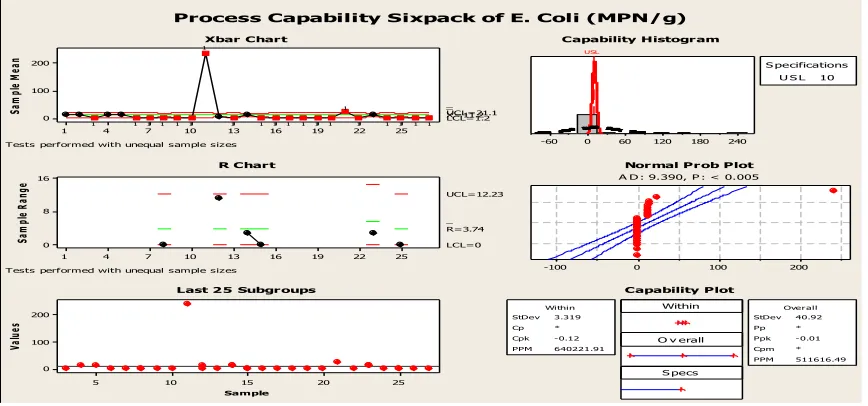
Quality Characteristic: Escherichia Coli (MPN/g)
25 22 19 16 13 10 7 4 1 250 100 -50
Sa
m
pl
e
M
ea
n
_ _ X=41.8 UCL=183.4
LCL=-99.9
25 22 19 16 13 10 7 4 1 200 100 0
Sa
m
pl
e
R
an
ge
_ R=53.3 UCL=174.1
LCL=0
25 20
15 10
5 200 100 0
Sample
Va
lu
es
240 180 120 60 0 -60 -120
USL
U S L 100 S pecifications
200 0
-200
Within O v erall
S pecs
StDev 47.23
Cp *
Cpk 0.41
PPM 108735.13
Within
StDev 73.61
Pp *
Ppk 0.26
Cpm *
PPM 214377.11
Overall 1
1
Process Capability Sixpack of Total Coliform (MPN/g)
Xbar Chart
Tests performed with unequal sample sizes
R Chart
Tests performed with unequal sample sizes
Last 25 Subgroups
Capability Histogram
Normal Prob Plot
A D : 5.430, P : < 0.005
International Journal of Emerging Technology and Advanced Engineering
Website: www.ijetae.com (ISSN 2250-2459, ISO 9001:2008 Certified Journal, Volume 8, Issue 9, September 2018)Figure 8: Quality Control Charts and Process Capability Analysis for E. Coli (MPN/g) of Wheat Soya Blend (WSB).
The quality control chart given as output is the chart of
E. Coli (MPN/g). These charts, which are pretty much self-explanatory, clearly shows the date wise sample point along with the (UCL and LCL) control limits. It is clear that the process is in out of control.
The upper right box reports the process data including the upper specification limit. The calculated values are the process sample mean and the estimates of within standard deviations.
Figure 8 shows the histogram of the data along with normal curves overlaid on the histogram. E. Coli of Wheat Soya Blend (WSB) products exceed the Upper specification limit (USL). A significant percentage of the E. Coli (MPN/g) of Wheat Soya Blend (WSB) is outside Upper Specification Limit.
From the Normal probability plot in Fig. 8, the Normality test shows that reject the null hypothesis, H0:
data follow a Normal distribution vs. H1: data do not follow
a Normal distribution, at the 0.05 significance level. This is due to the fact that the p-value is 0.005, which is less than 0.05 a frequently used level of significance for such a hypothesis test, as opposed to the more traditional 0.05 significance level.
The potential or within process capability of the process is reported on the right hand side. The value of Cpk =-0.12 is less than 1 means that the process is off centered and is not capable.
The Figure 1 to 8 shows that most of the Wheat Soya Blend (WSB) parameters of the different period are inthe process out of control. Also the results showed that we are dealing with a normally distributed and stable process that most of the parameters ware not follows a Normal distribution as well as symmetric distribution.
V. CONCLUSIONS
The results of process capability sixpack study of the given Wheat Soya Blend (WSB) analysis results reveals that, graphical presentsted of parameters approaches very nearer to the magnitude of the analytical values and hence graphical approach could be treated as equivalent to analytical method. Graphical approach can be used to study the variability of foods analysis data. It is one ofthe tools to convey the results through which it is easy to make inference on the quality of data. The approach helps a stakeholder of the food to make the assessment about the analyzed parameters. Thus, it also helps to process management and identifies opportunities for improvement quality and operational performance [17]. The estimation of process capability is one of the basic tasks of the statistical process control (SPC). The values of Cp, Cpk indices are very precise information on a process potential relating to the client‘sexpectations. Correct determination of Cp, Cpk indices values requires identification of a distribution size, atleast as a general settlement whether it is a normal distributionor not.
25 22 19 16 13 10 7 4 1 200
100
0
Sa
m
pl
e
M
ea
n
_ _ X=11.2 UCL=21.1 LCL=1.2
25 22 19 16 13 10 7 4 1 16
8
0
Sa
m
pl
e
Ra
ng
e
_ R=3.74 UCL=12.23
LCL=0
25 20
15 10
5 200
100
0
Sample
Va
lu
es
240 180 120 60 0 -60
USL
U S L 10 S pecifications
200 100
0 -100
Within O v erall
S pecs
StDev 3.319
Cp *
Cpk - 0.12
PPM 640221.91
Within
StDev 40.92
Pp *
Ppk - 0.01
Cpm *
PPM 511616.49
Over all
1 1 1 1 1 1 1 1 1 1 1 1 1 1
1 1 1 1 1 1
Process Capability Sixpack of E. Coli (MPN/g) Xbar Chart
Tests performed with unequal sample sizes
R Chart
Tests performed with unequal sample sizes
Last 25 Subgroups
Capability Histogram
Normal Prob Plot
A D : 9.390, P : < 0.005
International Journal of Emerging Technology and Advanced Engineering
Website: www.ijetae.com (ISSN 2250-2459, ISO 9001:2008 Certified Journal, Volume 8, Issue 9, September 2018)If it is a normal distribution, for the estimation of Cp,Cpk this can use a simple classic approach that isbased on the rule of three standard deviations. If it is not a normal distribution, the application of a classic approach leadsto wrong results [2].
Acknowledgments
I would like to thank Authority of Bangladesh Council of Scientific and Industrial Research (BCSIR) for gives an opportunity to use of analytical service data and Ministry of Science and Technology to allocate research fund.
REFERENCES
[1] Alimentarius, C. and Control, C. 2015. Super cereal Plus. 1987, (2015).
[2] Czarski, A. 2008. Estimation of process capability indices in case of distribution unlike the normal one. Archives of Materials Science and Engineering. 34, 1 (2008), 39–42.
[3] Duncan, W. 1995. Total Quality: Key terms and concepts. (1995). [4] Easton, G.S. and Rosenzweig, E.D. 2012. The role of experience in
six sigma project success: An empirical analysis of improvement projects. Journal of Operations Management. 30, 7–8 (2012), 481– 493.
[5] Gabor, A. 1990. The man who discovered quality; how Deming WE, Brought the Quality Revolution to America. Random House Inc. [6] Harry, M.J. 1997. Six Sigma: the breakthrough management strategy
revolutionizing the world‘s top corporations. TriStar Publishing. [7] Hart, M.K. 1992. Quality tools for decreasing variation and defining
process capability. Production and Inventory Management Journal. 33, 2 (1992), 6.
[8] Hwang, Y.-D. 2006. The practices of integrating manufacturing execution systems and Six Sigma methodology. The International Journal of Advanced Manufacturing Technology. 31, 1–2 (2006), 145–154.
[9] Institute of Food Science and Technology (IFST), B.C. of S. and I.R. (BCSIR) 2010. Approval for adhoc data use. Institute of Food Science and Technology (IFST), Bangladesh Council of Scientific and Industrial Research (BCSIR), Dhaka.
[10] Ishikawa, K. 1987. Guide to quality control. ordica International Limited.
[11] Juran, J. and Gryna, F.M. 1988. Juran1s Quality Control Handbook. NY: McGraw-Hill. (1988).
[12] Kumar, U.D. 2008. Six Sigma—Status and Trends. Handbook of Performability Engineering. Springer. 225–234.
[13] Lin, C., Chen, F.F., Chen, Y.M. and Kuriger, G. 2013. Continuous improvement of knowledge management systems using Six Sigma methodology. Robotics and Computer-Integrated Manufacturing. 29, 3 (2013), 95–103.
[14] LLC, N.N.N.S.C. 2000. Six Sigma process black belt training. 1999 sigma consultants.
[15] De Mast, J. and Lokkerbol, J. 2012. An analysis of the Six Sigma DMAIC method from the perspective of problem solving. International Journal of Production Economics. 139, 2 (2012), 604– 614.
[16] Pearn, W.L., Kotz, S. and Johnson, N.L. 1992. Distributional and inferential properties of process capability indexes. Journal of Quality Technology. 24, 4 (1992), 216–231.
[17] Prabhuswamy, M.S. and Nagesh, P. 2007. Process capability analysis made simple through graphical approach. Kathmandu University Journal of Science, Engineering and Technology. I, III (2007), 1–10.
[18] Saleh, M.S. and Alfantookh, A. 2011. A new comprehensive framework for enterprise information security risk management. Applied computing and informatics. 9, 2 (2011), 107–118.
[19] Seltman, H.J. 2012. Experimental design and analysis. Online at: http://www. stat. cmu. edu/, hseltman/309/Book/Book. pdf. (2012). [20] Shafer, S.M. and Moeller, S.B. 2012. The effects of Six Sigma on
corporate performance: An empirical investigation. Journal of Operations Management. 30, 7–8 (2012), 521–532.
[21] Specialized nutritious foods | WFP | United Nations World Food Programme - Fighting Hunger Worldwide: https://www.wfp.org/nutrition/special-nutritional-products. Accessed: 2016-05-31.
[22] Strong and Rath 2000. Six Sigma pocket guide, rath & strong management consultants.
[23] TABAK, Ş. 2009. The six sigma and an application in a manufacturing firm. (2009).
[24] Taguchi, G., Clausing, D. and Watanabe, L. 1987. System of experimental design: engineering methods to optimize quality and minimize costs.
[25] Valles, A., Sanchez, J., Noriega, S. and Nuñez, B.G. 2009. Implementation of Six Sigma in a Manufacturing Process : A Case Study. 16, 3 (2009), 171–181.