comm
en
t
re
v
ie
w
s
re
ports
de
p
o
si
te
d r
e
se
a
rch
refer
e
e
d
re
sear
ch
interacti
o
ns
inf
o
rmation
Derivation of genetic interaction networks from quantitative
phenotype data
Becky L Drees
¤
, Vesteinn Thorsson
¤
, Gregory W Carter
¤
,
Alexander W Rives, Marisa Z Raymond, Iliana Avila-Campillo,
Paul Shannon and Timothy Galitski
Address: Institute for Systems Biology, 1441 N. 34th Street, Seattle, WA 98103, USA. ¤ These authors contributed equally to this work.
Correspondence: Timothy Galitski. E-mail: [email protected]
© 2005 Drees et al.; licensee BioMed Central Ltd.
This is an Open Access article distributed under the terms of the Creative Commons Attribution License (http://creativecommons.org/licenses/by/2.0), which permits unrestricted use, distribution, and reproduction in any medium, provided the original work is properly cited.
Yeast genetic interaction networks
<p>Genetic interaction networks were derived from quantitative phenotype data by analyzing agar-invasion phenotypes of mutant yeast strains, which showed specific modes of genetic interaction with specific biological processes.</p>
Abstract
We have generalized the derivation of genetic-interaction networks from quantitative phenotype data. Familiar and unfamiliar modes of genetic interaction were identified and defined. A network was derived from agar-invasion phenotypes of mutant yeast. Mutations showed specific modes of genetic interaction with specific biological processes. Mutations formed cliques of significant mutual information in their large-scale patterns of genetic interaction. These local and global interaction patterns reflect the effects of gene perturbations on biological processes and pathways.
Background
Phenotypes are determined by complex interactions among gene variants and environmental factors. In biomedicine, these interacting elements take various forms: inherited and somatic human gene variants and polymorphisms, epigenetic effects on gene activity, environmental agents, and drug ther-apies including drug combinations. The success of predictive, preventive, and personalized medicine will require not only the ability to determine the genotypes of patients and to clas-sify patients on the basis of molecular fingerprints of tissues. It will require an understanding of how genetic perturbations interact to affect clinical outcome. Recent advances afford the capability to perturb genes and collect phenotype data on a genomic scale [1-7]. To extract the biological information in these datasets, parallel advances must be made in concepts and computational methods to derive and analyze
genetic-interaction networks. We report the development and appli-cation of such concepts and methods.
Results and discussion
Phenotype data and genetic interaction
A genetic interaction is the interaction of two genetic pertur-bations in the determination of a phenotype. Genetic interac-tion is observed in the relainterac-tion among the phenotypes of four genotypes: a reference genotype, the 'wild type'; a perturbed genotype, A, with a single genetic perturbation; a perturbed genotype, B, with a perturbation of a different gene; and a doubly perturbed genotype, AB. Gene perturbations may be of any form (such as null, loss-of-function, gain-of-function, and dominant-negative). Also, two perturbations can interact in different ways for different phenotypes or under different environmental conditions.
Published: 31 March 2005
Genome Biology 2005, 6:R38 (doi:10.1186/gb-2005-6-4-r38)
Received: 3 December 2004 Revised: 4 February 2005 Accepted: 1 March 2005 The electronic version of this article is the complete one and can be
Geneticists recognize biologically informative modes of genetic interaction, for example, epistasis and synthesis. These two modes can illustrate the general properties of genetic interactions. An epistatic interaction occurs when two single mutants have different deviant (different from wild-type) phenotypes, and the double mutant shows the pheno-type of one of the single mutants. Analysis of epistatic inter-actions can reveal direction of information flow in molecular pathways [8]. If we represent a phenotype of a given geno-type, X, as ΦX, then we can write a phenotype inequality rep-resenting a specific example of epistatic genetic interaction, for example, ΦA < ΦWT < ΦB = ΦAB. Likewise, a synthetic inter-action occurs when two single mutants have a wild-type phe-notype and the double mutant shows a deviant phephe-notype, for example, ΦWT = ΦA = ΦB < ΦAB. Synthetic interactions reveal mechanisms of genetic 'buffering' [1,9].
Some modes of genetic interaction are symmetric; other modes are asymmetric. This symmetry or asymmetry is evi-dent in phenotype inequalities, and is biologically informa-tive. Epistasis illustrates genetic-interaction asymmetry. If mutation A is epistatic to B, then B is hypostatic to A. The asymmetry of epistasis, and the form of the mutant alleles (gain or loss of function), indicates the direction of biological information flow [8]. Conversely, synthetic interactions are symmetric. If mutation A is synthetic with B, then B is syn-thetic with A. The symmetry of genetic synthesis reflects the mutual requirement for phenotype buffering [1,9].
The representation of genetic interactions as phenotype ine-qualities accommodates all possibilities without assumptions about how genetic perturbations interact. In addition, it demands quantitative (or at least ordered) phenotypes. In principle, all phenotypes are measurable; complex pheno-types (for example, different cell-type identities) are amalga-mations of multiple underlying phenotypes. There is a total of 75 possible phenotype inequalities for WT, A, B, and AB. Using a hybrid approach combining the mathematical prop-erties of phenotype inequalities and familiar genetic-interac-tion concepts and nomenclature, the 75 phenotype inequalities were grouped into nine exclusive modes of genetic interaction, some of which are genetically asymmetric (Additional data file 1). This approach can be extended to the interactions of more than two perturbations as well. The nine interaction modes include familiar ones: noninteractive, epi-static, synthetic, conditional, suppressive, and additive; and modes that certainly occur but, to our knowledge, have not been previously defined: asynthetic, single-nonmonotonic, and double-nonmonotonic. All interaction modes are defined in the Materials and methods; brief descriptions follow for the unfamiliar (previously undefined) modes. In asynthetic inter-action, A, B, and AB all have the same deviant phenotype. In single-nonmonotonic interaction, a mutant gene shows oppo-site effects in the WT background and the other mutant back-ground (for example, ΦWT < ΦA and ΦAB < ΦB). In
double-nonmonotonic interaction, both mutant genes show opposite effects.
Genetic-interaction networks
Implementation of the foregoing principles renders genetic-interaction-network derivation fully computable from data on any measured cell property with any interacting perturba-tions. We developed an open-source cross-platform software implementation called PhenotypeGenetics, available at [10], a plug-in for the Cytoscape general-purpose network visuali-zation and analysis platform [11]. PhenotypeGenetics sup-ports an XML specification for loading any dataset, allows user-defined genetic-interaction modes, and supports all of the analyses described in this paper. It was used to derive and analyze a genetic-interaction network from yeast invasion phenotype data.
In response to growth on low-ammonium agar, Saccharomy-ces cerevisiae MATa/αdiploid yeast cells differentiate from the familiar ovoid single-cell growth form to a filamentous form able to invade the agar substrate [12]. Invasive filamen-tous-form growth is regulated by a mitogen-activated protein kinase (MAPK) kinase cascade, the Ras/cAMP pathway, and multiple other pathways [13,14]. We investigated genetic interaction among genes in these pathways and processes. Quadruplicate sets of homozygous diploid single-mutant and double-mutant yeast strains were constructed (Materials and methods). Two purposes guided the selection of genes and mutant combinations to study: to represent key pathways and processes regulating invasion; and to ensure a diversity of invasion phenotypes (non-invasive, hypo-invasive, wild type, and hyper-invasive) to permit the detection of diverse genetic interactions. A set of 19 mutant alleles of genes in key path-ways controlling invasive growth, including 13 plasmid-borne dominant or multicopy wild-type alleles and 6 gene deletions, was crossed against a panel of 119 gene deletions. All mutant alleles used in this study are listed in Additional data file 2.
comm
en
t
re
v
ie
w
s
re
ports
refer
e
e
d
re
sear
ch
de
p
o
si
te
d r
e
se
a
rch
interacti
o
ns
inf
o
rmation
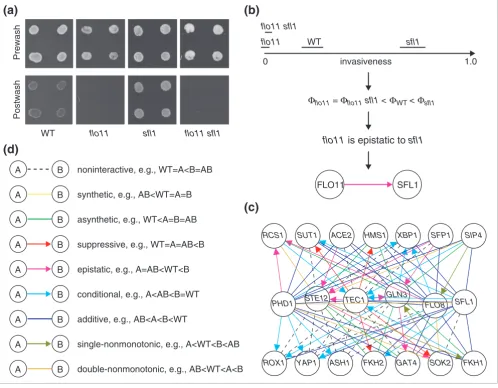
Graphical visualization of the genetic interactions revealed a dense complex network. For clarity, a small part of this net-work (interactions among transcription factors) is shown in Figure 1c, illustrating the diversity of the observed genetic interactions. Perturbed genes are nodes in the network. Each tested allele combination generates an edge representing a genetic interaction. Edge colors and arrow heads (where appropriate) indicate interaction mode and asymmetry as indicated in Figure 1d. The entire network of 127 nodes and 1,808 edges is shown in Additional data file 4. All of the underlying data, including tested interactions, genotypes, and quantitative phenotype data with error values, are listed in Additional data file 5. All nine genetic-interaction modes were observed among the 1808 interactions. Other than the noninteractive mode (with 443 occurrences), the most
fre-quent modes were additive (347), epistatic (271), conditional (245), and suppressive (202) interaction. Lower frequencies of asynthetic (111), single-nonmonotonic (74), synthetic (62), and double-nonmonotonic (52) interaction were observed. Note that though the asynthetic, single-nonmonotonic, and double-nonmonotonic modes are not recognized by common genetic nomenclature, they occurred at substantial frequencies.
Genetic perturbations interacting with a specific biological process
Because genetic interactions reflect functional interactions, a genetic perturbation may interact in a specific mode with more than one gene in a specific biological process. This con-jecture is supported by the finding of 'monochromatic'
[image:3.612.57.555.88.476.2]Application of the method to yeast agar invasion data to derive a genetic-interaction network Figure 1
Application of the method to yeast agar invasion data to derive a genetic-interaction network. (a) Pre-wash and post-wash images of example genotypes in a yeast agar-invasion assay. (b) The invasion data shown on a phenotype axis with replicate-measurement error ranges, as a phenotype inequality, as a genetic-interaction mode, and as a graphical visualization. (c) Part of the network (only transcription factor genes) is shown. Nodes represent perturbed genes; edges represent genetic interactions. A key to the interactions is given in (d). (d) Graphical visualizations of genetic interaction modes and asymmetries, and example phenotype inequalities.
WT flo11 sfl1 flo11 sfl1
Prewash
Postwash
SOK2 HMS1
FLO8 SFL1
ASH1 PHD1 STE12 TEC1
FKH2 GAT4 GLN3 RCS1
YAP1
XBP1
ROX1
SUT1 ACE2 SFP1 SIP4
FKH1 Φflo11= Φflo11 sfl1 < ΦWT <Φsfl1
flo11 is epistatic to sfl1
invasiveness
0 1.0
WT
flo11 sfl1
sfl1 flo11
FLO11 SFL1 synthetic, e.g., AB<WT=A=B
A B
asynthetic, e.g., WT<A=B=AB
A B
additive, e.g., AB<A<B<WT
A B
double-nonmonotonic, e.g., AB<WT<A<B
A B
noninteractive, e.g., WT=A<B=AB
A B
suppressive, e.g., WT=A=AB<B
A B
epistatic, e.g., A=AB<WT<B
A B
conditional, e.g., A<AB<B=WT
A B
single-nonmonotonic, e.g., A<WT<B<AB
A B
(a)
(b)
(d)
Table 1
Genetic interactions of mutant genes with biological processes
Gene Form* Interaction Biological process -log10P
PBS2 null Additive Signal transduction 2.99
PBS2 null Additive Small gtpase mediated signal transduction 2.96
STE12 gf Single-nonmonotonic to Protein targeting 2.87
STE11 da Noninteractive Cell cycle 2.73
PHD1 gf Hypostatic to Invasive growth 2.68
PDE2 null Noninteractive Protein amino acid phosphorylation 2.56
HSL1 null Suppressed by Cell wall organization and biogenesis 2.52
STE20 gf Single-nonmonotonic to Protein targeting 2.31
EGT2 null Conditioned by Invasive growth 2.30
ISW1 null Suppresses Small gtpase mediated signal transduction 2.30
CLB1 null Noninteractive Protein metabolism 2.30
STE11 da Suppresses Cell surface receptor linked signal transduction 2.28
BEM1 gf Conditioned by Nucleobase, nucleoside, nucleotide and nucleic acid metabolism 2.25
PBS2 null Additive Ras protein signal transduction 2.24
PBS2 null Additive Sporulation 2.24
TEC1 gf Synthetic Intracellular signaling cascade 2.19
IPK1 null Additive M phase 1.95
TEC1 null Epistatic to Metabolism 1.94
TEC1 gf Conditioned by Carbohydrate metabolism 1.94
TEC1 gf Conditioned by Ras protein signal transduction 1.94
BUD4 null Noninteractive Establishment of cell polarity 1.94
HMS1 null Noninteractive Protein amino acid phosphorylation 1.83
YGR045C null Noninteractive Protein amino acid phosphorylation 1.83
*gf, gain-of-function; da, dominant-active.
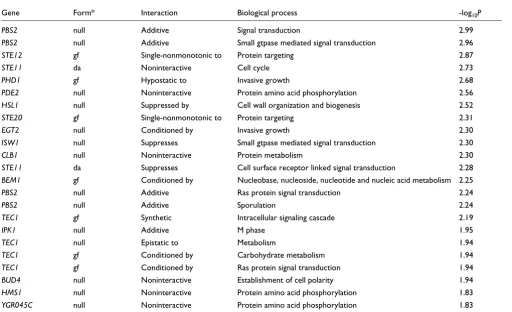
Gene perturbations show specific modes of genetic interaction with biological processes Figure 2
Gene perturbations show specific modes of genetic interaction with biological processes. (a) PBS2 deletion interacts additively with mutations of small-GTPase-mediated signal transduction genes. (b) PHD1 overexpression is hypostatic to deletions of invasive-growth genes. (c) ISW1 deletion suppresses the effects of perturbations of small-GTPase-mediated signal transduction genes. Key to interactions as in Figure 1d
BMH1
RAS2
TPK1 BUD6
BNI1
PBS2
CLA4
PHD1
RIM8
DIA2 DFG16
RAS2 CDC42
ISW1
IRA2
[image:4.612.57.560.481.681.2]comm
en
t
re
v
ie
w
s
re
ports
refer
e
e
d
re
sear
ch
de
p
o
si
te
d r
e
se
a
rch
interacti
o
ns
inf
o
rmation
interaction among biological-process modules [15]. Table 1 lists 23 interactions in a specific mode between a mutant allele and a biological process. The statistical validation of these interactions is detailed in the Materials and methods. Figure 2 shows three examples. In Figure 2a, a PBS2 gene deletion is additive with mutations of small-GTPase-medi-ated signal transduction genes (P = 0.001). These include genes in the Rho signal transduction/cell polarity pathway (BNI1, CLA4, BUD6) and the Ras/cAMP signaling pathway (RAS2, BMH1, TPK1). These signaling pathways contribute to invasive growth phenotype in concert with the stress response regulated by the Pbs2 MAPK kinase [16]. In Figure 2b, deletions of invasive-growth genes DFG16, RIM8, and
DIA2 are epistatic to overexpression of the invasion-activat-ing Phd1 transcription factor (P = 0.002). The combination of this epistasis with the forms of the interacting alleles (PHD1
overexpression is a gain of function, whereas the others are null alleles) leads to the suggestion that DFG16, RIM8, and
DIA2 may be regulated by Phd1. In Figure 2c, a deletion of the
ISW1 gene suppresses the effects of perturbations of small-GTPase-mediated signal transduction genes CDC42, RAS2, and IRA2 (P = 0.005). ISW1 encodes an ATP-dependent chromatin-remodeling factor [17]. Halme et al. [18] have shown that invasiveness of yeast cells is controlled epigeneti-cally. High-frequency spontaneous mutations of IRA1 and
IRA2 relieve epigenetic silencing of invasion genes. The sup-pression of an IRA2 mutation by ISW1 mutation suggests the possibility that ISW1-dependent chromatin remodeling mediates effects of IRA2 mutation. Table 1 and Figure 2 illus-trate local interaction patterns among mutant genes and bio-logical processes.
Mutually informative patterns of genetic interaction
The phenotypic consequences of combinatorial genetic per-turbations are complex, in a strict sense; knowing the pheno-types of two single perturbations, there are no simple rules to know the combinatorial phenotype. Counteracting this com-plexity, large sets of genetic-interaction data may contain large-scale patterns. We examined the possibility that there are pairs of perturbations with mutually informative patterns of genetic interaction with their common interaction part-ners. In other words, knowing the interactions of one pertur-bation may allow one to know, to some quantifiable extent, the interactions of another perturbation, and vice versa. Mutual information, and significance thereof, was calculated for all pairs of perturbations sharing tested interactions with other genes. For all 171 pairs of the 19 mutant alleles of genes in key pathways, mutual information was based on their interactions with the panel of 119 gene deletions. Similarly, among all 7,021 pairs of the 119 gene deletions, mutual infor-mation was based on their interactions with the 19 mutant alleles of genes in key pathways. Among all possible pairs, 23 showed significant (P < 0.001) mutual information (Materi-als and methods and Additional data file 6).
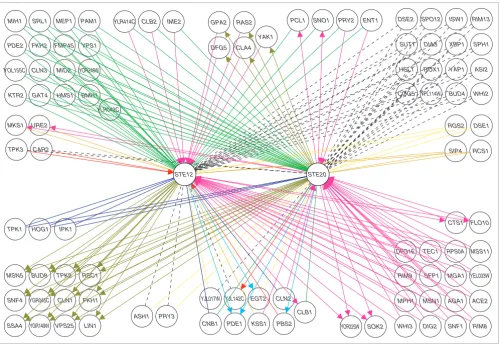
The results suggest that the most mutually informative genetic-interaction patterns occur among gene perturbations with similar effects on biological processes. For example, three of the six mutant gene pairs with the most significant mutual information are overexpressers of STE12-STE20,
STE12-CDC42, and STE20-CDC42 (Additional data file 6). These three genes encode central components of the MAPK signaling pathway promoting invasive filamentous-form growth [14], and they show similar patterns of genetic inter-action, as exemplified by STE12 and STE20 in Figure 3. The dominant pattern is one of uniform interaction (A and B interact in the same mode with C), suggesting similar effects of the gene perturbations on the underlying molecular net-work. In addition, there are frequent occurrences of repeated mixed-mode interaction (A interacts in some mode with C, and B interacts in a different mode with C), suggesting that the molecular effects of gene perturbations may differ yet show consistent differences. Both uniform interaction and consistent mixed-mode interaction contribute to mutual information.
Genetic interactions are ultimately a property of a network of biological information flows. The mutual information among pathway co-member genes like STE12 and STE20 supports this. Figure 4 shows a mutual-information network of perturbed genes. Each edge indicates significant mutual information (Additional data file 6). Some of these edges con-nect genes in different cellular processes. For example, an edge connects the GLN3 gene, encoding a transcriptional reg-ulator of nitrogen metabolism, and the CDC42 gene, encod-ing a GTPase involved in cell polarity. Such cases of mutual information suggest that in the underlying molecular net-work, there are important information flows between the dif-ferent pathways and processes.
In addition to pairwise mutual information, there is the pos-sibility that multiple genes may exhibit significant mutual information. The network in Figure 4 contains multiple n -cliques, subnetworks of n completely connected nodes. There is a 3-clique, including two main components (PBS2 and
HOG1) of the HOG MAP-kinase pathway, and three overlap-ping 4-cliques (with many subcliques) containing filamenta-tion MAPK pathway components. The STE12-STE20-CDC42
3-clique is in this cluster of cliques. The cliques and clusters suggest ternary and higher orders of mutual information, reflecting similarities in the global effects of perturbations on molecular information flows.
Conclusion
Investi-gation of these mechanisms should provide insight on specific processes and general properties of biological networks. There are several areas for further development of the quan-titative analysis of genetic interaction: first, advances in quantitative phenotype measurement and ontologies; sec-ond, reinforcement or revision of genetic-interaction mode definitions based on relevance to network mechanisms; third, extension of all genetic-interaction modes beyond phenotype ordering to incorporate parameters derived from phenotype magnitudes; and fourth, comparative genetic-interaction analyses of multiple alleles (with different effects on function) of individual genes to learn how different levels of gene activ-ity impact the network.
The global genetic-interaction patterns illustrated in Figures 3 and 4 are readouts of the state of the underlying molecular network. Data relating genotype and phenotype are essential for understanding metabolic and information-flow paths. Genetic data, integrated with gene-activity data and molecu-lar-interaction data, reveal direction of information flow, activations, repressions, and combinatorial controls. The
genome-scale integration of molecular-wiring maps, gene-expression data, and genetic-interaction networks will enable the development of biological-network models that explicitly predict the phenotypic consequences of genetic perturbations [19].
Materials and methods
Strain constructionsA total of 127 genes involved in the regulation of invasion were selected for study from searches of the YPD database [20] and gene-expression profiling experiments [21,22]. 138 mutant alleles of these 127 genes, including 125 deletions and 13 plasmid-borne alleles, were assembled (Additional data file 2). Single-mutant homozygous diploid strains were con-structed in the invasion-competent Σ1278b budding-yeast strain background. In quadruplicate constructions, a 19 mutant-allele subset, including the 13 plasmid-borne alleles and six of the gene deletions, was crossed against the other 119 deletions. Homozygous diploid double mutants were gen-erated as follows.
[image:6.612.59.559.85.434.2]Mutually informative genes show large-scale patterns of genetic interaction Figure 3
Mutually informative genes show large-scale patterns of genetic interaction. Genetic interactions of STE12 and STE20 overexpressers. Key to interactions as in Figure 1d.
SOK2 URE2
HMS1
RPS0A BMH1
YEL033W RAS2
VPS25 IPK1
GPA2
YPS1
TPK1
COG5
CLN1
RIM9
MIH1 CLB2
EGT2 MSN1
TPK3
RSC1 CLN3
YAK1
ASH1 PAM1
RIM8 PDE1
CAR2
MPH1
RIM13
DIG2 SNF1 YPL114W
LIN1
ASI2
MSN5
SSA4
IME2
PRY3 YLR414C
SPH1
TEC1 ENT1
CLN2 TPK2
MKS1 FKH2
YJL142C
BUD4
DSE1 KTR2
ISW1
GAT4
DFG5
MGA1 WHI2
YLR042C
FLO10 RCS1 PRY2
FMP45
YAP1
CNB1 YOR248W
XBP1
MSS11 ROX1
DFG16 PDE2
SRL1
PBS2 BUD8
YOR225W YOL155C
WHI3 YJL017W
YGR045C
SUT1
ACE2 MEP1
HOG1
RGS2 PCL1
MID2
CLA4
SNF4
DIA3
CLB1
KSS1
SFP1 SPO12
SIP4
AGA1 DSE2
SNO1
FKH1
CTS1
YGR149W
HSL1
comm
en
t
re
v
ie
w
s
re
ports
refer
e
e
d
re
sear
ch
de
p
o
si
te
d r
e
se
a
rch
interacti
o
ns
inf
o
rmation
Single-gene deletions in the invasion-competent Σ1278b yeast background were constructed. 'Barcode' gene deletion-insertion alleles [5] were PCR amplified with several hundred base pairs of flanking sequences from their noninvasive strain background. Using the G418 drug-resistance cassette of these alleles, strain G85 (MATa/α ura3∆0/ura3∆0 his3∆0::hisG/ his3∆0::hisG) was transformed with the PCR products. Gene disruption and the presence of the KanMX4 insertion were verified by PCR. The heterozygous diploids were sporulated and the resulting tetrads were dissected and screened to select G418-resistant MATa and MATαhaploids. These were crossed to obtain homozygous diploid gene-deletion strains.
Some of the double mutants were generated by transforming the homozygous deletion strains with either low-copy plas-mids bearing dominant alleles or multicopy (2 µm-based) plasmids bearing wild-type alleles. All plasmids utilized native gene promoters. Plasmid transformations were per-formed using an adapted version of a multiwell transforma-tion protocol [5,23]. Four independent transformants were stocked and assayed for each transformation. Strains were also transformed with empty vector plasmids.
The high-throughput construction of diploid homozygous double-deletion strains required the use of three drug-resist-ance markers to be able to select for the desired diploids and intermediate strains. For each deletion, the KanMX4 drug-resistance marker was converted to two other drug-drug-resistance
markers, HygMX4 (hygromycin resistance) and NatMX4 (nourseothricin resistance). MATα gene-deletion strains were transformed with the NatMX4 cassette amplified from pAG25 [24]; NatR G418S transformants were stocked. MATa
gene-deletion strains were transformed with the HygMX4 cassette amplified from pAG32 [24]; HygR G418S
transform-ants were stocked.
The high-throughput construction of diploid homozygous double-deletion strains required the ability to select haploids of each mating type separately. To accomplish this, we uti-lized the recessive resistance to canavanine caused by the dis-ruption of the CAN1 gene, encoding a transporter, in combination with fusions of the HIS3 ORF to the promoters of genes expressed in a specific mating type. A deletion of the
CAN1 gene was constructed without introducing any marker genes or sequences. A double-stranded 60mer oligonucle-otide containing 30 bases from the upstream region fused directly to 30 bases from the downstream region of the CAN1
open reading frame (5'- GTAAAAACAAAAAAAAAAAAAGGCATAGCAATAT-GACGTTTTATTACCTTTGATCACATT-3') was amplified with 60mer primers containing additional CAN1 flanking sequences (forward primer 5'-CGAAAGTTTATTTCAGAGT-TCTTCA
GACTTCTTAACTCCTGTAAAAACAAAAAAAAAAAA-3', reverse primer 5'- GTGTATGACTTATGAGGGTGAGAATGCGAAATGGCGT-GGAAATGTGATCAAAGGTAATAA-3'). The resulting PCR product was used to transform two strains to canavanine resistance. Full deletion of the CAN1 gene was confirmed by PCR. This generated strains G264 (MATa his3∆::hisG can1∆) and G266 (MATα his3∆::hisG can1∆). To construct fusions of the HIS3 ORF to mating-type specific genes, the S. kluyveri HIS3 gene was amplified from pFA6-His3MX6 [25] with primers containing ORF-flanking sequences for the MFA1
locus (forward primer 5'-GTTTCTCGGATA AAACCAAAATAAGTACAAAGCCATCGAATAGAAATGGCAG AACCAGCCCAAAA-3', reverse primer 5'-AAGGAAGA-TAAAGGAGGGAGAACAACGTTTTTGTA CGCAGAAATCA-CATCAAAACACCTTTGTT-3') and with primers containing flanking sequences for the MFα 1 locus (forward primer 5'-GATTACAAACTATCAAT TTCATACACAATATAAACGAT-TAAAAGAATGGCAGAACCAGCCCAAAA-3', reverse primer 5'-ACAAAGTCGACTTTGTTACATCTACACTGTTGTTA TCAGTCGGGCTCACATCAAAACACCTTTGGT-3'). The resulting PCR products were used to transform G264 and G266, respectively, to create strains G544 (MATa
his3∆::hisG can1∆mfa1::HIS3) and G546 (MATα his3∆::hisG can1∆mfα1::HIS3).
Crosses and sporulations were carried out to introduce the canavanine-resistance marker and the mating-type-specific-His+ markers. MATαNatR deletion strains were crossed with
G544. NatR Ura+ diploids were selected; all were CanS and
His-. These diploids were sporulated; from random spore Networks of mutual information in patterns of genetic interaction show
[image:7.612.54.297.85.328.2]cliques Figure 4
Networks of mutual information in patterns of genetic interaction show cliques. Nodes represent perturbed genes (see Additional data file 2). gf indicates a gain-of-function allele; lf indicates a loss-of-function allele. Edges connect gene pairs with significant mutual information in their patterns of genetic interaction (see Additional data file 6).
STE20(gf) STE12(gf)
FLO8(gf)
TEC1(gf)
BEM1(gf)
CDC42(gf)
MID2(lf)
RGS2(lf)
EGT2(lf)
GLN3(gf)
PBS2(lf)
HSL1(lf)
HOG1(lf)
SFL1(lf)
YJL142C(lf)
YAP1(lf) ISW1(lf)
preparations NatR CanR His+ Ura- MATa haploids were
iden-tified. MATa HygR deletion strains were crossed with G546.
These diploids were sporulated; from random spore prepara-tions HygR CanR His+ Ura- MATαhaploids were identified.
To make the diploid homozygous double-deletion strains, a series of high-throughput crosses and sporulations, in which all the desired intermediate cell types and deletion genotypes could be selected, was carried out [1]. At all stages, multiple strains were individually verified. NatR MATa single-deletion
strains were crossed to an array of MATαG418R
single-dele-tion strains. HygR MATαsingle-deletion strains were crossed
to an array of MATa G418R single-deletion strains. From
these crosses NatR G418R diploids and HygR G418R diploids
were selected, respectively. Diploids from each cross were sporulated. Haploid double-deletion strains were selected: His+ CanR (MATa haploid) G418R NatR double-deletion
segre-gants, and His+ CanR (MATαhaploid) G418R HygR
double-deletion segregants, respectively. The resulting arrays of
MATa and MATα haploid double-deletion strains were mated and subjected to selection for G418R, NatR, and HygR
to generate diploid homozygous double-deletion strains.
Assay of yeast invasiveness
Strains were inoculated from frozen stocks into liquid media in 96-well plates and incubated 18 hours at 30°C. Each plate included at least eight wells containing wild-type controls. Cells were transferred with a 96-Floating-Pin Replicator and colony copier (V & P Scientific) onto SLAD agar [12] in an omnitray. Each 96-well plate was pinned in quadruplicate, resulting in a total of 384 colonies per SLAD-agar plate. Note that each genotype was constructed in quadruplicate and assayed on separate plates. Therefore, each genotype was assayed with a total of 16 replicates. Plates were incubated for 4 days at 30°C. After incubation, cell material was removed from the agar surface while rinsing the plate under running water. A 300 d.p.i. grayscale image of each plate was gener-ated before and after the wash by placing the plate face down on a flatbed scanner and scanning with transmitted light. Images were inverted using Adobe Photoshop 6 and saved as TIFF files for quantitative image analysis.
Processing of invasion-assay data
Colony growth and invasion were quantified using Dapple [26], software originally designed for the analysis of DNA microarray images. Each post-wash image was analyzed simultaneously with the corresponding pre-wash image to enable reliable definition of colony boundaries and direct comparison of cell material. Subtraction of local background intensity yielded un-normalized values for growth (G) and invasion (U) and invasiveness ratio (R = U/G). A normaliza-tion factor for each plate, Np, was obtained from multiple wild-type controls on each plate. For each replicate q on plate
p, we obtained the wild-type invasiveness ratio Rwtq,p =
Uwt
q,p/Gwtq,p and defined the plate normalization factor Np as
Np = medianq(Rwt
q,p)/medianp(medianq(Rwtq,p)). For a given
genotype g, the normalized invasiveness ratio is given by Rgq,p = (Ug
q,p/Ggq,p)/Np = Rgi where in the final equality we renum-bered into a single ordinal index the N replicates i = 1,2,..,N
(N ≤ 16). We excluded any genotype g for which N < 5 due, for example, to deficient growth. From normalized data, we derived phenotype values and measurement errors. We obtained the median ratio Rg = median
i(Rgi), and the median absolute deviation MADg = MAD(Rg
i) = mediani(|Rgi-Rg|). As a lower bound in error estimates we used MADQ = 0.1, the tenth
percentile of all MADg. Thus, the phenotype values are reported as Rg, with error Eg = max(MADg, MADQ = 0.1). The
frequencies of genetic-interaction modes were insensitive to increases of the error lower bound to the 50th percentile. Directed checks of individual components of the automated processing were made throughout. These included: visual inspection of each individual image, check of colony morphol-ogy, spot checking of well-characterized individual strains from start to finish in the analysis pipeline, screening for sys-tematic errors in assay intensities. We confirmed that the plate-wise normalization did not lead to error amplification due to division by small numbers.
Derivation of phenotype inequalities
The following steps were carried out using PhenotypeGenet-ics software. Phenotypes and errors of genotypes WT, A, B, and AB [(Rwt,Ewt), (RA,EA), (RB,EB), and (RAB, EAB)] were assigned a phenotype inequality relation. This was done by first defining the error-bounded interval Ig = [Rg-Eg, Rg+Eg] for each genotype. All pairs of genotypes were assigned an equality, Φg1 = Φg2 if interval Ig1 overlapped with Ig2.
Transi-tivity of equalities (if a = b and b = c, then a = c) was applied to yield disjoint groups of phenotype equalities. Inequalities, greater than (>) or less than (<) were assigned for the rela-tions between equality groups. The resulting inequalities were assigned to genetic-interaction modes and asymmetries as described below. The results of all tests of genetic interaction were rendered as a graph as illustrated in Figure 1d. The entire resulting network is shown in Additional data file 4. One can obtain PhenotypeGenetics software or use it to analyze the invasion network at [10].
Modes of genetic-interaction
The 75 possible phenotype inequalities were assigned to modes of genetic interaction based on computable criteria. For each mode, we list the criterion for the inclusion of a phe-notype inequality. In these criteria, 'background' refers to a genotype with its complement of wild-type and mutant genes, into which other genetic perturbations are added, and 'effect' refers to a change in a phenotype, either an increase or a decrease, upon a single genetic perturbation of a background. In the examples below, additional cases may be generated by operations such as exchanging A and B, or reversing the effect of both alleles (for example reversing the effect of the A
comm
en
t
re
v
ie
w
s
re
ports
refer
e
e
d
re
sear
ch
de
p
o
si
te
d r
e
se
a
rch
interacti
o
ns
inf
o
rmation
1d shows graph visualizations for all nine genetic-interaction modes.
Noninteractive interaction
A has no effect in the WT and B backgrounds (for example,
ΦWT = ΦA < ΦB = ΦAB), or B has no effect in the A and WT backgrounds, or both hold true (5 inequalities).
Epistatic interaction
A and B have different effects (in terms of direction or magni-tude) on the wild-type background and the double mutant has the same phenotype as either A or B (for example, ΦA < ΦWT <
ΦB = ΦAB) (12 inequalities).
Conditional interaction
A has an effect only in the B background, or the B mutant has an effect only in the A background (12 inequalities).
Suppressive interaction
A has an effect on WT, but that effect is abolished by adding the suppressor B, which itself shows no single-mutant effect (for example, ΦWT = ΦB = ΦAB <ΦA); or, the corresponding holds under exchange of A and B (4 inequalities).
Additive interaction
Single-mutant effects combine to give a double-mutant effect as per ΦWT <ΦA= ΦB<ΦAB, ΦB < ΦWT = ΦAB < ΦA, ΦWT < ΦA <
ΦB < ΦAB, ΦB < ΦWT < ΦAB < ΦA, and all additional inequalities obtained by interchanging A and B, or reversing the effect of both A and B (12 inequalities).
Synthetic interaction
A and B have no effect on the WT background, but the AB
combination has an effect (2 inequalities).
Asynthetic interaction
A, B, and the AB combination all have the same effect on the
WT background (2 inequalities).
Single-nonmonotonic interaction
B shows opposing effects in the WT and A backgrounds (for example, ΦB > ΦWT and ΦAB< ΦA); or, A shows opposing effects in the WT and B backgrounds, but not both (8 inequalities).
Double-nonmonotonic interaction
Both A and B show opposing effects in the WT background and the background with the other mutant gene (18 inequalities).
Genetic interaction with biological processes
To identify statistically significant correlations between a given allele's interaction modes and biological processes, the neighbors of every allele in the network were queried for interaction class and Gene Ontology (GO) Consortium data-base annotations [27]. Each interaction class is defined by the
interaction mode and direction, if any. For example, 'A sup-presses B' and 'A is suppressed by B' are placed in different interaction classes. There are 13 interaction classes and 9 interaction modes (described above). Likelihood values were computed to find over-represented class-annotation pairings within each set of nearest neighbors, and P-values were assigned relative to a cumulative hypergeometric distribu-tion. The result was a computer-generated list of biological statements relating genes, interaction classes, and target annotations, with entries such as 'A loss-of-function mutation of HSL1 is suppressed by mutations of cell wall organization and biogenesis genes (-log10P = 2.52).' These are listed in tab-ular form in Table 1.
To calibrate the significance of the results, a parallel calcula-tion was performed for every test in the network in which the fractional probabilities of each possible outcome were added to an overall distribution of P-values for the entire network. For example, if a given mutation interacts with N others, NC
of the interactions being of class C and NA of those neighbors carrying annotation A, there is a finite set of outcomes for
NCA, the number of neighbor mutations with annotation A
connected via interaction C. The possible values of NCA follow a discrete hypergeometric distribution, and summing these distributions over all tests in the network yields a formally randomized distribution of P-values which has been con-strained by the topology of the actual network. The distribu-tions, real and theoretical, of -log10P values were then compared by performing a chi-square test between compara-ble histograms. These tests showed a strong excess for -log10P
> 1.8.
Mutual information of genetic interaction patterns
We calculated the mutual information [28] of pairs of genetic perturbations. Each perturbation, X, has an observed discrete probability distribution of interaction classes (defined by mode and direction) with its tested interaction partners, P(x), where x ∈X, the set of interaction classes of perturbation X, and:
Mutual information, I, of a pair of perturbations, A and B, is the relative entropy of their joint probability distribution rel-ative to their product probability distribution. Thus:
Significance of mutual information was tested independently for each allele pair by computing the likelihood of obtaining the observed score in randomly permuted data. To remove bias due to our selection of mutant alleles, randomized data were constrained by keeping the wild type and two single-mutant phenotypes fixed and replacing interaction classes
P x
x X
( ) .
∈
∑
=1I A B P a b P a b P a P b I A B I
b B a A
[ ; ] ( , )log ( , )
( ) ( ) [ ; ] [
=
=∈
∈
∑
∑
2only with classes that are consistent with the observed single-mutant phenotypes. The choice among possible replacement classes was weighted by observed frequency in the entire net-work. Empirical tests showed randomized mutual informa-tion scores to be normally distributed, and multiple randomizations were carried out to determine a mean and standard deviation to characterize the distribution for each tested allele pair. P-values were then calculated as the probability of finding a mutual information score at or above the observed score. Allele pairs with probabilities below the cutoff of P < 0.001 are listed in Additional data file 6, and shown as a graph in Figure 4.
Additional data files
The following data are available with the online version of this paper. Additional data file 1 is a table showing 75 genetic-interaction inequalities in nine modes of genetic genetic-interaction. Additional data file 2 lists the gene perturbations used in this study. Additional data file 3 is a figure plotting phenotype error values in the entire dataset. Additional data file 4 shows the entire genetic interaction network derived from yeast invasion-phenotype data. Additional data file 5 lists pheno-type data for all tested interactions. Additional data file 6 lists mutual information in genetic-interaction patterns.
Additional File 1
A table showing 75 genetic-interaction inequalities in nine modes of genetic interaction. As described in Materials and methods, all 75 possible phenotype inequalities were classified into nine modes of genetic interaction. The results are listed here.
Click here for file Additional File 2
Gene perturbations used in this study. This file lists all genes, mutant alleles, and allele forms (for example, null, gain-of-func-tion, etc.)
Click here for file Additional File 3
Phenotype error values in the entire dataset. This plot shows the phenotype error values (Materials and methods) plotted against percentile of all genotypes ordered by error magnitude. Click here for file
Additional File 4
Entire genetic interaction network derived from yeast invasion-phenotype data. Figure 1c shows a small part of the genetic-inter-action network. This file contains an image including all tested interactions.
Click here for file Additional File 5
Phenotype data for all tested interactions. This file lists all tested genetic interactions as well as the phenotype and error values for all genotypes, WT, A, B, and AB.
Click here for file Additional File 6
Mutual information in genetic-interaction patterns. This file lists the mutual information, and significance, among pairs of genes connected by edges in Figure 4.
Click here for file
Acknowledgements
We thank J. Aitchison, C. Aldridge, G. Church, L. Hood, S. Istrail, A. Markiel, S. Prinz, F. Roth, D. Segre, and J. Taylor for their contributions. This work was funded in part by Merck & Co. V.T. was supported by NIH Grant P20 GM64361. T.G. is a recipient of a Burroughs Wellcome Fund Career Award in the Biomedical Sciences.
References
1. Tong AH, Evangelista M, Parsons AB, Xu H, Bader GD, Page N, Rob-inson M, Raghibizadeh S, Hogue CW, Bussey H, et al.: Systematic genetic analysis with ordered arrays of yeast deletion mutants.Science 2001, 294:2364-2368.
2. Tong AH, Lesage G, Bader GD, Ding H, Xu H, Xin X, Young J, Berriz GF, Brost RL, Chang M, et al.: Global mapping of the yeast genetic interaction network.Science 2004, 303:808-813. 3. Fraser AG, Kamath RS, Zipperlen P, Martinez-Campos M, Sohrmann
M, Ahringer J: Functional genomic analysis of C. elegans chro-mosome I by systematic RNA interference. Nature 2000, 408:325-330.
4. Tewari M, Hu PJ, Ahn JS, Ayivi-Guedehoussou N, Vidalain PO, Li S, Milstein S, Armstrong CM, Boxem M, Butler MD, et al.: Systematic interactome mapping and genetic perturbation analysis of a C. elegans TGF-beta signaling network. Mol Cell 2004, 13:469-482.
5. Winzeler EA, Shoemaker DD, Astromoff A, Liang H, Anderson K, Andre B, Bangham R, Benito R, Boeke JD, Bussey H, et al.: Func-tional characterization of the S. cerevisiae genome by gene deletion and parallel analysis.Science 1999, 285:901-906. 6. Strausberg RL, Schreiber SL: From knowing to controlling: a
path from genomics to drugs using small molecule probes. Science 2003, 300:294-295.
7. Swedlow JR, Goldberg I, Brauner E, Sorger PK: Informatics and quantitative analysis in biological imaging. Science 2003, 300:100-102.
8. Avery L, Wasserman S: Ordering gene function: the interpreta-tion of epistasis in regulatory hierarchies.Trends Genet 1992, 8:312-316.
9. Hartman JLt, Garvik B, Hartwell L: Principles for the buffering of
genetic variation.Science 2001, 291:1001-1004. 10. Galitski Lab [http://labs.systemsbiology.net/galitski]
11. Shannon P, Markiel A, Ozier O, Baliga NS, Wang JT, Ramage D, Amin N, Schwikowski B, Ideker T: Cytoscape: a software environment for integrated models of biomolecular interaction networks. Genome Res 2003, 13:2498-2504.
12. Gimeno CJ, Ljungdahl PO, Styles CA, Fink GR: Unipolar cell divi-sions in the yeast S. cerevisiae lead to filamentous growth: regulation by starvation and RAS.Cell 1992, 68:1077-1090. 13. Lengeler KB, Davidson RC, D'Souza C, Harashima T, Shen WC,
Wang P, Pan X, Waugh M, Heitman J: Signal transduction cas-cades regulating fungal development and virulence.Microbiol Mol Biol Rev 2000, 64:746-785.
14. Gancedo JM: Control of pseudohyphae formation in Saccharo-myces cerevisiae.FEMS Microbiol Rev 2001, 25:107-123.
15. Segre D, DeLuna A, Church GM, Kishony R: 'Monochromatic' modularity of epistatic interaction network in yeast metabolism.Nat Genet 2005, 37:77-83.
16. O'Rourke SM, Herskowitz I: The Hog1 MAPK prevents cross talk between the HOG and pheromone response MAPK pathways in Saccharomyces cerevisiae. Genes Dev 1998, 12:2874-2886.
17. Tsukiyama T, Palmer J, Landel CC, Shiloach J, Wu C: Characteriza-tion of the imitaCharacteriza-tion switch subfamily of ATP-dependent chromatin-remodeling factors in Saccharomyces cerevisiae. Genes Dev 1999, 13:686-697.
18. Halme A, Bumgarner S, Styles C, Fink GR: Genetic and epigenetic regulation of the FLO gene family generates cell-surface var-iation in yeast.Cell 2004, 116:405-415.
19. Galitski T: Molecular networks in model systems. Annu Rev Genomics Hum Genet 2004, 5:177-187.
20. Csank C, Costanzo MC, Hirschman J, Hodges P, Kranz JE, Mangan M, O'Neill K, Robertson LS, Skrzypek MS, Brooks J, et al.: Three yeast proteome databases: YPD, PombePD, and CalPD (MycoPathPD).Methods Enzymol 2002, 350:347-373.
21. Galitski T, Saldanha AJ, Styles CA, Lander ES, Fink GR: Ploidy regu-lation of gene expression.Science 1999, 285:251-254.
22. Prinz S, Avila-Campillo I, Aldridge C, Srinivasan A, Dimitrov K, Siegel AF, Galitski T: Control of yeast filamentous-form growth by modules in an integrated molecular network. Genome Res 2004, 14:380-390.
23. Saccharomyces Genome Deletion Project [http://www-sequence.stanford.edu/group/yeast_deletion_project/transprot.html] 24. Goldstein AL, McCusker JH: Three new dominant drug resist-ance cassettes for gene disruption in Saccharomyces cerevisiae.Yeast 1999, 15:1541-1553.
25. Wach A: PCR-synthesis of marker cassettes with long flanking homology regions for gene disruptions in S. cerevisiae.Yeast 1996, 12:259-265.
26. Dapple: image analysis software for DNA microarrays [http:/ /www.cs.wustl.edu/~jbuhler/research/dapple]
27. Ashburner M, Ball CA, Blake JA, Botstein D, Butler H, Cherry JM, Davis AP, Dolinski K, Dwight SS, Eppig JT, et al.: Gene ontology: tool for the unification of biology. The Gene Ontology Consortium.Nat Genet 2000, 25:25-29.