International Journal of Emerging Technology and Advanced Engineering
Website: www.ijetae.com (ISSN 2250-2459, ISO 9001:2008 Certified Journal, Volume 9, Issue 6, June 2019)
122
Wavelet Based Method for Enhancement Quality of ECG using
DTCWT with Adaptive Filtering
Rohan Dubey
1, Deepa Gianchandani
21Scholar, 2Professor, Department of ECE, SIS Tec, Bhopal, India
Abstract-- Removal of the noise from Electrocardiogram is broad subject of research. Electrocardiogram (ECG) is an important biomedical tool for the diagnosis of heart disorders. In this paper, propose a kernel adaptive filtering techniques with DT-CWT to remove the noise from the ECG signal. The simulation of the proposed work is done using the well known simulation tool MATLAB2012 and the analysis of the research work is done by using different performance measures such as MSE, PSNR and PRD etc. After analyzing the performance of the work it shows that our work is more efficient than existing methodology.
Keywords:-ECG; noise removal; filter. I. INTRODUCTION
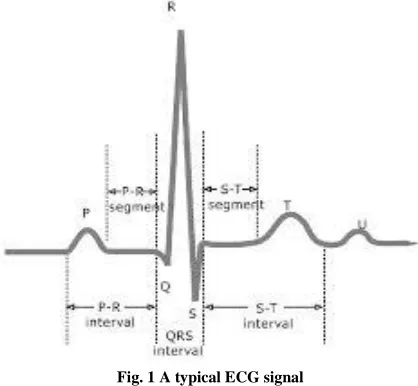
[image:1.612.63.272.483.676.2]The electrocardiogram (ECG) signal is generated by the rhythmic contractions of the heart. It corresponds to the electrical activity of the heart muscles, and is usually measured by the electrodes placed on body surface. Clinical data show that ECG signal is very effective to detect heart disease. A characteristic one cardiac cycle ECG [1] waveform which encompasses of a P-wave, a QRS-complex, and a T-wave is shown in Fig. 1
Fig. 1 A typical ECG signal
It should be noticed that even though the ECG signals The wavelet transform of a signal x(t) with mother from different patients have the similar forms, the ECG of each individual patient is different.
International Journal of Emerging Technology and Advanced Engineering
Website: www.ijetae.com (ISSN 2250-2459, ISO 9001:2008 Certified Journal, Volume 9, Issue 6, June 2019)
123
II. RELATED WORKFor elimination the noise from the ECG different author/ researchers developed different methodology among from that in this section of the paper discusses some of methods and transformations proposed previously in literature for extracting feature from ECG.
In [6] deliberated Daubechies wavelet analysis method with a decomposition tree of level 5 for analysis of noisy ECG signals. The exploration comprises the procedures of signal disintegration and renovation with hard and soft thresholding. In addition; quantifiable study of result valuation has been worked based on Signal to Noise Ratio (SNR). The consequences illustrate that on disparity with customary methods wavelet method can achieve optimal de-noising of ECG signal. In [7] introduced an augmented multi-lead principal component regression (PCR) approach for parental ECG elimination and multichannel correlation based FHR detector. Using this method we contributed to computing in cardiology, Physio Net Challenge and final results were for event 4: 28.893 bpm2 and event 5: 4.844ms. The proposed algorithm succeeded to remove maternal ECG from the abdomen signals with high accuracy.
In [8] proposed a feature mining scheme using wavelet transform and support vector machines. This paper presented a novel method to the feature extraction for consistent heart beat recognition. The proposed system of categorization is comprised of three components including data pre-processing, feature extraction and categorization of ECG signals. Two varied feature extraction methods are applied collected to accomplish the attribute vector of ECG data. The wavelet transform is used to excavation the quantities of the transform as the attributes of each ECG fragment. Along with autoregressive modeling (AR) is also pragmatic to get embrace of the temporal structures of ECG waveforms then at final the support vector machine (SVM) with Gaussian kernel is used to categorize dissimilar ECG heartbeat. The results of computer simulations provided to authenticate the performance of the proposed approach
reached on the whole precision of 99.68%. In [9]
formulated a new ECG obfuscation technique for feature extraction and corruption detection. They described a new ECG obfuscation method which uses cross correlation based template matching scheme to differentiate all ECG features followed by exploitation of those features with addednoises. It is extremely complicated to restructure the befuddled features deprived of the information of the templates used forfeature matching and the noise.
Consequently they examined three templates and three noises for P wave, QRS Complex and T wave comprises the key which is only 0.4%-0.9% of the original ECG file size. The key allocation amid the authorized doctors is proficient and fast because of its small size. To finish off the experiments carried on with extremely high number of noise combinations the security influence of the presented method was very high.
In [10] presented Multi-Swarm Optimization (MSO) methodology for robotically identifying the marginal frequency parameter of multichannel ECG waveforms for low-pass filtering is scrutinizing. Commonly, the spectrums
of the ECG waveforms are extracted from four categories:
normal sinus rhythm, atria fibrillation, and arrhythmia and supra-ventricular. Baseline wander is eradicated using the Stirring Median Filter. A dataset of the extracted using features of the ECG spectrums is used to prepare the MSO.
The efficiency estimation of the MSO with numerous
International Journal of Emerging Technology and Advanced Engineering
Website: www.ijetae.com (ISSN 2250-2459, ISO 9001:2008 Certified Journal, Volume 9, Issue 6, June 2019)
124
III. TYPES OF NOISE IN ECGAn ECG is fashioned by determining the electrical potential between several points of the body using leads. The conventional ECG wave is composed of:
1. The P wave 2. QRS complex 3. ST segment 4. The T wave 5. U wave
P wave
The P wave is fashioned as a outcome of the spread of electrical signal over the muscles of the atrium; this reasons the atrium to contract. The P wave is standard between 0.08 to 0.1 seconds (80-100ms) in period. Throughout standard atrial lessening the main electrical vector travels from the Sinoatrial (SA) node towards the Atrio-ventricular (AV) node and spreads from the right atrium to the left atrium. This turns accustomed to the P wave on the ECG. The shape and period of the P waves may designate atrial enlargement. The short-lived period after the P wave signifies the time in which the instinct is travelling within the AV node. In the AV node the speediness of the electric signal is expressively concentrated. The period of time onset of the P wave to the commencing of the QRS complex is labelled the P-R interval. The customarily is 0.12 to 0.2 second period. P-R interval is the time between the retrenchment of the atria and the retrenchment of the ventricles. If the P-R interval is more that 0.2 of second this designates serious complications with the heart.
QRS complex
The QRS resembles to the blowout of the electrical impulse over the muscle of the ventricles. The QRS complex is an organization on the ECG that is analogous to the depolarization of the ventricles. The muscles of the ventricles are greater than the muscles of the atria: this reasons QRS complex is larger than the P wave. The QRS complex is commonly between 0.06 and 0.1 second; this is a very diminutive period of time and illustrates that Ventricular depolarization happens very quickly. The period and amplitude of the QRS complex is advantageous in diagnosing cardiac problems and other disease states. An inconsistent duration (0.1 seconds) can point to a blockage in the ventricle. Anomalous amplitude can recognize coronary disease, emphysema and fatness privileged the QRS wave is a reduced wave. This wave is the workout of the atrium; it looks like an inverse P wave. It is tremendously lesser in magnitude than the QRS and is so concealed by it.
ST segment
This ST segment is duration of zero voltage that tracks the QRS complex. This is the time duration in between retrenchment of the ventricles. For convinced diseases the ST segment can become disheartened or preeminent.
T wave
The T wave signifies the relaxation of the ventricles. The T wave is scrutinized for its (A) direction, (B) shape and (C) height. A customary T wave is marginally round and irregular. A pointed wave is cause of anxiety. A Tall T wave is a convinced indicator of convinced heart disease.
U wave
Occasionally an insignificant positive U wave may be seen to track the T wave; this is due to the final relaxation of the ventricles. An inverted U wave of a protruding cans fundamental pathology.
Q-T interval
The Q-T interval signifies the whole time taken for ventricles to contract and relax. This period can range from 0.2 to 0.4 of a second.
IV. PROPOSED METHODOLOGY
In this section presents a methodology to remove the noise from the electrocardiogram signal. We use the dual tree- complex wavelet transform by applying kernel adaptive filtering technique which is linear adaptive filters in reproducing kernel Hilbert space.
To remove noise from amplitude signals, increasing quality of an ECG filtering operations are performed here with different pre specified kernels to get these effects are used and padding of zeros while calculating the value of border pixel is done. Kernel padding comprises of extending a signal (or spectrum) with zeros to outspread its
time (or frequency band) limits. It maps a length signal
to a length M>N signal, but requisite not be an integer multiple of N. To unify the time-domain and frequency-domain definitions of zero-padding, it is obligatory to esteem the original time axis [0,1……N-1] as indexing positive-time samples from 0 to N/2 -1 (for N even), and negative times in the interlude.
International Journal of Emerging Technology and Advanced Engineering
Website: www.ijetae.com (ISSN 2250-2459, ISO 9001:2008 Certified Journal, Volume 9, Issue 6, June 2019)
125
KERNEL_PAD { | | ⁄
Where , with ⁄ for
M odd, and M/2 -1 for M
The kernel adaptive filters [18] are online kernel schemes, meticulously related to some artificial neural networks such as radial basis function networks and regularization networks. Particular distinguishing features encompass: The learning process is online, the learning method is convex with no local minima, and the learning process requires temperate complexity.
DT-CWT
Dual-tree Complex wavelet transform [19], [20] and [21] is complex valued extension of the standard wavelet. Complex transform utilize complex valued filtering that partitioned the image into real and imaginary fraction in transform domain. The real and imaginary coefficients are used to compute magnitude and phase information. The key impetus for producing the dual-tree complex wavelet transform was shift invariance. Here, the common wavelet decomposition small shifts of the input signal are able to move energy between output sub-bands. Shift invariance can also be achieved in DWT by doubling the sampling rate. This is achieved in the DT-CWT by removing the down sampling by 2 after first level filter. Two fully decimated trees are then produced by down sampling, effected by considering first even and then odd samples after the first level of filters. To get consistent intervals between the two trees samples, the subsequent filters need half a sample different delay in one tree.
The tangible 2-D dual-tree DWT of an image x is instigated using two critically-sampled separable 2-D DWTs in parallel. Then for every couple of sub-bands we take the sum and difference. The complex 2-D DT-DWT also provides rise to wavelets in six divergent directions. The complex 2-D dual-tree is instigated as four critically-sampled separable 2-D DWTs operating in parallel as depicted in figure 2, 2-D structure needs four trees for analysis and synthesis. The couple of conjugate filters applied to two dimensional images (x, y) can be expressed as:
[image:4.612.324.561.119.281.2](hx+jgx)(hy+jgy)= (hxhy-gxgy) + j(hxgy + gxhy)
Figure 2: Filter bank structure for 2-D DT-DWT
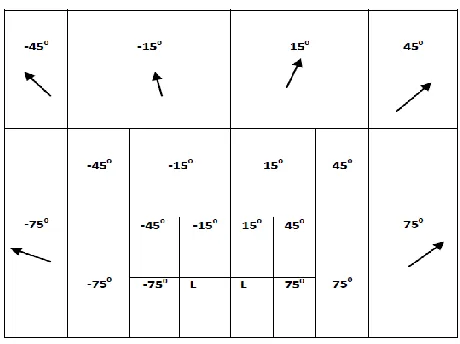
The complex wavelets are capable to differentiate between positive and negative the diagonal sub-bands can be distinguished and horizontal and vertical sub-bands are divided giving six distinct sub-bands in each scale at orientations ±150, ±450, ±750. The oriented and scale dependent sub-bands are visualized spatially in figure 3.
Figure 3: Complex Wavelet Transform Scale Orientation labelled sub-bands
[image:4.612.328.558.369.541.2]International Journal of Emerging Technology and Advanced Engineering
Website: www.ijetae.com (ISSN 2250-2459, ISO 9001:2008 Certified Journal, Volume 9, Issue 6, June 2019)
126
Steps:1. Read an MIT-BIH ECG file ([100.atr, 100.dat,
100.hea] ………..)
2. Extract Features of read x (ECG) and stored it in separate MAT file (ecgdata100.mat, ecgdata104.mat, ecgdata106.mat, ecgdata109.mat ………..)
3. Define value of F[], A[], N then apply remz() basic filter process // N = max sample length (taken 1024)
4. Apply DWT transformation in selected ecgdata*.mat
processed file.
5. Precede it for analyzing visualization level of the basis of the LL band of DWT process.
6. Since the ECG sample mydata is signed as well as unsigned 8-bit mixed type (the most common situation), values vary from 0 to 255 to each containing cell.
7. Apply decompositions on the basis of signal quality, noise level then precede it.
Approximation coefficient storage. Horizontal detail coefficient storage. Vertical detail coefficient storage. Diagonal detail coefficient storage.
8. Convert unrecognized values to unsigned 8-bit data.
9. Apply Adaptive intensity transfer function on different intensity levels of the decomposed ECG layers and stored it as SMTn_out.
10. On SMTn_out, apply kernel function to filter an ECG
layers after weighted map and smoothening
(SMTn_out).
11. The inverse DWT is applied on ECG layers fusion of the layered and HH, HL, LH bands to get the noise free data.
12. Process all decomposed and layered ECG’s to
DTCWT fusion block to compose all resultant as single noise free improved ECG and stored it as ECG_NF.
13. Apply IWPT.
14. Now calculates MSE, PSNR, PRD with standard
formulas
err = (sum(x- ECG_NF).^2)/N; er1 = size (err);
MSE=sqrt(err); ms = size(MSE);
PSNR = 10*log10(N/MSE); PRD = sqrt(MSE/sum(x.^2)*100);
V. CONCLUSION
The appraisal of the electrocardiogram (ECG) has been methodically used for diagnosing many cardiac diseases. In this paper DT-CWT by applying kernel filtering are uses for eliminating the noise from ECG with high accuracy and high frequency. This paper also presents an overview of various types of noise occur on ECG. The experimental result of propose work on comparing with existing methods, it gives enhance simulation results after analysing with performance metrics PDR, PSNR and MSE. In future work mainly focus on to develop such techniques or algorithm which is less complex and earliest de-noising the ECG with more accuracy. To make appropriate medical diagnosis, doctors often need to compare the ECG signal with the patient’s own individual record. Therefore modeling the ECG signal for each patient becomes very important in clinic practice. In addition, ECG signal is often corrupted with noise which makes an accurate diagnosis very difficult. ECG noise elimination is convoluted because of the time-varying nature of ECG signals. The customary schemes to eliminate high frequency noise from ECG signal are to employ a low-pass filter.
REFERENCES
[1] Suranai Poungponsri, Xiao-Hua Yu, “Electrocardiogram (ECG) Signal Modelling and Noise Reduction Using Wavelet Neural Networks”, Proceedings of the IEEE International Conference on Automation and Logistics Shenyang, China August 2009.
[2] Omid Sayadi and Mohammad B. Shamsollahi, “Multi-adaptive Bionic Wavelet Transform: Application to ECG De-noising and Baseline Wandering Reduction”, EURASIP Journal on Advances in Signal Processing, Volume 2007, Article ID 41274.
[3] Zhao Zhidong, Pan Min, “ECG De-noising by Sparse Wavelet Shrinkage”, 1-4244-1120-3/07/©2007 IEEE.
[4] Daniel Novak ,David Cuesta Frau, Vladimir Eck, Juan C. Pérez-Cortés, Gabriela Andreu-García ,“Denoising electrocardiogram signal using adaptive wavelets (extended abstract)”.
[5] A Alesanco, S Olmos, R Istepanian, J Garcia, “A Novel Real-Time Multilead ECG Compression and De-Noising Method based on the Wavelet Transform”, Computers in Cardiology,2003;30:593-596,IEEE.
[6] Pradnya B. Patil,Mahesh S. Chavan, “A Wavelet Based Method for Denoising of Biomedical Signal”, Proceedings of the International Conference on Pattern Recognition, Informatics and Medical Engineering , March 21-23, 2012.
International Journal of Emerging Technology and Advanced Engineering
Website: www.ijetae.com (ISSN 2250-2459, ISO 9001:2008 Certified Journal, Volume 9, Issue 6, June 2019)
127
[8] Qibin Zhao, and Liqing Zhan, “ECG Feature Extraction and Classification Using Wavelet Transform and Support Vector Machines,” International Conference on Neural Networks and Brain, ICNN&B ’05, vol. 2, pp. 1089-1092, 2005.
[9] F. Sufi, S. Mahmoud, I. Khalil, “A new ECG obfuscation method: A joint feature extraction & corruption approach,” International Conference on Information Technology and Applications in Biomedicine, 2008. ITAB 2008, pp. 334-337, May 2008.
[10] Menta Srinivasulu, K. Chennakeshava Reddy, “Novel Method to Find the Parameter for Noise Removal from Multi-Channel ECG Waveforms”, International Journal of Research in Engineering and Technology eISSN: 2319-1163 | pISSN: 2321-7308.
[11] Suranai Poungponsri, Xiao-Hua Yu, “Electrocardiogram (ECG) Signal Modelling and Noise Reduction Using Wavelet Neural Networks”, Proceedings of the IEEE International Conference on Automation and Logistics Shenyang, China August 2009
[12] R. Sivashkankar, R.TAMILSELVI and S.ABINAYA, “Noise Analysis & QRS Detection in ECG Signals” 2012 International Conference on Computer Technology and Science (ICCTS 2012) IPCSIT vol. 47 (2012) © (2012) IACSIT Press, Singapore DOI: 10.7763/IPCSIT.2012.V47.27
[13] A. D. Jeyarani, T. Jaya Singh , “Analysis of Noise Reduction Techniques on QRS ECG Waveform - by Applying Different Filters”, In proceeding of IEEE xplore.org
[14] Y.C. Yeha, and W. J. Wang, “QRS complexes detection for ECG signal The Difference Operation Method (DOM),” Computer methods and programs in biomedicine, vol. 9, pp. 245–254, 2008.
[15] G.M. Friesen, T.C. Jannett, M.A. Jadallah, S.L. Yates, S.R. Quint, and H.T. Nagle, “A comparison of the noise sensitivity of nine QRS detection algorithm,” IEEE Trans. Biomed. Eng. Vol. 37, pp. 85–98, 1990.
[16] J. P. Martınez and S. Olmos, Methodological principles of T wave alternans analysis: a unified framework. IEEE Trans. Biomed. Eng. 2005; 52 :599–613
[17] S. Z. Mahmoodabadi, A. Ahmadian, and M. D. Abolhasani, “ECG Feature Extraction using Daubechies Wavelets,” Proceedings of the fifth IASTED International conference on Visualization, Imaging and Image Processing, pp. 343-348, 2005.
[18] J. Kivinen, A. Smola and R. C. Williamson. Online learning with kernels, IEEE Transactions on Signal Processing, volume 52, issue 8, pages 2165-2176, 2004.
[19] N. G. Kingsbury, “The dual-tree complex wavelet transform with improved orthogonality and symmetry properties”, IEEE international Conference on Image processing, pages 375-378, September 2000.
[20] N. G. Kingsbury, “The dual-tree complex wavelet transform: a new technique for shift invariance and directional filters, IEEE Digital Signal Processing Workshop, 1998.