Topographical Proximity: Exploiting Domain Knowledge for
Sequential Data Mining
Ann Devitt
Ericsson
Dublin 4
Ireland
[email protected]
Joseph Duffin
Ericsson
Dublin 4
Ireland
[email protected]
Abstract
In today’s mobile telecommunications networks, in-creasingly powerful fault management systems are re-quired to ensure robustness and quality of service of the network. In this context, fault alarm correlation is of prime importance to extract meaningful information from the vast quantities of alarms generated by the net-work. Existing sequential data mining techniques ad-dress the task of identifying possible correlations in fre-quent sequences of telecoms alarms. These frefre-quent se-quence sets, however, may contain sese-quences which are not plausible from the point of view of network topol-ogy constraints. This paper presents the Topographical Proximity (TP) approach which exploits the topograph-ical information encoded in telecommunication alarms in order to address this lack of plausibility in mined alarm sequences. An evaluation of the quality of mined sequences is presented and discussed. Results show an improvement in overall system performance for impos-ing proximity constraints.
1
Introduction
Given the growing complexity of mobile telecommu-nications networks, the task of ensuring robustness and maintaining quality of service in the network requires increasingly powerful network management systems. Furthermore, the steady increase in size and complex-ity of the network produces a corresponding increase in the volume of data generated by network elements (e.g. alarms, performance indicators) placing added strain on management systems. In particular, the area of fault management remains a key problem area for network operators, as the speed at which faults are handled has very immediate consequences for network
2
Sequential Data Mining
Telecommunications alarm data is inherently tem-poral and sequential in nature, consisting of a series of timestamped events. The specific problem of identify-ing relationships between events in a sequential dataset can be viewed as a subset of the problem of mining for associations between dataset elements in general, constrained by the temporal aspects of the data. The domain of sequential data mining addresses this prob-lem space with the objective of findingnoteworthy se-quences of events or sequential patterns that suggest relationships between constituent events. In theory, the notion of noteworthiness may be task–specific. In practice, however, a sequence which is noteworthy of-ten equates to a sequence which occurs frequently in the input data. However, frequency as the sole measure of sequence “noteworthiness” is not a valid measure for network alarm data where frequency may indicate re-dundancy. The research presented here is motivated by the need to establish novel criteria for pattern selection in sequential data mining.
Much of the foundation work in sequential mining techniques shares a common historical origin in the Apriori association rule mining algorithm for transac-tion data [2]. Apriori is based on the assumptransac-tion that a frequent sequence of elements must consist of elements which are themselves frequent. The algorithm gener-ates a set of frequent sequences by iterating through a “generate and count” process, generating candidate se-quences of increasing length and pruning the set based on sequence frequency orsupport (i.e. normalised fre-quency) values. Candidates are generated by a process of merging two existing sequences of length n−1 to give a sequence of lengthn, as in example 1.
ABC+ABD=> ABCD (1)
The WINEPI [8] and GSP [10] algorithms were among the first to adapt the Apriori technique to mine for tem-poral association rules in sequential data. Both employ a sliding time window with a user-specified duration to traverse the input data, extracting sequences according to user-specified minimum and maximum sequence du-ration constraints. Although the basic premise for the two algorithms is the same, they differ in many design and implementation details. The GSP algorithm was designed for mining transaction data and, therefore, incorporates extra transaction-based constraints on vi-able candidate sequences. Furthermore, GSP events or items may be organised in a taxonomy allowing events or their superordinates in the taxonomy to be used for calculating support values or generating candidate sequences. WINEPI, on the other hand, is optimised
for flat sequential data, like telecoms alarm data and addresses the issue of full or partial ordering of event sequences.
Other Apriori-based approaches aim to optimise performance within the same conceptual framework. MINEPI [8] is an extension of the WINEPI algorithm which optimises space and time constraints by com-pressing event sequences to their minimal occurrence window. FreeSpan [5] focuses on the candidate gen-eration process employing a database of projected se-quence extensions to ensure that the system only gen-erates candidates that exist in the data. Its extensions, PrefixSpan [9] and IncSpan [3], modify the projected database structure and access to optimise the depth-first search of possible candidate sequences. SPADE [13] decomposes the search space and uses lattice-based search strategies to optimise performance.
Apriori-based approaches assume that the aim is to identify highly frequent patterns. Other approaches are designed to extract sequences according to differ-ent criteria. Weiss [12] describes a supervised machine learning system using genetic algorithms where the ob-jective is to predict rare, rather than frequent, equip-ment failures events on the basis of alarm sequences, candidates sequences are generated by a combination and/or mutation process. Heierman et al [6] use peri-odicity and length of sequences as well as frequency in their candidate selection process. Sterritt [11] presents a hybrid approach which combines genetic algorithms and Bayesian belief networks to derive structures based on sequences with a strong cause and effect relation-ship. The research set out below is based on an Apriori approach but introduces a novel criterion for sequence selection which evaluates sequence plausibility and co-herence in terms of network topology.
3
Topographical Proximity
the more closely connected the alarm-generating ele-ments, the more plausible and hence interesting the relationship between the alarms and the greater likeli-hood that there is some cause and effect relationship between them. At runtime, a measure of Topograph-ical Proximity is used to reject or promote candidate sequences on the basis of their connectedness. Not only does this ensure that the output sequence set is plau-sible within the context of the network, but the space and time constraints of the data mining process are optimised as the algorithm uses both frequency and proximity to reduce the dimensions of the candidate sequence set, thereby restricting the search space of possible correlations. The measure may also be used during post-processing to rank sequences in terms of the connectedness of their constituent alarm events. Section 3.1 outlines how the TP measure is calculated based on a generic network topology. Section 3.2 de-scribes how the measure has been integrated into the sequential mining process.
3.1
TP Calculation algorithm
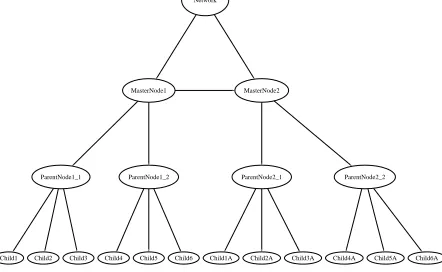
The TP algorithm calculates the logical distance be-tween alarm-generating network elements. The value has a minimum of zero for nodes that have no logical connection in the network and a maximum of one for nodes that have a very clear and close connection. TP calculation is based on the Radio Access Network of a standard UMTS telecommunication network which consists of functional nodes connected by communica-tion interfaces and arranged in a logical, hierarchical structure, represented by the simplified schema in fig-ure 1.1
Each node in this system has functional sub-components which may generate fault alarms which are then communicated to a designated Radio Access Net-work Management Node via a standard interface. Node subcomponents represent a node’s internal functional-ity, the functionality of the interfaces between nodes or logical communications artefacts. The position of an alarm-generating node in the hierarchical structure is encoded in its full distinguished name, included in the source node attribute of each alarm.
In the context of this hierarchical network, the topo-graphical proximity value for network elements on the same branch of the network is automatically assigned the maximum value of 1, to reflect the direct descen-dancy relation between the network elements, for
ex-1The TP calculation algorithm, however, is valid for any
net-work which consists of functional nodes connected by interfaces and arranged in a logical structure. In [4], we describe how prox-imity values may be predefined as constants and assigned on the basis of shared and disjunct topographical information of alarm-generating nodes.
MasterNode1 MasterNode2
ParentNode1_1 ParentNode1_2 ParentNode2_1 ParentNode2_2
[image:3.612.317.538.31.167.2]Child1 Child2 Child3 Child4 Child5 Child6 Child1A Child2A Child3A Child4A Child5A Child6A Network
Figure 1. Simplified telecommunications net-work schema
ample between Child1 and ParentNode1 1 or ParentN-ode2 2 and MasterNParentN-ode2 in figure 1. For network ele-ments that are not on the same branch of the network (e.g. Child5A and Child1 in figure 1), the topograph-ical proximity value equates to a weighted traversal of the network branches or edges between two network el-ements. The TP value represents the total number of edges that must be traversed to find a path between the two elements. The weighting reflects the assumption that some hierarchical relations are closer than others. For the purposes of this analysis, logically, Child nodes form tighter clusters around Parent nodes than Parent nodes around Master nodes. This reflects the assump-tion that alarms on elements lower in the hierarchy may be more likely to share a common cause. Thus, nodes Child1 and Child2 in figure 1 are deemed closer in the context of the network than nodes ParentNode1 1 and ParentNode1 2.
For any two alarms, the source node attribute of each alarm is parsed to give the inheritance hierarchy of the network element with which that alarm is asso-ciated. The Topographical Proximity value for the two associated network elements is then calculated accord-ing to algorithm 1. Examples 2 to 4 below provide some sample TP values based on the network elements in figure 1.
T P calculation(Child1, Child3) = 0.8 (2)
T P calculation(Child1, Child6) = 0.4 (3)
T P calculation(Child1, Child1A) = 0.05 (4)
3.2
Integration of TP to the mining algorithm
gen-Algorithm 1TP calculation algorithm
Input: 2 network elements, E1 and E2
Output: TP value, 0≥T P ≤1 TP = 0
if sameBranch(E1, E2)then
Return 1
end if
if sharedParentNode(E1, E2)then
T P+ = 0.4
end if
if sharedMasterNode(E1, E2)then
T P+ = 0.35
end if
if sharedNetwork(E1, E2)then
T P+ = 0.05
end if
Return TP
eration component of the MINEPI algorithm [8]. MINEPI generates candidate sequences of lengthnby combining two existing sequences of lengthn−1 and stores the minimal, or most compact, occurrences of all frequent sequences for subsequent iterations. Our algo-rithm filters all occurrences of candidate sequences on the basis of their connectedness within the network, as represented by the TP value calculated for the alarm-generating network elements. This filtering can be im-plemented in one of two ways:
1. Store minimal occurrences of all sequences above a given TP threshold;
2. Store the occurrences with the highest TP value of all sequences.
In the first case, the space constraints of the system are optimised for sequence compactness, in the second for sequence connectedness. In order to compare the performance of the original Minepi algorithm with that of the Topographical Proximity approach, the experi-ment reported in section 4 take the first approach using the TP value to prune the candidate set rather than to explicitly optimise sequence storage. The final step, as with Minepi, prunes the remaining candidate set based on a support (i.e. frequency) threshold.
Each minimal occurrence of a sequence has an as-sociated proximity value. For sequences of length two, the TP value is calculated according to algorithm 1. For longer sequences, the TP value is the mean of the TP values for the two existing occurrences to be merged and the proximity value calculated for the source nodes of the first and last alarms of the new candidate, as in algorithm 2. For example, candidate sequence 7 below
Algorithm 2calculateSequenceTP
INPUT: seq,{alarm1, alarm2. . . alarmn}
OUTPUT: TPvalue
if length(seq) == 2then
returncalculateT P(alarm1, alarm2)
else
T Pseq1 = Retrieve from memoryT Palarm1···(n−1) T Pseq2 = Retrieve from memoryT Palarm2···n T Pnew=calculateT P(alarm1, alarmn)
return T Pseq1+T Pseq2+T Pnew 3
end if
is composed of subsequences 5 and 6.2
Seq1 =Child1, Child3, M asterN ode1 (5)
Seq 2 = Child3, M asterN ode1, Child1A (6)
Seq =Child1, Child3, M asterN ode1, Child1A (7)
T PSeq, the TP value for the new candidate sequence
Seq, is calculated as follows, where the only new TP calculation evaluates the connection between Child1 and Child1A:
T PSeq=
T PSeq1+T PSeq2+T P calc(Child1, Child1A)
3
(8) The added cost of the TP computation is minimal as for each occurrence of a new candidate sequence, only one new TP calculation is carried out. Furthermore, the cost is offset by the reduction in the search space of candidate sequences at each iteration achieved by imposing a minimum TP value threshold. Unlike a support threshold, the TP threshold is not an arbi-trary means of reducing the set of candidate sequences. The TP threshold can be set to reflect domain experts intuitions regarding what connections constitute plau-sible sequences in their network. A support threshold is imposed after the TP threshold but the frequency constraint can be more flexible given the candidate sequences set is pre-pruned for proximity. Section 5 explores how the use of the topographical proximity threshold interacts with the standard mining parame-ters of maximum sequence duration and minimum sup-port value to obtain optimum results in a qualitative evaluation of mined sequences.
4
Experiments
A set of experiments was conducted in order to pro-vide a qualitative evaluation of the mining algorithm at
2For the purposes of illustrating the TP calculation, the
different topographical proximity thresholds. To date, research has tended to focus on system performance, justifiably given the intensive computation involved in the mining process. What has been notably lacking, however, is an evaluation of the quality of the mined sequences. The experiment described below aims to address this shortfall. To this end, the mining task has been formulated as one of identifying specific target sequences in the data. The experiment was run on a Pentium 4 3.2 GHz processor with 2 GB of RAM run-ning Microsoft Windows XP Professional version 2002.
4.1
Test Cases
For the purposes of this experiment, the time win-dow and minimum support system parameters were tested within the ranges of 60-600 seconds at 60 sec-ond intervals and 25-175 occurrences at intervals of 25, respectively. This gives a total of 70 test cases (10 time windows ∗ 7 support values) for each Topographical Proximity (TP) threshold value. For each time window and support parameter combination, baseline system performance of Minepi without Topo-graphical Proximity (T P = 0) was calculated. Six fur-ther test cases for each parameter combination were evaluated at T P ={0.5,0.6,0.7,0.8,0.9,1}. The aim was to determine optimum system parameters and TP threshold values from the 490 (10∗7∗7) test cases and to establish whether the imposition of a TP threshold improved the quality of the output sequence set.
4.2
Methodology
Most commercially available alarm management systems are fully dependent on the expertise and ex-perience of network analyst to derive rules for filtering and correlating alarms. This experiment aims to pro-vide a global measure of the quality of the performance of the mining algorithm evaluated in the context of the domain knowledge of such experts. This objective has been formulated as the task of identifying in live work data common alarm sequences specified by net-work analysts.
Dataset. The basic dataset for the experiments con-sists of 96,991 alarms from the Radio Access Net-work (RAN) of a live telecommunications netNet-work.The alarm format conforms to telecoms standards [1] and includes a timestamp with a granularity of milliseconds and thirteen attributes relating to four broad categories of alarm timing, event lifecycle, alarm type and alarm source details.
Target Sequences Set. The quality of the output frequent event sequences must be evaluated relative to the frequency of known event sequences in the in-put data. In order to compile a target set of event sequences, a detailed statistical analysis of the alarm data was conducted by network experts. The analy-sis focused on the most frequently occurring individ-ual alarms in order to identify repeating alarms and suspected correlations among the frequent alarm set. The results was a target set of twenty event sequences consisting of eighteen repeating alarm sequences, nine of length two events and nine of length four, and two inter-event correlations of length two and four. This set of twenty sequences represents a baseline of gold standard sequences which experts extrapolate from the dataset and which the algorithm should identify in the dataset.
Procedure. The mining algorithm was run on the dataset of 96,991 alarms for the 490 test cases set out in section 4.1. For each test case, three performance metrics were calculated based on the number of tar-get sequences from the set of twenty tartar-get sequences identified for these parameters and threshold values.
4.3
Performance Metrics
The metrics used to determine performance in the experiment reported below are the measures of pre-cision and recall borrowed from the Information Re-trieval domain. In the context of this mining experi-ment, the measures are defined as follows:
• Precision: the number of correctly identified tar-get sequences relative to the total number of se-quences found by the system.
P recision= Number of target sequences foundTotal number of sequences found
• Recall: the number of correctly identified target sequences relative to the total number of target sequences.
Recall=Number of sequences in the target setNumber of target sequences found
accurate with respect to the target sequence set. The F Score is calculated according to the following formula:
• F Score= 2 * Precision * RecallPrecision + Recall
The performance metrics were calculated for perfect matches of target sequences identified by the system. They focus on the performance of the mining algorithm in terms of its ability to identify patterns known to ex-ist in the data while restricting these patterns to ones which represent plausible connections in a telecommu-nications network. Results are presented and discussed in section 5.
5
Results
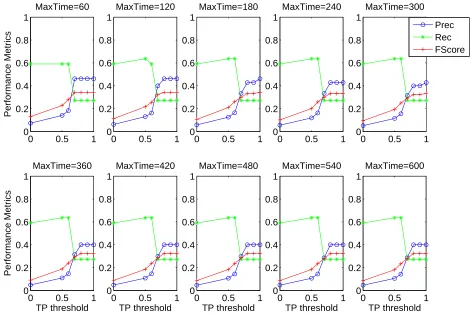
In order to isolate the impact of the Topographical Proximity value on system performance in this exper-iment, the effects of the time window and support pa-rameters were analysed. The ten graphs in figure 2 il-lustrate performance for each of the ten time windows from 60 to 600. Each graph plots the three perfor-mance metrics of precision, recall and F Score for all TP value thresholds: the Minepi baseline (T P = 0) and
T P = {0.5,0.6,0.7,0.8,0.9,1}. The figure illustrates that there is little variation in performance across the ten time windows. This would strongly suggest that window size is not a significant factor in the task of identifying target sequences. This can be attributed to the fact that the sequences are short in duration and therefore should be identified at all window sizes above 60 seconds. Figure 2 presents the results derived using a support threshold of 100 but results at all support thresholds exhibit the same characteristics.
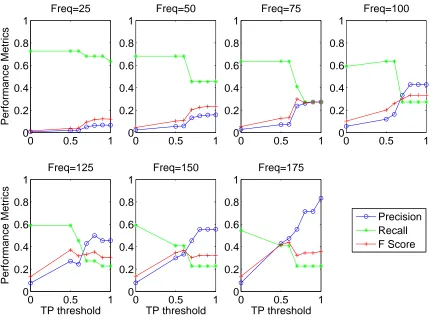
The minimum support parameter, however, has a much greater effect on sequence identification, as illustrated in figure 3. The seven subplots demonstrate system performance for support values {25,50,75,100,125,150,175}at a time window of 240 seconds. The plots show quite different behaviour for the seven support thresholds. It is therefore in the con-text of these seven experimental conditions represented by the seven support thresholds that we evaluate the effect of the TP value on system performance.
Figure 3 demonstrates a clear trend across all sup-port value thresholds: as the TP threshold increases, there is a decrease in recall with a corresponding in-crease in precision, giving an overall inin-crease in F Score value. This trend reflects the trade-off between repro-ducing the target sequence set in the output and gen-erating a more restricted and, therefore, precise set of output sequences. The trade-off is such that, despite the reduction in recall values, overall performance, rep-resented by the FScore value, improves as higher TP
thresholds are enforced. This result validates expec-tations that restricting the sequence selection process to only accept topographically plausible sequences will significantly reduce the number of spurious sequences identified, thereby reducing the search space at runtime and facilitating post-processing. Furthermore, the re-duction in recall values, particularly forT P≥0.7, may be addressed by employing the second strategy outlined in § 3.2 of optimising sequence storage with reference to proximity rather than sequence duration.
The results reported here would suggest that the use of the topographical proximity value yields a favourable trade-off between accuracy and recall for sequential data mining of telecoms alarm data. Furthermore, we would suggest that the output sequence set for higher TP thresholds more accurately represent the opinion of domain experts that:
• interesting correlations occur on related or con-nected nodes;
• frequency alone may not be an appropriate cri-terion for identifying noteworthy sequences in telecommunications data.
6
Future Work
The research reported in this paper suggests two complementary directions for future work. The first is to extend the topographical proximity measure to a broader sequence validation methodology. This can be addressed by identifying those attributes of indi-vidual alarms, which are significant, not for classify-ing individual alarms into types, but at the sequence level for validating alarm sequences. Future imple-mentations aim to exploit attributes such as alarm severity and probable cause to generate a more refined measure of sequence plausibility by which to constrain the sequence generation process. Furthermore, the al-gorithm described in this paper assumes a simplified and homogeneous network topology. This is an over-simplification which needs to be addressed in future development by exploiting other explicit connections within the telecoms network.
0 0.5 1 0
0.2 0.4 0.6 0.8 1
MaxTime=60
Performance Metrics
0 0.5 1
0 0.2 0.4 0.6 0.8 1
MaxTime=120
0 0.5 1
0 0.2 0.4 0.6 0.8 1
MaxTime=180
0 0.5 1
0 0.2 0.4 0.6 0.8 1
MaxTime=240
0 0.5 1
0 0.2 0.4 0.6 0.8 1
MaxTime=300
0 0.5 1
0 0.2 0.4 0.6 0.8 1
MaxTime=360
TP threshold
Performance Metrics
0 0.5 1
0 0.2 0.4 0.6 0.8 1
MaxTime=420
TP threshold
0 0.5 1
0 0.2 0.4 0.6 0.8 1
MaxTime=480
TP threshold
0 0.5 1
0 0.2 0.4 0.6 0.8 1
MaxTime=540
TP threshold
0 0.5 1
0 0.2 0.4 0.6 0.8 1
MaxTime=600
[image:7.612.86.558.31.356.2]TP threshold Prec Rec FScore
Figure 2. Performance metrics by TP threshold,60≤timeW indow≤600,support= 100.
correlations have been tagged in the data by domain experts.
7
Conclusions
The main contribution of this paper is to intro-duce the Topographical Proximity (TP) approach for sequential mining of telecommunications alarm data. This measure exploits the topographical information encoded in alarms to validate all candidate sequences at run-time with respect to the plausibility of the pos-sible correlation they represent. The second significant contribution is to provide a qualitative evaluation of the performance of the mining algorithm. The evalu-ation results strongly suggest that the performance of the mining algorithm improves with the inclusion of the TP measure.
References
[1] 3GPP. 3rd generation partnership project techni-cal specification group services and system aspects. Telecommunication management. Fault Management. Part 2: Alarm Integration Reference Point (IRP), In-formation Service (IS), (Release 6) 3GPP TS 32.111-2 V6.3.0, 3GPP, 2004.
[2] R. Agrawal, T. Imielinski, and A. N. Swami. Min-ing associations between sets of items in massive data-bases. InProceedings of the ACM-SIGMOD 1993 In-ternational Conference on Management of Data, pages 207–216, Washington, D.C., may 1993.
[3] H. Cheng, X. Yan, and J. Han. Incspan: Incremental mining of sequential patterns in large databases. In Proceedings of KDD 2004, 2004.
[4] A. Devitt, J. Duffin, and R. Moloney. Exploiting network topology in mining sequential patterns from telecommunications alarm data. In Proc. of SIG-COMM 2005, MineNet Workshop, pages 179–184, 2005.
frequent-0 0.5 1 0
0.2 0.4 0.6 0.8 1
Freq=25
Performance Metrics
0 0.5 1
0 0.2 0.4 0.6 0.8 1
Freq=50
0 0.5 1
0 0.2 0.4 0.6 0.8 1
Freq=75
0 0.5 1
0 0.2 0.4 0.6 0.8 1
Freq=100
0 0.5 1
0 0.2 0.4 0.6 0.8 1
Freq=125
TP threshold
Performance Metrics
0 0.5 1
0 0.2 0.4 0.6 0.8 1
Freq=150
TP threshold
0 0.5 1
0 0.2 0.4 0.6 0.8 1
Freq=175
TP threshold
[image:8.612.86.515.30.353.2]Precision Recall F Score
Figure 3. Performance metrics by TP threshold,25≤support≤175,timeW indow= 240.
pattern tree approach. Data Mining and Knowledge Discovery, 8(1):53–87, 2004.
[6] E. O. Heierman, G. M. Youngblood, and D. J. Cook. Mining temporal sequences to discover interesting pat-terns. InProceedings of KDD 2004, Workshop on min-ing temporal and sequential data, 2004.
[7] ITU. Itu-t recommendations: M.3030 principles for a telecommunication management network, 1988. [8] H. Mannila, H. Toivonen, and A. I. Verkamo.
Dis-covery of frequent episodes in event sequences. Data Mining and Knowledge Discovery, 1:259–289, 1997. [9] J. Pei, J. Han, B. Mortazavi-Asl, J. Wang, H. Pinto,
Q. Chen, U. Dayal, and M.-C. Hsu. Mining sequential patterns by pattern-growth: The prefixspan approach. IEEE Transactions on Knowledge and Data Engineer-ing, 16(10), 2004.
[10] R. Srikant and R. Agrawal. Mining sequential pat-terns: Generalizations and performance improve-ments. InProceedings of the 5th International Confer-ence on Extending Database Technology, EDBT, 1996. [11] R. Sterritt. Discovering rules for fault management. In Proceedings of the Eighth Annual IEEE International
Conference and Workshop on the Engineering of Com-puter Based Systems (ECBS ’01), pages 190–196, Apr. 2001.
[12] G. M. Weiss. Predicting telecommunication equip-ment failures from sequences of network alarms. In W. Kloesgen and J. Zytkow, editors, Handbook of Knowledge Discovery and Data Mining. Oxford Uni-versity Press, 2002.