Using in-car feedback to influence travel decisions
I. T. Byrne, BA, BAI, MSc, M. M. O'Mahony, BE, DPhil, FIHT,B. M. Broderick, BE, MEngSc, PhD, DIC and W. D. E. O'Sullivan, BE, MIE, MEng
It is widely accepted that there is a need to reduce private car use, thereby alleviating congested urban areas and reducing fuel consumption and emissions from transport vehicles. This paper examines one approach to achieving this aim, based on the hypothesis that car owners do not correctly perceive the full cost of a car trip. The primary objective of the research was to assess the potential for correcting this misperception through the use of a digital car running-cost meter, installed on the dashboard of a car, which displays on a real-time basis the cost of each trip. Cost meter information on marginal trip cost, external cost and the effect of driving style was provided to a sample of drivers in a small pilot action in Dublin. The findings from the data (diaries and interviews) are presented and extrapolated by means of a transport network model to assess potential energy savings. The key findings from the work are as follows. (a) There was a significant reduction in off-peak-period trips observed as a result of the car meter but there was no significant reduction in time spent in the car, distance travelled by car and the cost of driving. (b) A surprising finding from the project was that 40% of the subjects who happened to be changing their vehicle shortly after being involved in the project chose more fuel efficient vehicles. They attributed their choice in part to their increased awareness of fuel costs as a result of their involvement in the project.
Keywords: transport management; transport planning
Introduction and objectives
1. The understanding and modelling of driver behaviour are essential if a successful solution is to be obtained to reducing car travel. In relation to travel decisions Metcalf 1 hypothesized that while most of the characteristics which determine travel behaviour within a generalized cost formulation are well understood, the perception of the costs of motoring are weighted incorrectly by car drivers. As a result, the costs of running a car have little effect on car drivers' travel decisions. In general, when drivers select the car as a mode of transport, even in cases where feasible alternative options exist, they do not take account of the full cost of a car trip, either average or marginal. A method of informing the driver of the real cost of travel may allow this behaviour to be altered. Metcalf 1 and O'Sullivan2 proposed such a solution through the use of a car running-cost meter displaying, in real time, the cost of car travel.
2. To test all the above hypotheses, an experiment was structured, on a pilot basis, to establish the effectiveness of such a car running-cost meter on driver decision-making and to assess the
desirability of staging a larger-scale experiment. The experiment involved a sample of ten car drivers in Dublin who used their car to commute to work, but who also had an alternative mode of transport available to them.
Misperception of car running costs
4. Metcalf1 identified a key problem in the allocation of energy resources, namely the mis· perception of car running costs by drivers. Fuel cost is the overriding cost of which most people are aware. In the case of Ireland, the combined excise and VAT on fuel amounts to 64% for petrol and 60% for diesel (excise is lower on diesel). The implication for the transport market of a perceived cost not being equal to a resource cost is an economic distortion in which the allocation of that resource will not be optimal.
5. The findings of O'Farrell and Markham3 endorsed the view that most people take only the marginal cost of driving into account. They found that over 60% of the drivers interviewed in a survey considered only the fuel cost of a trip. Metcalf 1 concluded that car running costs are not considered in the choice of travel mode. It was also hypothesized that car users are probably unaware of the costs of driving both in absolute and in relative terms.
Experimental methodology and sample
6. The methodology used in the project covered a wide range of issues, including the design of the car meter survey and the meter itself, as well as the design of the behavioural research, such as the criteria to be included when selecting the sample of drivers. Funding allowed for only a small sample but it was sufficient for the purposes of the pilot action to tease out likely problems for the design of a full-scale project. All of the subjects were required to be commuters using their car for their work trip to Dublin city centre. Another requirement was that they should have a feasible alternative transport mode. The sample included subjects with a wide range of socioeconomic characteristics.
Design of the car meter survey
7. A combination of travel diaries, questionnaires and interviews was employed in an extensive data collection procedure. The information required of the participants in the interviews was mainly related to choice of route, choice of mode, number of trips made by car, trip chaining and changes in overall quantity of travel. However, the interviews also included questions relating to the participants' assessment of the meter, along with other questions on driver behaviour, driving s style, attitudes to public transport, attitudes to cost of travel and fuel efficiency.
8. To ensure a structured management of the survey it was divided into three separate phases. Phase I concentrated on the reaction of the drivers to the marginal private costs of car travel. The marginal private cost used was a summation of the fuel, mileage-related depreciation and
maintenance costs. Phase II was concerned with observing the drivers' reactions if they were required to pay for the marginal external costs of their travel. The marginal costs consisted of the marginal cost of congestion, pollution, noise and accidents. Finally, phase III concentrated on driving style, to determine whether a display on the car meter showing varying fuel consumption at different speeds could influence driving style. The timetable for phases I- III, including the timing of the questionnaires and interviews, is presented in Table 1.
9. The car meter used in the project was designed by the International Ecotechnology Centre at the University of Cranfield and was reprogrammed to suit the conditions of the experiment. One significant feature of the instrument is that it employs a simulation of fuel consumption and therefore does not require intervention in the vehicle's fuel supply pipes or engine management system.4 Instead, the meter uses a model-specific sensor to detect pulses from the speedometer cable. A specific relationship between this pulse rate and fuel consumption, for which the car meter has been calibrated, is then used to quantify fuel usage.
10. In another project5 it was found that nearly 50% of the meters were accurate to within 4% and the inaccuracy of the remainder did not exceed 11 %. While these figures are impressive, it should be noted that, for the purposes of this study, it is more important that the drivers actually believe that the meter output is accurate.
11. Information is presented to the driver using a total of five meter functions. These are
• function 1: distance (dis played in miles) • function 2: marginal private cost (£)
• function 3: current cost rate (£ for 100 miles of travel or mpg) • function 4: speed (mph)
• function 5: marginal external cost (£).
Calibration procedure and data inputs
12. The meter is calibrated to suit each individual car in which it is installed. The most important part of the procedure is to calibrate the meter against a measured mile so that it can detect the correct distance travelled. The next stage of the procedure is to input the calibration constants into the meter. These relate to fuel costs per litre, miles per gallon for the vehicle, non-fuel costs per mile and congestion costs.
13. The unit fuel costs were determined by means of a road test which was set up to establish each individual car's fuel consumption values for urban driving conditions. Each driver was requested to fill the fuel tank of their car and to note the mileage completedbefore topping up the fuel tank again. Thisallowed the miles per gallon actually achievedby the vehicle to be calculated (Table 2). Anadditional benefit of this approach is that it allows each driver to participate in the calibration process for their vehicle, thereby increasing their confidence in its accuracy.
14. In the calculation of maintenance costs each driver was requested to estimate the amount they
spent on car services and assumptions were made to arrive at a marginal maintenance cost related to mileage. Depreciation values were taken from Motor Trade Publishers6. A summary of the unit
costs for allvehicles in the sample is presented in Table 3.
Experimental results
(a) no meter (diary week I)
(b) private cost displayed (diary week II) (c) external cost displayed (diary week III)
(d) car meter removed (diary week IV).
Data from the diaries can be used to determine whether a significant relationship exists between these conditions and a set of independent variables that depend on driver behaviour. This set consists of the number of trips made, the time spent travelling, the distance travelled
and the total cost.
16. Figure 1 displays the change in the average value of these variables, for each diary week. Eight
of the drivers showed a drop in thenumber of trips made between diary weeks I and II, while the
other two drivers' trip totals remained unchanged. A further small decrease in the average number
of trips was observed in diary week III, when the drivers had beenexposed to the external costs of travel. Eight drivers made fewer trips in week III than in week I, one driver actually increased his/her number of trips and one driver's trips remained unchanged. In diary week IV, with the meterremoved, the trip average did not return to that of diary week I. Instead, it remained at the same level as that of diary weeks II and III, indicating that the exposure to the meter had an enduring effect on the drivers.
18. It is difficult to ascertain whether the changes in travel pattern described in Fig. 1 are actually attributable to the effects of the meter. To investigate this fully, a statistical analysis of the individuals' data is required to determine whether the changes observed are significant, or merely within the range of experimental scatter.
Analysis of quantitative results
19. The technique applied in this project of using a s ingle group of drivers for all the experimental conditions is called repeated measures design.7 Instead of randomly allocating a larger number of drivers to different groups so that each group experienced one condition, the drivers were kept in a single group so that each driver experienced all four experimental conditions in succession. In general, the repeated measures design is considered more powerful than using independent groups for each condition. The widely-used Student's t-test was applied to the data recorded by each driver in each diary week to determine the significance of any observed change in average travel
behaviour.
Number of trips made
20. The number of trips made by drivers under each of the test conditions is shown in Table 4. It can be seen that there was some reduction in the number of trips in the cases when the private costs and the external costs were displayed to the drivers. The t-test result indicates significance values of 0·005 for the cases of both exposure to private costs and exposure to external costs. As a value of 0·05 or less is generally considered significant, the statistical analysis would indicate that the changes in the number of trips compared with the baseline data were influenced by the exposure of the drivers to both costs. A significance of 0·092 was realized for the comparison between the baseline trip data and the trip data taken after the survey, i.e. after the meter was removed. This indicates that the drivers were apparently returning towards their baseline trip numbers.
22. Table 5 compares the number of social/other trips made by each driver in the individual diary weeks. The mean value is seen to decrease from the baseline in all three cases subsequent to diary week I. With exposure to private costs, the number of these trips reduced by 23%, while with subsequent exposure to external costs, a further 11% reduction was observed. These reductions are significant at just over the 10% level for the private-cost case, but at the 1% level for the external-cost case. These data would seem to confirm that the presence of the meter caused drivers to reduce their non-essential trip-making. Table 6 indicates the influence by trip purpose, where it can be observed that the impact of the meter on social/other trips is more influential than for other trip purposes.
Time spent in the car
23. The time -spent in the-car generally decreased for most of the drivers in the sample after exposure to the costs of travel, as can be seen in Table 7. This table shows the time spent in the car in each week as a percentage of the mean distance travelled in week I. However, when the significance of these decreases is examined, only the case of external-cost display comes close to significance, with a value of 0·069. One explanation for the less significant influence of the meter on travel times than on trips is that the experimental design concentrated on the journey to work. For manydrivers, work
trips contribute disproportionately to their total travel time and as there was little impact on work trips, total travel time was not significantly affected.
Distance travelled by car and cost of car travel
24. The distance travelled by each of the drivers in the Dublin sample, when exposed to private
costs, external costs and no costs, are compared with the baseline data in Table 7. The table shows
the mean distance travelled ineach week as a percentage of the mean distancetravelled in week I.
The t-test results reveal that the influence of the car meter on the distance travelled by car is not
statistically significant, in contrast to what was found earlier for the number of trips. Conclusions
similar to those made for the distance travelled by car can be drawn for the cost of car travel.
Questionnaire results
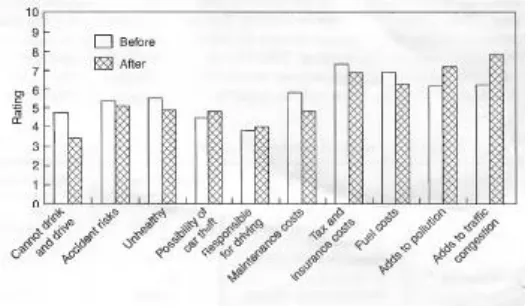
25. Questionnaires were completed by the car drivers before and after the survey. As a part of these questionnaires the drivers were requested to place in order of preference the advantages and
disadvantages associated with using their cars. The results from the two questionnaires were compared to ascertainwhether the drivers' attitudes regarding these advantages and disadvantages
of car use had changed during the course of the survey.8 To enable the results to be displayed graphically, the drivers' first preferred option was given a score of 10, with their second preferred option receiving a score of 9 and so on. The averagescores for each advantage and disadvantage are shown in Figs 3 and 4, respectively.
26. It is reasonable to expect the meter to have had some effect on driver opinion with regard to
economy of the vehicle, speed, maintenance costs, fuel costs, pollution and congestion. The other
parameters shown in Figs 3 and 4 would not be directly affected by the meter; however, relative
changes in their rankings might occur. As can be seen from Fig. 3, therewere some changes between
Perversely, participants rated the economy of the car higher than before. In both cases the most
popular advantage of the car was that it was always there when it was needed.
27. After the survey, fuel, maintenance, tax and insurance costs were rated as less disadvantageous, reinforcing the previous observation of an increase in the economic-advantage rating for the car. As can be seen in Fig. 4, theattitude towards the environment clearlychanged as a result of the survey,
where pollution and traffic congestion were rated as a greater disadvantage after the survey.
Fig. 3 Advantages of using a car
Fig. 4. Disadvantages of using a car
Qualitative results
29. The interviews conducted with the individuals provided an excellent insight into the drivers'
responses and attitudes to the car meter and the survey as a whole. Most of the car drivers were
impressed with the car meter and found the displays useful and interesting9. This suggests that
displaying travel costs by way of a car meter is a practical and beneficial means of enhancing car
drivers' knowledge and awareness of travel costs. However, some of thedrivers argued that marginal
depreciation andmaintenance costs should not be included in the running costs, basing their trip decision making only on fuel costs. A programme of education revealing the true costs of motoring may therefore be justified. Seven drivers admitted that their awareness of the costs of motoring had
been enhanced to some extent.
30. Most of the sample considered the current cost of fuel to be too low to cause them to consider switching to another mode of transport. In the event of fuel costs being increased significantly, some
[image:10.612.71.339.333.477.2]true marginal costs (including marginal depreciation and maintenance costs) as actual distance-related costs, it is likely that modechanges and trip suppression could be achieved without the need to raise fuel prices.
31. Five drivers said their behaviour had been affected by the car meter in some way. Onedriver
made fewer trips and one driver changed mode for social trips. While six of the driverssaid their
attitudes, mainly towards the cost of
travel, had changed, many of the driver considered the car to be essential for most of their trips
and would not change mode regardless of being informed of the costs. The external-cost display
had little effect on the drivers. This was attributed to both a lack of familiarity with the concept and the lack of an incentive for drivers to change their behaviour.
32. In the third phase of the project, a display of fuel consumption was used to try toinfluence car drivers' style of driving. The subjects found this information particularly useful on long journeys, where they tended to minimize their fuel consumption by selecting the most economic speed. Within the period of the study, four of the drivers in the samplepurchased more fuel-efficient cars with smaller engine sizes. These drivers admitted that anincreased awareness of fuel efficiency had
influenced their decisions. This was an unexpectedresult and was noted from interviews conducted
with the drivers towards the end ofthe project. It was evident from the interviews that most subjects
had an increased awarenessof car travel costs.
Energy savings assessment
33. The above analysis of travel diary data showed an average reduction in off-peak trips of 16%. As the data in Table 5 showed that this decrease was statistically significant, a network transportation model was used to assess the fuel/energy saving that would accrue if asimilar 16% reduction in trips
was achieved forthe whole car-using population of Dublin.
34. This decrease in trips was modelled by reducing the off-peak travel demand matrix in a network model of Dublin10by 16%. In the simulation, this change caused a reduction in congestion, which
led to increased travel speeds and reduced distances travelled within the network. These, in addition to the effect of thereduced demand itself, impacted on the total fuel consumption in the modelled hour, causing the number of fuel litres used to drop from 70 251 litres to 56 467 litres per off-peak hour, a 19·6% decrease. It should be noted, however, that this analysis represents an extrapolation
of results obtained on the basis of a very small sample and as such, in the absence of further
validation through large-scale experimental work, provides only an indication of the potential benefits offered by a universal metering strategy.
Conclusions
35. In-vehicle meters appear to offer the potential for reducing the demand for car travelby causing
a behavioural change on the part of individual drivers. It is clear that the cardrivers in the sample for the most part underestimatedtheir travel costs. Most drivers appeared to neglect mileage-related
36. While most of the drivers were impressed by the meter and found its output credible, the new information provided was not meaningful enough to cause them to changemode to any great degree.
37. It is noteworthy that when some of the drivers in the sample changed their vehicle, they opted for more fuel-efficient cars and admitted that the enhanced information gained from the survey greatly influenced their decision. This would suggest that their attitudes towards the costs of motoring had been affected and that the information provided by the car meter resulted in an increased awareness of these costs.
38. The provision of information on private and external costs significantly affected the number of
trips made by the sample. Overall, an average reduction of 16% in off-peak trips was observed.
However, trip-making patterns in the peak period did not change significantly. The influence of the car meter was generally not strong enough to affect mode selection; this was especially the case for commuting trips.
39. The result obtained from the energy savings assessment for Dublin reveals the potential of such meters. This assessment yielded a fuel saving of approximately 19·6%.
40. The results of the car meter experiment suggest that some form of in-vehicle instrumentation
informing the driver of travel costs should be built into all new cars. However, confirmation of the findings requires both a large-scale study and one extended over time.
Acknowledgement
41. The authors wish to acknowledge the support of the EU DGXVII SAVE I programme.
References
1. METCALF A. The Misperception of Cm· Running Costs and Its Impact on the Demand for Energy in the Transport Sector. NATO Advanced Science Institutes, Series C. Plenum, London, 1982.
2. O'SULLIVAN W. D. E. Examining the Effectiveness of a Car Running Cost Meter. NATO Advanced Science Institutes, Series C, 1982.
3. O'FARRELL P. and MARKHAM J. The journey to work-a behavioural analysis. Progress in Planning, 1975, 3, No. 3.
4. COUSINS S. Autostar Car Computer. Autostar, Cranfield, 1996, supplier literature.
5. POTTER S. Survey of Autostar Car Computer Users, Report of the Energy and EnvironmentResearch Unit. The Open University, MiltonKeynes, 1991.
6. MOTOR TRADE PUBLISHERS. CarSales Figures Guide . Motor Trade Publishers, Dublin, 1997.
7. LEHMAN R. S. Statistics in the Behavioural Sciences. Brooks/ Cole, London, 1995.
8. BYRNE I. T. The Effectiveness of In-vehicle Instrumentation for Transport Energy Savings . MSc
thesis, Trinity College, Dublin, 1997.
9. O'MAHONY M., BYRNE I., COUSINS S. and O'SULLIVAN D. Final Report on Influence of
Mode Choice on Transport Energy Savings. SAVE I Programme. CEC, Brussels, 1997.