Chemistry Theses
Department of Chemistry
Spring 5-10-2014
Optimizing the Production Parameters of
Engineered Protein-Based MRI Contrast Agents
Rose Auguste
Georgia State University, [email protected]
Follow this and additional works at:
https://scholarworks.gsu.edu/chemistry_theses
This Thesis is brought to you for free and open access by the Department of Chemistry at ScholarWorks @ Georgia State University. It has been accepted for inclusion in Chemistry Theses by an authorized administrator of ScholarWorks @ Georgia State University. For more information, please [email protected].
Recommended Citation
Auguste, Rose, "Optimizing the Production Parameters of Engineered Protein-Based MRI Contrast Agents." Thesis, Georgia State University, 2014.
OPTIMIZING THE PRODUCTION PARAMETERS OF ENGINEERED PROTEIN-BASED MRI CONTRAST AGENTS
By
ROSE AUGUSTE
Under the Direction of Dr. Jenny J. Yang
ABSTRACT
Magnetic Resonance Imaging is a noninvasive, complex imaging modality that uses contrast
agents to enhance sensitivity and resolution for a clear image enhancement. To optimize the relaxation
and targeting properties, our lab has created several protein-based contrast agents, ProCAs. To enable
various biophysical characterizations and preclinical studies, we need to optimize expression and
purification of the engineered ProCAs. ProCA1 variants are cultured in various cell strains during a
tag-less method. ProCA32 with multiple binding sites is also successfully purified. It has a strong
metal-binding capability with a relaxivity (r2: 27 ± 0.54; r1: 20.6 ± 0.20 mM-1s-1) that is significantly greater than
the clinically used contrast agent,diethylene triamine pentaacidic acid, DTPA (r1: 3.8 mM-1s-1). Our
findings in optimizing expression and purification conditions, structural conformation, metal binding,
and relaxivity measurements of these ProCAs will facilitate in vitro and in vivo studies needed to move
forward into the pre-clinical then clinical phase.
OPTIMIZING THE PRODUCTION PARAMETERS OF ENGINEERED PROTEIN-BASED MRI CONTRAST AGENTS
by
ROSE AUGUSTE
A Thesis Submitted in Partial Fulfillment of the Requirements for the Degree of
Master Thesis
in the College of Arts and Sciences
Georgia State University
Copyright by
OPTIMIZING THE PRODUCTION PARAMETERS OF ENGINEERED PROTEIN-BASED MRI CONTRAST AGENTS
by
Rose Auguste
Committee Chair: Jenny J. Yang
Committee: Donald Hamelberg
Siming Wang
Robert Wohlhueter
Jun Yin
Electronic Version Approved:
Office of Graduate Studies
College of Arts and Sciences
Georgia State University
DEDICATION
I dedicate this work to my family and friends for their unwavering support and motivation that
helped me maintain a positive attitude throughout my years of research. A very special thanks goes to
my parents: Joël and Andrèle Auguste, for their constant encouragement, helping me during my
rehearsal practice and preparing mentally beforehand for my thesis defense. I am very grateful to my
younger sisters, Adèle and Arielle, for providing the laughter, the ice breaking moments of relaxation so
badly needed at time of intense work throughout my journey in the graduate program. I want to
acknowledge as well my extended family members, my godparents, Frantz and Gaëtane Auguste, and
my aunts, tatie Shirley, tatie Gege, tatie Marjorie, tatie Mirna, my long list of cousins, for the mental
support and constant encouragement to move forward with what I am doing. I would like to finish this
dedication by giving an immense thank to the matriarchs of my family, my grandmothers, Rose Claire
Auguste who passed away long before I was born, whose name I bear and who inspired me through her
past life, and Leanne Zamor, who I love greatly and is currently living in Port-au-Prince. These two
women’s stories have been a constant inspiration for continuing my career and life goal to do greater
good in life; both women have been unassuming in their own way assisting others and have stayed
humble in the process. My continuous appreciation again goes to my parents, for being the rock and
anchor of my life, for motivating me during the times when I feel low and to embrace me no matter the
situation. I carry on this immense gratitude to all of these people in my family and my friends, Liza Ngo,
and Faith Emmanuel, who stood by me throughout this journey that I’ve embarked upon since summer
ACKNOWLEDGEMENTS
Great gratitude goes to Dr. Jenny J. Yang for fostering the opportunity to experience research
applications linked to the field of biochemistry and biophysics. In addition, I appreciate the efforts my
advisor, Dr. Yang, has taken time in pushing me to perform to the best of my ability and in overcoming
my limitations in terms of oral presentation and writing skills. I am sincerely honored and grateful to
have been a part of this interesting MRI contrast agent project. I would like to acknowledge the
committee members of my research project: Dr. Hamelberg, Dr. Wang, Dr. Wohlhueter, and Dr. Yin, for
the helpful editing suggestions and the additional writing insight for my thesis paper. In addition, I
greatly appreciate my committee members for their patience waiting for my thesis draft and taking time
out of their busy schedule to attend the oral presentation of my thesis defense. I thank my mentors,
Natalie White, Fan Pu, and Dr. Jingjuan Qiao for their guidance, knowledgeable advice, experience and
expertise provided in this study. I give great thanks to every group member in the lab that have
volunteered their personal time to explain or clarify certain lab procedures, namely the handling of
SDS-PAGE (Dr. Yanyi Chen and Juan Zou, FPLC (Dr. You Zhou, Shenghui Xue, Dr. Chen Zhang, and Dr. Jingjuan
Qiao), UV-Vis spectrophotometry, and Fluorescence spectroscopy (Dr. Shenghui Xue, Fan Pu, and Dr.
Yanyi Chen). I give a gracious thank you to all of Dr. Yang’s current and past research group members for
the support and help: Dr. Yusheng Jiang, Jie Feng,Xueyun Liu, Dr. Jie Jiang, and Florence Reddish. A kind
thank you goes to the following new lab members: Li Zhang, Anvi Patel, Fantashia Goolsby, Mani
Salarian, Chaky, Corrie Purser, Rakshya Gorkhali, Shanshan Tan, and Cassie Miller, who joined during the
two years I have been pursuing my Master’s Thesis. A special thanks goes to Cassie, Anvi, and Corrie, for
TABLE OF CONTENTS
ACKNOWLEDGEMENTS ... v
LIST OF TABLES ... xi
LIST OF FIGURES ... xii
LIST OF ABBREVIATIONS ... xvii
1. INTRODUCTION ...1
1.1 Medical Imaging in Cancer Research ...1
1.1.1 Imaging modalities applied in medical research ...1
1.2 Principles and Applications in MRI ...4
1.2.1 A brief history on the development of MRI ...4
1.2.2 Relaxivity Theory ...4
1.2.3 Characteristics of current contrast agents used for MRI ...6
1.2.4 The toxicity level and nephrogenic systemic fibrosis relationship with GBCAs ...6
1.3 Development of the Novel Protein-Based Contrast Agents (ProCAs) for MRI... 11
1.3.1 Criteria to consider prior to applying the design approach for protein-based Contrast agents ... 11
1.3.2 Model for the contrast agent: Background on the scaffold protein ... 11
1.3.3 Design approach for the novel ProCA1 variants ... 12
1.3.4 The Grafting approach for promotion of the ProCA1 targeting capability ... 13
1.4 Amount of Protein Needed After Optimizing Protein Expression and Purification ... 19
1.5.1 Production of these novel protein-based MRI Contrast Agents... 21
1.6 Overview of this Thesis ... 23
2. EXPRESSION AND REFOLDING PURIFICATION OF TAG-LESS PROCA1 VARIANTS IN VARIOUS E. COLI CELL STRAINS... 27
2.1 Introduction ... 27
2.2 Methods ... 32
2.2.1 Cloning ... 32
2.2.2 Transformation ... 32
2.2.3 Small and large-scale expression ... 33
2.2.4 Tag-less refolding method ... 33
2.2.5 FPLC- anion exchange Q – column ... 34
2.2.6 Quantitative analysis of the 15 % SDS-PAGE through Image J software... 34
2.2.7 Ultraviolet-visible absorbance spectra and agarose gel electrophoresis applications 35 2.3 Results and Discussion ... 40
2.3.1 Host cell strain influence on the expression of tag-less charged ProCA1 variants ... 40
2.3.2 The denatured-refolding purification of tag-less charged ProCA1 variants ... 43
2.3.3 The refolded tag-less ProCA1 charged variants isolated by the FPLC Q-column anion exchanger ... 44
2.4 Conclusion and Future Work ... 50
3. OPTIMIZATION OF EXPRESSED AND PURIFIED GST-TAGGED PROCA1 VARIANTS ... 52
3.2 Methods ... 59
3.2.1 Transformation ... 59
3.2.2 Small-scale and large-scale expression of GST-tag ProCA1 variants... 59
3.2.3 GST-tag gravity column purification ... 59
3.2.4 Refolding of GST-tagged ProCA1 variants ... 60
3.2.5 FPLC - cation exchange SP - column and ultrafiltration application ... 61
3.2.6 Quantifying the SDS-PAGE results of the GST-tag purification ... 61
3.2.7 Western-Blot and SDS-PAGE ... 62
3.3 Results and Discussion ... 67
3.3.1 Expression of GST-tagged CD2.WT, ProCA1, and ProCA1 variants ... 67
3.3.2 Purification of GST-tag CD2.WT, ProCA1, and ProCA1 variants... 80
3.4 Conclusion and Future Work ... 99
3.4.1 Summary of the small and large-scale expression for all ProCA1 variants ... 99
3.4.2 The summarized GST-tag purification of charged and/or targeted, ProCA1 variants 102 4. CONFORMATIONAL ANALYSIS, METAL BINDING, AND RELAXIVITY PROPERTIES OF THE ENGINEERED PROCA1S ... 106
4.1 Introduction ... 106
4.2 Methods ... 108
4.2.1 Intrinsic tryptophan fluorescence emission spectra ... 108
4.2.2 Far Ultraviolet Circular Dichroism ... 108
4.2.4 FLuo-5N competition assay through fluorescence spectroscopy ... 113
4.2.5 Relaxivity measurement ... 114
4.3 Results and Discussion ... 117
4.3.1 The conformational analysis of CD2 mutants using Far UV-CD ... 117
4.3.2 Intrinsic tryptophan emission of 7E15Q and ProCA1.affi342 targeted to HER2/neu 121 4.3.3 NTA-Tb3+ buffer system fluorescence titration ... 123
4.3.4 Fluo-5N competition assay ... 127
4.3.5 The summary of the metal-binding characteristics for all ProCA1 variants ... 127
4.3.6 Relaxivity measurements for ProCA1 variants ... 130
4.4 Conclusion and Future work ... 135
5. PURIFICATION AND CHARACTERIZATION OF PROCA32 FROM A LARGE SCALE FERMENTATION ... 137
5.1 Introduction ... 137
5.2 Methods ... 139
5.2.1 Cloning ... 139
5.2.2 Purification procedure of ProCA32 ... 139
5.3 Results and Discussion ... 140
5.3.1 The purification of ProCA32 from expression through fermentation ... 140
5.3.2 The study on the metal-binding capability of ProCA32 ... 149
5.4 Conclusion and Future work ... 157
LIST OF TABLES
Table 1.1 Comparing the advantages and disadvantages of current imaging techniques [2-5]. ...3
Table 1.2 Summary of the amount of protein needed for each biophysical analysis. ... 20
Table 1.3 The summary of ProCA variants used in this study [20, 29, 34-36]. ... 26
Table 2.1 A summary of the properties for the four E.Coli cell strains [37, 48-51] ... 31
Table 2.2 Comparing the advantages and challenges for the refolding purification method [40-43, 52, 53]. ... 31
Table 3.1 A summary of the UV-Vis absorbance ratio and yield (mg/ 1 L culture) for each eluted or concentrated samples from the GST-tag and refolding method of the charged ProCA1 variants. ... 89
Table 3.2 A summary of the UV-Vis absorbance ratio and yield (mg/L) for each eluted or concentrated samples from the GST-tag and refolding method of the targeted ProCA1 variants. ... 98
Table 3.3 The summary of the small-scale and large-scale expression of GST-tag ProCA1 variants. ... 101
Table 4.1 A summary of the percent secondary structure construct of CD2.WT, 7E15Q and ProCA1.affi1907 targeted to EGFR based on the far UV CD spectra. ... 120
Table 4.2 A summary of the dissociation constants of Tb3+ and Gd3+ toward the ProCA1 variants [22, 34]. ... 129
LIST OF FIGURES
Figure 1.1 A timeline history leading to the establishment of clinical MRI applications [6]...8
Figure 1.2 Variations of the clinically used gadolinium-based contrast agents (GBCAs) for MRI
application system [15]. ...9
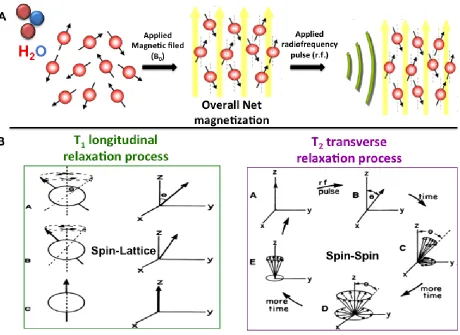
Figure 1.3 The relaxivity process of excited proton nuclei during MRI scans. ... 10
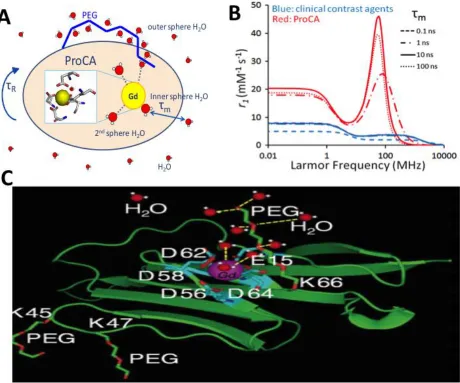
Figure 1.4 Schematic representation of the factors that affect a contrast agent’s relaxation properties.
... 15
Figure 1.5 The alignment of the ribbon surface between human and rat derived CD2.D1. ... 16
Figure 1.6 The binding pocket for the single site mutation of ProCA1 variants. ... 17
Figure 1.7 The different factors involved when using affibody as a multimodal probe for MRI scan. . 18
Figure 1.8 A scheme of the overall goal in this thesis study... 22
Figure 2.1 The general factors to consider for the expression and purification systems[46, 47]. ... 30
Figure 2.2 The transformation scheme along side the pET-20b vector containing the T7 promoter site.
... 36
Figure 2.3 The expression scheme represents the stepwise method used for the tag-less ProCA1s’
overexpression in the four different E.coli competent cell strains. ... 37
Figure 2.4 The denaturing and refolding steps are described in a detailed step-by-step method for the
tag-less purification of each ProCA1s . ... 38
Figure 2.5 The FPLC-Q column preparation scheme and programmed salt gradient. ... 39
Figure 2.6 The growth curve for the small-scale expression of ProCA1 in a) BL21 (DE3), Tuner, and BL21
(DE3) pLysS (in 10 mL LB medium volume) b) with the corresponding 15% SDS-PAGE, and c) In
Figure 2.7 The large-scale expression of ProCA1 variants and the corresponding growth curve for each
cell strain. ... 42
Figure 2.8 The 15 % SDS-PAGE for all ProCA1 variants are demonstrated for the tag-less refolding method... 45
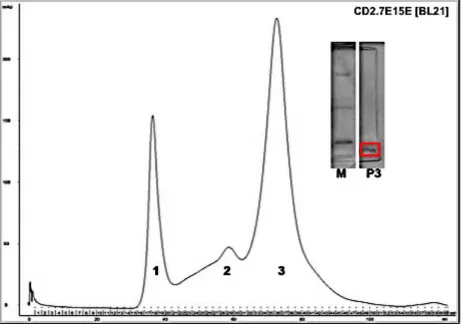
Figure 2.9 The 7E15E variant is isolated through a FPLC system using an anion exchanger column (Q-column). ... 46
Figure 2.10 Ion exchange FPLC Chromatograms of dialysis and sonication samples for the following proteins: a) 7E15E flask 1 ... 47
Figure 2.11 The overall yield for each variant is summarized in correspondence to the cell strain condition. ... 48
Figure 2.12 Size-exclusion chromatography used for isolation of impurities from the concentrated samples post refolding purification method. ... 49
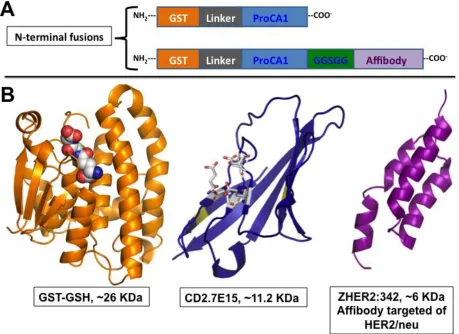
Figure 3.1 The schematic representation of the GST-tag ProCA1 and ProCA1.affi342. ... 56
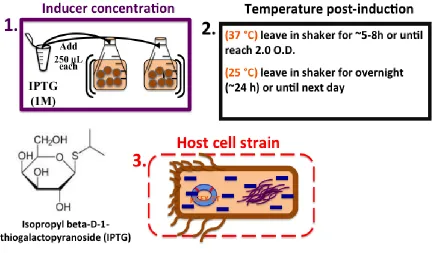
Figure 3.2 The specific parameters for optimizing the expression yield of GST-tagged ProCA1 variants. ... 57
Figure 3.3 The outlined steps for optimizing the parameters in the purification system of the GST-tagged ProCA1 variants. ... 58
Figure 3.4 The commercially available pGEX-2T plasmid vector [55] has a GST promoter site before the Eco RI site. ... 64
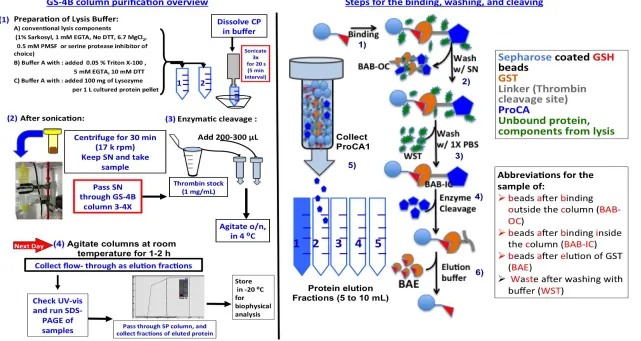
Figure 3.5 The scheme for GS-4B column purification of GST-tagged ProCA1 variants. ... 65
Figure 3.6 The refolding procedure of the inclusion body (IB) of GST-tagged ProCA1 variants. ... 66
Figure 3.7 The small-scale expression of GST-tagged CD2.7E15E, CD2.7E15N, and ProCA1. ... 71
Figure 3.9 The large-scale expression of GST-tagged ProCA1 and CD2.7E15E at varying cell strains, IPTG
concentration, and/or induction temperature. ... 73
Figure 3.10 The large-scale expression of GST-tag CD2.7E15N and CD2.7E15Q at varying IPTG
concentration and induction temperature. ... 74
Figure 3.11 The small-scale expression of GST-tag ProCA1.ZHER: 342 and ProCA1.ZEGFR:1907 ... 77
Figure 3.12 The large-scale expression of GST-tagged ProCA1.ZHER2:342 at varying cell strains, IPTG
concentration, and induction temperature. ... 78
Figure 3.13 The large-scale expression of GST-tag ProCA1.ZEGFR: 1907 at varying cell strains, IPTG
concentration, and induction temperature. ... 79
Figure 3.14 The GST-tag purification of ProCA1, CD2.7E15E, CD2.7E15N, and CD2.7E15Q with
modifications in the cell lysis buffer. ... 85
Figure 3.15 A summary of the intensity ratio for each sample from the GST-tag purification of ib)
ProCA1, ia) 7E15E, ii) 7E15N, and iii) 7E15Q with the indicated lysis buffer conditions. ... 86
Figure 3.16 The GST-tag refolding purification of CD2.7E15E, CD2.7E15N, and CD2.7E15Q ... 87
Figure 3.17 An example of the FPLC chromatograph for CD2.7E15Q (pH: 3.80) through the pH gradient
in the SP column ... 88
Figure 3.18 The GST-tag purification of ProCA1.affi342 and ProCA1.affi1907 with modifications in the
cell lysis buffer. ... 93
Figure 3.19 A summary of the intensity ratio for each sample from the GST-fused purification of
ProCA1.affi342 and ProCA1.affi1907 with modifications in the cell lysis buffer. ... 94
Figure 3.20 The GST-tag refolding purification of ProCA1.affi342 and ProCA1.affi1907. ... 95
Figure 3.21 A summary of the intensity ratio for each sample from the GST-tag refolding purification of
Figure 3.22 The FPLC chromatograph of ProCA1.affi1907 through the Q column based on a
salt-gradient. ... 97
Figure 3.23 The summary of the GS-4B purification of each ProCA1 variants; charged and targeted. 105
Figure 4.1 The schematic representation of NTA-Tb3+ buffer system. ... 115
Figure 4.2 The schematic representation of FLuo-5N competition assay... 116
Figure 4.3 Comparing the secondary structure of CD2.WT versus ProCA1 variants versus
ProCA1.affi1907 through Far UV-CD. ... 119
Figure 4.4 The effect of the metal ions on the secondary structure of a) 7E15Q and b) ProCA1.affi1907.
... 120
Figure 4.5 shows the intrinsic tryptophan emission spectra of ProCA1 and ProCA1.affi342 compared
with the free Trp in 10 mM HEPES, pH 7.0. ... 122
Figure 4.6 The determination of the free terbium concentration (μM) range between NTA-Tb3+ and
ProCA1-Tb3+ buffer system ... 125
Figure 4.7 Fluorescence emission for 7E15E, ProCA1.affi.EGFR, 7E15N, and 7E15Q in NTA-Tb3+ buffer
system. ... 126
Figure 4.8 Relaxivity time (T1,2, ms) and rate (r1,2, mM-1s-1) for ProCA1 charged variants ... 132
Figure 4.9 The average relaxivitys, r1,2 (mM-1s-1), of the charged ProCA1 variants with 1:1 ratio
concentration with Gd3+ ... 133
Figure 4.10 The averaged relaxivitys, r1,2 (mM-1s-1), of targeted ProCA1.affibody variants at varying
protein to metal ratio concentrations. ... 134
Figure 5.1 The cartoon of the holo form rat-alpha parvalbumin with the indicated two EF-hand sites.
... 138
Figure 5.2 The purification gel of ProCA32 based on the purification method from Shenghui Xue’s
Figure 5.3 The isolated DNA/nucleotide contamination is successful as indicated by the agarose gel 144
Figure 5.4 The UV-Vis spectra indicate successful isolation of the protein of interest within the
corresponding peak fractions. ... 145
Figure 5.5 The 15% SDS-PAGE of the isolated ProCA32 to the other contaminants. ... 146
Figure 5.6 Comparing the absorbance ratio between each fraction range for ProCA32. ... 147
Figure 5.7 The final yield corresponding to ~ 180 g from the 2 liter aliquot pellet of fermented
ProCA32. ... 148
Figure 5.8 Fluorescence emission for 7E15Q and ProCA1.affi.EGFR in Fluo-5N competition assay ... 150
Figure 5.9 The fluorescence Intensity of NTA-Tb3+ buffer system with ProCA32. ... 151
Figure 5.10 The different relaxivity values for ProCA32 in different expression/purification procedure.
... 154
Figure 5.11 The saturated a) T1,T2 (ms) values and r1,r2 (mM-1s-1) values for the fermented ProCA32
LIST OF ABBREVIATIONS
AI After Induction
BAB-OC Beads After Binding Outside the Column
BAB-IC Beads After Binding Inside the Column
BAE Beads After Elution
BL BL21 (DE3)
BLpLsS BL21 (DE3) pLysS
CD2.D1 Cell Cluster of Differentiation 2, domain 1
CP Cell Pellet
DNA/RNA Deoxyribonucleic acid/ Ribonucleic acid
DTT Dithiothreitol
EGFR Epidermal Growth Factor Receptor
EGTA Ethylene glycol tetraacetic acid
GS-4B Glutathione Sepharose- 4 beads
GST/GSH Glutathione-s-transferase/Glutathione
HER2/neu Human Epidermal Growth Factor Receptor 2
IB Inclusion Body
IPTG Isopropylthio-β-galactoside
LB broth Luria-Bertani broth
NTA Nitrilotriacetic acid
PMSF Phenylmethylsulfonyl fluoride
ProCA Protein-based MRI Contrast Agent
Q- column Quaternary ammonium anion exchanger column
RpLsS Rosetta-gami (DE3) pLysS
SN Supernatant
1. INTRODUCTION
1.1 Medical Imaging in Cancer Research
Cancer is among the leading causes of death worldwide. It follows that preclinical and clinical
applications are essential for characterizing new drug developments that can be used for the purpose of
cancer treatment, early and effective detection, and accurate prognosis prior to therapy. Mutations
cause uncontrolled proliferation of cell growth to other regions inside the body and result in metastasis.
Essentially, these malignant cells are known as tumors that cause varying forms of cancer.
An accurate determination of the patient’s prognosis is essential for a clinician to make the
decision for treatment options. The patient goes through a specified treatment therapy based on the
progression or stage at which the cancer has developed in the body. Essentially, treatment and diagnosis
rely on the accurate prognosis of the particular disease. Accurately identifying the level of the cancer
helps clinicians have a better diagnosis for treatment and essential suppression of further cancer growth
by continuous therapy [1]. There are several stages of a cancer’s progression. It is essential to locate any
tumors that consist of >~ 109 cells in diameter at the early stage of cancer and are treaTable in the
premalignant stage [1]. The later stages essentially indicate that the cancer has spread to other regions
from the primary tumor site and, at this point, treatment is most challenging. Thus, it is critical to
monitor disease progression at an early stage, and molecular imaging allows this procedure in the
process of cancer prognosis and treatment.
1.1.1 Imaging modalities applied in medical research
In the medical field, various instrumentations are applied for imaging. These various modalities
are used for obtaining anatomical and functional information on the biological process within the body.
There are medical techniques used to indicate and monitor the progression of tumor cell growth. The
efficacy for detecting cancerous versus non-cancerous tissue. Some of the most advanced clinical
imaging instruments are positron emission tomography (PET), computed tomography (CT), single
photon emission computed tomography (SPECT), optical imaging, ultrasound, magnetic resonance
spectroscopy, and magnetic resonance imaging (MRI). These modalities are complementary to one
another in the sense that each possesses benefits and limitations to the level of functional and
anatomical information that can be achieved (Table 1.1). They are among some of the techniques
applied for the identification and localization of tumors in order to determine a proper prognosis for
further clinical treatments.
Unlike PET and CT, MRI is a noninvasive medical imaging modality that is not dependent on the
use of ionizing radiation. This application results in a 3 dimensional image of the soft tissue when
exposed to a particular magnetic field strength. Both anatomical and functional information is achieved
with the use of MRI. Each imaging modality holds a different level of sensitivity for detection of tumor
cells. For instance, PET and SPECT have high sensitivity and depth penetration but use irradiation
exposure during image scanning with isotopic labeled agents. Similar to MRI, ultrasound, optical imaging
and MRS are also non-ionizing imaging tools. While ultrasound bio-microscopy is widely used for in vivo
applications, it has limitations for body depth and resolution [2] . MRI provides soft tissue enhancement,
and the important idea is to differentiate the non-cancerous tissue from the cancerous ones in an
effective manner. In this case, the sensitivity is low, so a contrast agent is used to increase the
1.2 Principles and Applications in MRI
1.2.1 A brief history on the development of MRI
Magnetic resonance imaging (MRI) was formally known as “nuclear magnetic resonance (NMR)
imaging”. The name was changed to make it less intimating. Jean Baptist Joseph Fourier is among the
key pioneers of contemporary NMR and MRI techniques [6]. MRI operates on the same basic principles
as NMR, the only difference is that a spectrum is obtained for NMR, while MRI outputs a set of 3
dimensional, spatially resolved images [7]. In 1975, Richard Ernst was able to apply Fourier’s famous
mathematical formula and obtain image construction from the MRI [6]. MRI has evolved dramatically
since the initial design in 1980. Scientists Tesla, Lamor, and Rabi paved the way for the use of NMR
imaging, now commonly known as MRI. The clinical MRI field is progressing with new ideas for
pre-clinical and pre-clinical applications [8-10].
1.2.2 Relaxivity Theory
MRI signals are obtained from the water protons, provided by the body,when exposed to a
primary magnetic field (B0) and radiofrequency (rf) pulse. Specifically, the human body constitutes of
~70 % water, or ~90 M of hydrogen atoms provided by these water molecules [11]. MRI depends on the
relaxation of the single proton nuclei for an image signal output. These hydrogen atoms have nuclei with
multiple spin states, which hold a magnetization. During an MRI scan, these nuclei present in the various
tissues inside the body, and will align with the available magnetic field, causing an overall net
magnetization. During this process, the nuclei’s vector is at either spin-up or spin-down direction in
alignment with the magnetic field (B0). The applied radio-frequency pulse then generates a rotational
torque (τr) on the nuclei’s vector. This process then causes precession of the nuclei spin, that is a spiral
motion along the applied rf angle, between the spin up and spin down directions. This process is
frequency (ω) and is represented mathematically in Equation 1-1. This initial information gives a clear
understanding on how the MR signal is achieved as an image. The low sensitivity of the MRI results in a
low enhancement between the different tissue contrasts. Thus, a contrast agent (CA) is used to
overcome this image enhancement limitation. The process by which a contrast agent is administered
and relaxes the water’s proton molecules is relaxation rate. The contrast agent in complex form with a
metal ion in solution demonstrates rotational correlation time (τr), longitudinal (r1), and transverse (r2)
relaxation rate characteristics. T1 and T2 relaxation time values each correspond to the reciprocal of the
longitudinal and transverse relaxation rates. Due to the added CA, a better image contrast is observed
for the soft tissues. Each tissue has different levels of water and so they will observe different relaxation
rate and contrast enhancement.
Equation 1-1
Relaxivity is observed when relaxation rate difference is measured as a function of time.
Specifically, this process is the difference in relaxivity demonstrated after the exposure of the CA.
Relaxation time is an important parameter that occurs in two parts: 1) the nuclei spins de-phasing along
the x-y plane is called the spin-spin, or T2 transverse relaxation, 2) the nuclei spin aligning back with the
initial applied magnetic field (B0) along the z-y plane is known as T1 longitudinal relaxation. The main
factors that effect relaxivity are as demonstrated in Figure 1.4 a as a scheme. These factors are as
follow: 1) the water proton exchange dynamic, 2) the contrast agent rotational tumbling rate, 3) the
inner- and outer- sphere water molecules in the surrounding environment, 4) the metal ion and water
oxygen ionic bond distance, 5) the construct and chemical characteristic of the chelating agent. These
factors are all considered and correlate to the criteria for the design approach for our lab’s novel protein
1.2.3 Characteristics of current contrast agents used for MRI
MRI has a high dependence on contrast agents (CAs) for obtaining clear images. The clinically
approved CA, Gd3+-DTPA (diethylene triamine pentaacetic acid), has a bound lanthanide ion that leads to
increased enhancement of the MRI. The developed contrast agents are specifically designed for Gd3+
binding to form a Gd3+-complex. There is a variety of metal-based CAs used for MRI that has either a
paramagnetic or ferromagnetic property. The paramagnetic-based CAs demonstrates favorable T1
-weighted imaging, which means that the image enhancement of soft tissue organs (light) compared to
muscle and bone (dark) are brighter after obtaining the MRI scan. Thus, tumor cell localization during
pre-clinical imaging is facilitated based on the light to dark intensity. Iron oxide and nanoparticle (NP)
based agents are examples of ferromagnetic-based CAs developed for use in vivo [12]. T2-weighted iron
NPs demonstrate the opposite enhancement effect on an MRI scan that is less desired for medical
imaging, and the iron nanoparticle agents pose a challenge for maintaining stability during synthesis
[13].
The lanthanide compounds, specifically gadolinium (Gd3+), are important for obtaining a
reasonably high relaxation rate. The focus of this study addresses gadolinium-based contrast agents.
Rotational correlation time (τrot) and relaxation rates are two important components that contribute to a
clear MRI. In addition, these parameters are directly proportional. Free Gd3+ are highly toxic to the body.
1.2.4 The toxicity level and nephrogenic systemic fibrosis relationship with GBCAs
Nephrogenic systemic fibrosis (NSF) is a disease caused by the exposure of high levels of free
metal ion in the body. Specifically, a study has followed up on the claim that this disease is mainly
present in patients who suffer from chronic kidney disease or kidney failure. These specific patients are
more prone to develop the symptoms associated with this disease. A symptom involves the
discoloration of skin and organs in the body such as heart, lungs, and the central nervous system. Some
a dosage of small GBCA. The link between NSF development and GBCAs dosage brought an emphasis on
safety by the FDA. The patients who suffer from kidney failure are administered other type of CAs or a
lower dosage then the clinically used dosage for obtaining an MRI scan. Other precaution in which the
FDA has developed is in regulating the pharmacokinetics and bio-distribution of the Gd-based contrast
agents. Once administered in vivo. This same study also indicates that from a large group of test
subjects, the results were inconclusive in terms of supporting the initial claim that renal impaired
patients are prone to develop NSF due to the administration of GBCAs. Thus, the correlation between
the dosage amount of GBCAs and patients with kidney failure are on a going surveillance since the initial
outbreak cases in 2001.
Specifically, GBCAs are composed of a small organic compound bound to gadolinium ion. The CA
provides a clear difference in the image contrast due to an increase relaxation rate. Gd3+ ions interact
with the water molecules present in the surrounding soft tissue, and this interaction gives off a
relaxation rate in the form of image enhancement. However, Gd3+-DTPA and other small chelator based
MRI contrast agents shown in Fig 1.2 have a relatively low relaxation time (r1: 3.8 mM-1s-1) due to their
small molecular size. The molecular imaging contrast agent database (MICAD) lists twelve different
derivative based agents used for MRI [14]. Thus, our lab has designed a protein based contrast agent,
Figure 1.3 The relaxivity process of excited proton nuclei during MRI scans.
The two proton nuclei relaxation processes are b) T1 longitudinal relaxation time and T2 transverse
relaxation time occur after a) an applied radiofrequency in presence of a magnetic field [7, 16][17]. b) The vector of the proton nuclei de-phase out of the lattice or surrounding along the x-y plane as a function of time. This process is T2 spin-spin relaxation (purple). The proton nuclei rotate along the z -
y plane in the lattice then gradually re-align with the applied magnetic field (B0) along the z - axis
1.3 Development of the Novel Protein-Based Contrast Agents (ProCAs) for MRI
The limitation of the MRI technique is the use of a CA as previously mentioned. Specifically, the
CAs provided has to fulfill certain requirements such as: low toxicity, high permeability, strong targeting
capability, low dosage, and high relaxivity for efficient analysis of the image enhancement. In
considering these characteristics, our lab has developed novel designed protein based contrast agents
for MRI applications. Furthermore, these novel ProCAs are divided into various generations but only
generation one and three are discussed in this study. ProCA1 and ProCA3 are generated from different
protein scaffold. Each of the scaffold proteins have unique characteristic in terms of sustaining
conformational stability prior to multiple site mutagenesis.
1.3.1 Criteria to consider prior to applying the design approach for protein-based Contrast
agents
Relaxation process is dependent on many factors. The involvement of each of these factors is
illustrated in Figure 1.4 and they are noted as essential criteria. The criteria to optimizing the image
enhancement properties of the novel designed contrast agent involve the following: 1) high relaxation
rate, 2) strong metal binding to reduce toxicity associated with nephrogenic systemic fibrosis (NSF), 3)
low immunogenicity, 4) enhanced detection of tumor cells and tissues, 7) good pharmacokinetics in vivo.
Water number value is an important parameter when studying relaxation measurement.
1.3.2 Model for the contrast agent: Background on the scaffold protein
CD2.D1 originates from the T- cell receptor in the immunoglobulin response system [18]. This
protein maintains conformational stability at varying pH and salt concentrations, which indicates a high
tolerance to mutation. Previous studies on the use of rat CD2.D1 as a model for designing calcium
binding protein confirm this conformational stability towards mutations [19]. It has two tryptophan
at position 7 (Figure 1.4 b). This protein consists of a β-sheet topology with an immunoglobulin
superfamily (IgSF) domain [18]. It poses no complications in terms of folding due to no cysteine residues
present in the loops.
1.3.3 Design approach for the novel ProCA1 variants
ProCA1 derives from a metal binding pocket inserted on the surface of the first domain of the
rat cell cluster of differentiation 2 (rCD2.D1). Figure 1.5 b summarizes the following four engineered
protein binding sites: CD2.7E15, CD2.7E15E, CD2.7E15N, and CD2.7E15Q. The following terms referring
back to the mutations will be used throughout this thesis: 7E15, 7E15E, 7E15N, and 7E15Q. These
mutations are designed by a former research colleague, Dr. Anna W. Mannicia, with the intention of
analyzing the effect of charge numbers and ligand types at the metal binding pocket on protein folding,
stability and metal binding affinity [20]. 7E15 has mutations at positions 15, 58, and 64. The designed
ProCAs are T1-weighted MRI agents due to the high positive contrast enhancement during T1
longitudinal proton relaxivity measurement. Thus, the engineered binding pocket has a pentagonal
bi-pyramidal coordination confirmation with Gd3+ (Figure 1.5 a). In addition, the net charge of the binding
site is indicated for CD2.7E15 (-5), CD2.7E15E (-5), CD2.7E15N (-4), and CD2.7E15Q (-4) (Figure 1.5 b).
The binding affinity of a metal- protein complex determines the strength of the residue side chains
interaction with the ion [21]. The original aspartic acid residue is mutated to glutamic acid, named
7E15E, following aspartate (7E15N) and glutamate (7E15Q). 7E15 and 7E15E hold a - 5 charge while
7E15N and 7E15Q have a - 4 charge. The different charge of the binding pocket is essential for
comparing the binding affinity to the metal ions during fluorescence titration and relaxation rate
measurement. The binding pocket coordination geometry is described as a pentagonal bipyramidal for
the Gd3+ ion complex with the five-ligand side chains. It is assumed that this coordination is sTable but
theoretically decreases in affinity depending on the metal ion atomic radii present. For instance,
while zinc (1.2 Å) has a lower atomic covalent radius but higher electronegativity. The other
physiological metals such as Ca2+, Mg2+, and K2+ have similar atomic radii as well in comparison to Gd3+.
These ionic radii comparisons help in obtaining an understanding on the binding affinity or dissociation
constant (Kd) value obtained for each protein variants during fluorescence titration. These metal binding
studies are discussed in detail in the results and discussion of Chapter 4.
We must optimize expression and purification methods to increase production yield and further
continue the study with a detailed biophysical analysis (e.g. metal binding affinity, relaxivity
measurement) on the purified ProCA samples. ProCAs are expressed and purified for further
conformational analysis. The expression behavior of the mutants is analyzed in this study when
expressed in varying E. Coli cell strains. The sole purpose is to obtain an optimized condition for
expression and purification of ProCAs as efficiently as possible, so they can be used for further analysis
in detecting cancer cell markers such as HER2 when injected into mice for pre-clinical trials [22] .
Abada et al. demonstrated that a macro cyclic gadolinium-based contrast agent with phosphate
ligands has a two-fold higher relaxivity (r1: 8.5 mM-1s-1) compared to the CA with carboxylate ligands (r1:
4.2 mM-1s-1) [23]. Such results give rise to questions involving whether change in ligand may have an
effect on the relaxation rate properties of the contrast agents. For our initial design approach of the
binding pocket, the ligands are the side chains of three aspartic acids and two glutamic acids, which
make a - 5 charge on the beta sheet surface (i.e. B, D, E) of what is known as CD2.7E15 or ProCA1
(Figure 1.4 b). It is also very interesting to see the effect of electrostatic interactions or different ligand
residues on these properties of designed protein contrast agents. Table 1.2 lists each created variant
that is related to this study and their corresponding design rationale.
1.3.4 The Grafting approach for promotion of the ProCA1 targeting capability
Human epidermal growth factor receptor (EGFR) and type 2 (HER2/neu, ErbB2) are defined as
cancer [24-26]. Our lab has established a targeted contrast agent by engineering an affibody protein
domain (~7.5 KDa, 3 helices) for targeting the tumor receptors (Figure 1.7 d) [22]. Affibody is utilized as a
probe for image diagnostic and therapy, and mimics antibody-targeting capability, but they are derived
from a phage display library from the Z domain of staphylococcal protein A (SPA) [27]. Two varying
mutants are analyzed in this study. HER2 targeted contrast agent called ProCA1.affiZHER342 and EGFR
targeted contrast agents called ProCA1.affiZEGFR1907 (Table 1.2). A lab colleague, Dr. Jingjuan Qiao
grafted these affibody-targeting peptides to the c-terminal of ProCA1. A five-residue linker joins the two
moieties. The GGSGG linker is chosen because it allows sufficient movement and prevention of steric
hindrance between the two moieties. These developed targeted protein contrast agents have improved
the sensitivity and specificity compared to the conventional FDA-approved/clinically-applied CAs such as
Gd-DTPA. The various in vivo studies demonstrate the successful increase in relaxivity and image
enhancement, as well as endothelial penetration and even bio distribution of the ProCAs [16, 22, 28-29].
In contrast, other derived targeted bio-based contrast agents such as antibody, micelles, nanoparticles,
iron oxide, do not demonstrate such even bio distribution capability due to their size. In Chapter 4 of
this thesis, I will report our effort to improve expression and purification of these variants and
Figure 1.5 The alignment of the ribbon surface between human and rat derived CD2.D1.
Figure 1.6 The binding pocket for the single site mutation of ProCA1 variants.
1.4 Amount of Protein Needed After Optimizing Protein Expression and Purification
The novel engineered protein-based contrast agents (ProCAs) are established for MRI usage. The
production of these ProCAs is in need for a progressive analysis of these proteins in vivo. It typically
takes 10 to 14 years for a newly developed drug to pass through clearance for use at the clinical phase
[3]. The basic steps to taking a drug into the clinical phase involve rigorous preliminary studies. These
studies refer to the large scale-up production of these engineered ProCAs. The expression and
purification conditions are the main focus for the production parameters. These methods are crucial for
establishing an optimal protocol that can transition into the industry for the production of the novel
ProCAs. Clinical imaging is the long-term goal and it entails using ~ 0.10 mmol/kg subject weight of 0.5
M solution dosage for human MRI imaging depending on the contrast agent and the subject’s weight.
Prior to transitioning into the pre-clinical then clinical phase, the ProCAs are expressed then purified
based on the selected methods mentioned in Chapter 2 and Chapter 3. Table 1.2 summarizes the typical
protein amount needed for each biophysical application. The main instruments that are applied in this
thesis are fluorescence emission spectroscopy, circular dichroism, and relaxometer. The total protein
weight is indicated at the milligram amount for the specific biophysical techniques used for the analysis
of the function and structure conformation of the purified ProCAs. This indicates that a microgram to
milligram amount of these ProCA1 variants are crucial for continuous structural and functional
Table 1.2 Summary of the amount of protein needed for each biophysical analysis.
1.5 Overall Purpose of this Study
1.5.1 Production of these novel protein-based MRI Contrast Agents
The expression and purification conditions are altered and the results are analyzed. The result
that is best suiTable for progress at the large industrial scale can be devised based upon the trouble
shooting of parameters during expression and purification. The optimized conditions for purification are
analyzed for best bioactivity, protein stability, low toxicity and low contaminants. Basically, each
conditions changed during purification are screened for better results. Specifically, the best results that
are suiTable for this study involve achieving low contaminants, high yield, and sTable functional ProCAs
at a low cost and less time consuming manner. Comparing the tag-less and glutathione-S transferase
(GST)-tag purification systems are amongst the main direction to which we can determine what
purification system will satisfy for the efficient and high quality production of these novel based
engineered ProCAs. This study only focuses on expression and purification of the rat CD2.D1 scaffold
protein. Eventually, human-derived CD2.D1 variants will be analyzed and the established optimized
conditions can be applied to those variants as future work. A standard optimal expression and
purification method that follows a current good manufacturing practice (cGMP)-like procedure must be
obtained as well. In addition, we must be able to transition into an industrial large-scale method for
application in vivo, specifically large animal experiments (i.e. rats, dogs, monkeys).
1.6 Overview of this Thesis
In this thesis, the production of the previously designed and engineered variants of ProCA1 from
Dr. Anna W. Maniccia and Dr. Jingjuan Qiao’ s dissertation, and ProCA32 variant from Dr. Shenghui Xue’s
dissertation are discussed in detail in Chapters 2-5. Specifically, the objective of Chapters 2 and 3 is to
seek optimal conditions through: change in parameters during expression and purification methods for
obtaining high yield, low toxicity, high purity, sTable bioactivity of protein of interest through an
effective, low cost procedure. This applies as well to all other ProCAs that will be mentioned throughout
this study. In Table 1.3, each charged variant tackled in this study is summarized with its associated
mutation, purpose for the mutation, and related Chapters.
In Chapter 2 of this thesis, expression conditions for tag-less ProCA1 charged variants are
analyzed by change in host cell strain. Competent cell strains used are BL21 (DE3), BL21 (DE3) pLysS,
Tuner, and Rosetta-gami (DE3) pLysS. Henceforth, these cell strains are named BL21, BL21 (DE3) pLysS,
Tuner, and Rosetta-gami pLysS throughout Chapter 2 and 3. The tag-less expression method
demonstrates low molecular weight at ~ 11.2 KDa for each ProCA1 charged variants, which are listed
below in Table 1.2. Chapter 2 describes the effect of recombinant protein production is dependent on
the used host cell strain. Each cell strain has a deletion mutation, which gives them a specified
characteristic during expression system. For instance, ProCA1 charged variants expressed in BL21 (DE3)
pLysS cell strain demonstrate lower production at higher molecular weight compared to BL21 and
Tuner. Tuner is dependent upon the concentration of inducer added during the expression and this
phenomenon is demonstrated from the expression gels and final yield post FPLC-Q column isolation
(Section 2.3 of Chapter 2). Further isolation of the concentrated pure samples is passed through a size
exclusion high-pressure column but the yield is decreased dramatically.
The expression and purification conditions of GST-tag charged ProCA1 charged variants and
expression system are analyzed: a) the temperature post induction, b) the inducer (IPTG) concentration,
and c) the host E.coli cell strain. The following parameters for the GST-tag purification system are
analyzed: a) 100 mg lysozyme/per 1 L culture, b) use larger diameter column, c) use 10 mM DTT and
0.05 % triton X-100, and d) use of a refolding method on inclusion body GST-tag ProCA1 charged
variants and ProCA1.affibody variants. Summarized expression and purification data for GST-tag ProCA1
charged variants through change in conditions/parameters are listed under Section 3.3 of Chapter 3. The
yield from each host cell strain and purification conditions for all variants charged and targeted is
summarized in Section 3.3.
In addition to obtaining an optimal condition for expression and purification, the structural and
functional characteristics are summarized in Chapter 4. The secondary and tertiary structural
conformation stability of the ProCAs is tested through monitoring the secondary structure with circular
dichroism and tertiary hydrophobic folding with tryptophan-fluorescence emission spectroscopy. The
functional characteristics involve determining the metal-binding affinity of the binding pocket to the
lanthanide metals Gd3+ and Tb3+. The metal binding study for Tb3+ is observed through the following two
fluorescence methods: a) a buffer system titration method, and b) a competition assay using FLuo-5N
dye. The summarized Kd for each of the titration methods for ProCA1 variants targeted and charged are
compared in a Table that is available in Section 4.3 of Chapter 4. The competition method is applied for
Gd3+ binding affinity determination with the use of a Fluo-5N Invitrogen commercial dye. Furthermore,
the relaxation properties are measured with change in ProCA1 variants to Gd3+ concentration ratio, and
analysis of relaxation rate change in relation to ProCA1 variants concentration change with the fixed
Gd3+ concentration. The ProCA32 variant has a different scaffold protein and two binding pockets
compared to ProCA1 variants mentioned previously.
The conventional bench work purification system of the fed batch fermentation for ProCA32 is
fed-batch fermented ProCA32 pellets are compared through the typical bench work purification system.
In addition, the ProCA32 pellet from fed-batch fermentation is purified through the use of a specified
PEG concentration. Essentially, all three tactics for purification are compared in terms of overall yield
after FPLC-Q column isolation. The relaxation properties at varying ratio of the ProCA32 to Gd3+
concentration are also compared for each sample obtained from the individual expression/purification
systems. The purified ProCA32 from fed-batch fermentation is analyzed for structural and functional
stability through an NTA-buffer system titration and a competition assay with FLuo5N titration using
Fluorescence spectroscopy. Chapter 6 describes the goals achieved; the challenges, and the major
Table 1.3 The summary of ProCA variants used in this study [20, 29, 34-36].
2. EXPRESSION AND REFOLDING PURIFICATION OF TAG-LESS PROCA1 VARIANTS IN VARIOUS E.
COLI CELL STRAINS
2.1 Introduction
The general factors involved in the production of our recombinant ProCA1 variants are: 1)
plasmid/vectors, 2) competent host cell strain, and 3) cultured media for the expression system, 4)
method for the extraction of protein, 5) collecting the soluble (supernatant)/insoluble (inclusion body)
form for the desired purification system. The correlation between each of these criteria is summarized
through a scheme in Figure 2.1. The chosen vector depends in part on the planned purification
technique, such as pET with 6-Histidine tag (His-tag), or pGEX system (GST-tag), or pMAL for maltose
binding protein tag, all involving a tag purification method for efficient protein yield. My focus in this
Chapter is specifically directed at the tag-less expression and denaturing - refolding purification methods
of the ProCA1 charged variants, while the fusion-tag system is discussed later (Chapter 3) as a
comparison.
The parameter in the expression procedure tested for optimal cultivation results is the change in
the host cell strain for tag-less ProCA1 charged variants. Specifically, 7E15E, 7E15N, and 7E15Q are
expressed and purified, followed by the calculated yield (mg/L). E.coli is a commonly used bacterial host
cell strain, and there are many commercially available competent cells derived from E.coli. The use of
the bacterial cell strains gives a high throughput of the protein of interest (ProCAs) in a short time limit.
The host E.coli cell strain is the production machinery used for expressing the protein of interest. The
complex mechanism taken place inside the E.coli cell depends on several factors that indirectly play a
role during the over-expression of our recombinant protein. Some of these factors involved in the
expression system are: the inducer concentration, temperature set after induction, and the host cell
expression level of tag-less ProCA1 variants.
The four cell strains are as follows: BL21 (DE3), BL21 (DE3) pLysS, Tuner, and Rosetta-gami (DE3)
pLysS are examined in the LB broth medium. Table 2.2 summarizes the specific mutation and
characteristic of each of these listed cell strains. Based on Natalie White’s thesis, Tuner cell strain
promotes high inclusion body yield of the protein of interest, which is compatible for the refolding
purification method [34]. BL21 (DE3) is the host cell that allows for the expression of plasmids containing
a T7 promoter site. The same cell strain with the added pLysS mutation activates the T7 lysozyme, which
allows for low basal expression of the protein prior to induction. This particular host cell also prevents
the high expression of toxic proteins to allow for successful translation of the protein to occur once cells
are induced in the luria-broth media. Rosetta-gami pLysS holds a similar characteristic to BL21 (DE3)
pLysS, but in addition it allows for promotion of rare tRNAs for translation of rare codons (i.e. AGG, AGA,
Arg, AUA Ile, CUA Leu, CCC Pro, GGA Gly) [37]. I utilized this information and tested if there is a
correlation between the expression level of the protein and the yield of the protein after the purification
process. The expression conditions that give a higher ratio of the protein in the inclusion body is most
suiTable for the tag-less refolding purification system.
There are multiple large-scale expression and purification systems that are used for the
production of potential agents to be used in medical applications [38]. For instance, Cox et al. devised a
more effective three step purification method for recA genome of E.coli, which plays a vital role in DNA
replication, annealing and regulation of DNA mutation/repair where the purification system only
involves three steps: 1) lysing the cell in specified buffer, 2) collecting /solubilizing pellets, and 3)
isolation through a series of chromatographic steps (i.e. phosphocellulose and single stranded DNA
cellulose) that involve no gradient buffer elution [39]. The purification approach that I focused on is in
the refolding of the designed ProCA1 variants that are cultured with a pET20b vector. Through a set of
variants that are mainly found in the inclusion body after cell lysis [34].
The focus of this Chapter is on the tag-less expression and refolding purification methods. The
tag-less purification method involves recovering the misfolded ProCA1s through a refolding system. The
pellets are treated with harsh denaturant at a high concentration for optimal unfolding of the ProCA1s.
The protein’s tertiary confirmation is recovered through a step-wise dialysis and dilution process. There
are current studies that focus on similar refolding purification protocols [40-45]. The advantages and
challenges when utilizing the refolding purification system are compared in Table 2.3. One drawback
from applying this purification procedure is possible presence of nucleotide contaminants and
aggregation during the refolding process. Although a high concentration and yield of the protein can be
recovered through the denaturation-refolding system, aggregation still poses a problem when refolding
the protein back to its native tertiary structure. Another challenge facing the denaturing-refolding
purification method is the recovery of the protein‘s native functionality as a chelating agent. Solving the
drawbacks during the recovery of the protein from the inclusion body is crucial for effective production
and reproducible protein yield. So we raise the question: How can we promote the increase in the
production of these ProCA1s variants and move forward with the refolding purification? These
challenges involved in the refolding purification system can be overcome through troubleshooting of
important parameters as demonstrated by current studies. Essentially, our attention is the expression
system level and how it affects the purification system in terms of protein yield (mg/L).
Theoretically, the low expression level of the recombinant protein can give low yield after
purification. We want to determine which cell strain gives the highest ProCA1 charged variants yield
(mg/L), lowest contamination for DNA/nucleotides, and the solubility level of each ProCA1 charged
variants during cell lysis prior to the denatured-refolded purification system. Our effort is directed at
analyzing the expression level of our ProCA1 variants during cultivation and then proceeds through the
overall work in this Chapter consists of the following: a) the small-scale expression of ProCA1 in two
different cell strains, b) the large-scale expression of 7E15E, 7E15N, and 7E15Q in varying E.coli cell
strains, c) the refolding purification method applied to the large scale expressed variants, and d) The
UV-Visible absorbance spectrum and final yield in milligrams from each cell strain expression system.
Table 2.1 A summary of the properties for the four E.Coli cell strains [37, 48-51]
2.2 Methods
2.2.1 Cloning
The charged ProCA1 variants (from Chapter 2 to 4) cloning are described according to the
protocol in Dr. Anna Wilkin’s dissertation [20]. The targeted ProCA1 variants to HER2 peptide (from
Chapter 3 to 4) cloning are described according to the protocol in Dr. Jingjuan Qiao’s dissertation [36].
2.2.2 Transformation
To begin this method, the following E. Coli cell strains: (BL21 (DE3), Rosetta-gami (DE3) (DE3)
pLysS, BL21 (DE3) pLysS, and/or Tuner, were allowed to thaw in an ice bucket. The CD2.7E15 (or ProCA1)
DNA plasmid with a pET-20b (for Chapter 2) or pGEX-2T (for Chapter 3) vector was also thawed in the ice
bucket. The competent cell (50 µL) was then mixed with the DNA plasmid (0.50 µL) in an empty
autoclaved eppendorf tube, and then left on ice for thirty minutes. In following, a water bath at 42 ºC
was controlled. The eppendorf tube containing the mixture was transferred into the water bath for 90
seconds, and then quickly transferred back on ice for two minutes. This crucial heat shock method
possessed an impact on the cell strain’s membrane wall. The cell membrane was vulnerable in this step
and as a result the foreign DNA plasmid that holds the recombinant DNA sequence of the protein of
interest was present in the cytoplasm of the competent host cell. Prepared autoclaved LB Broth Miller
medium (75 µL) was added to the cell/DNA mixture and placed in the Isotemp incubator (Fisher
Scientific) for 30 minutes at 37 ºC. After obtaining the incubated tube, the mixed solution (50 µL) was
placed in the center of the luria-broth agar with ampicillin antibiotic plate and spread with the use of a
sterile triangle. The plate was then placed for incubation at 37 ºC for overnight. The next morning the
plate was observed for any colony growth and placed in the 4 ºC refrigerator with parafilm.
Transformation methods is summarized as a scheme in Figure 2.2 for all expressed 7E15 and charged
2.2.3 Small and large-scale expression
Inoculation was the first step in the expression methods for CD2.7E15 wild type. This step was
quick and the flask (1000mL capacity) was placed in the shaker (Branstead Lab-line, ~200 rpm,
temperature 37 ºC, Max Q 5000), which was used to spread the nutrients and oxygen within the
available space in the flask for overnight (o/n). The second step involved the transfer of the overnight
culture into the two larger one Liter Luria-Bertani media flasks (2800 mL capacity) for the large-scale
system while a 10 mL volume of fresh media is used in sterile plastic falcon tubes (50 mL capacity) for
the small-scale system. The O.D. readings were recorded with the use of a UV-Vis spectrophotometer
(UV-1601, Shimadzu Scientific Instruments Inc., Columbia, MD) at a fixed wavelength (λ = 600 nm). The
bacteria cell pellets were collected on the same day after induction for four hours through the use of a
low speed centrifuge (Sorvall Model RC5Bplus, MFD by Kendro Laboratory products, Newton, CT). The
collected cell pellets are then placed in the - 20 ºC freezer until further application for the purification
process. All charged variant proteins are expressed in large one liter flasks left overnight at 30 ºC in
following the collection of the proteins the next morning. Expression of charged variants in BL21 (DE3)
involved inoculation o/n at 37 ºC in sterile plastic based falcon tubes (50 mL capacity).
2.2.4 Tag-less refolding method
Re-suspending the cell pellet from the expression methods in a prepared lysis buffer was the
initial step to the denaturing-refolding purification methods for 7E15 and it’s charged variants. The
sonication step soon followed and it was repeated five to six times for 30 seconds with a five-minute
interval with cooling on ice. The bacteria cells were treated with a constant vibrational force, which lyses
the cell wall and exposed the protein of interest to an unsTable environment. Thus, it was important to
keep the solution under ice as the sample overheats during the protein extraction process from the host
cell. The solution is then centrifuged at high speed (17 Krpm, Sorvall RC-5B Refrigerated Superspeed
x-100. In following the protein in the pellet are denatured by prepared 8 M urea (OMnipur min 99.5 %,
EMD Chemicals Inc. Gibbstown, NJ) o/n. The next morning the protein is centrifuged and supernatant
(SN) is transferred into dialysis bags. The protein refolding process is executed with treatment of 2 M
Urea then 10 mM Tris buffer placed inside a 2000 mL plastic beaker for overnight. The solutions are
collected and stored in sterile falcon tubes at -20 ºC until the next purification process (Fig 2.3).
2.2.5 FPLC- anion exchange Q – column
Fast Protein Liquid Chromatography (FPLC, General Electric, #INV-907, made in Sweden) is a
chromatographic process in which the protein in solution is exposed to a salt gradient (Q-column)
program (Figure 2.5). The program system was initially washed with ultra pure deionized water (ddH2O).
The 10 mM HEPES (Free acid, molecular biology grade, 99.7% purity, EMD Biosciences, Inc. LaJolla, CA)
buffer (pH ≈ 8.0) and 10 mM HEPES, 1M NaCl (Crystals, GR ACS, EMD Chemicals Inc. Gibbstown, NJ)
buffer (pH ≈ 8.1) are prepared and used as Buffer A and Buffer B, respectively. The column is gradually
washed with the salt buffer so protein is eluted out of the column as the percent salt concentration
increases gradually as demonstrated in the results (Figure 2.9 and 2.10).
2.2.6 Quantitative analysis of the 15 % SDS-PAGE through Image J software
Since the majority of the expression and purification results were mainly qualitative, we utilized
Image J software (1.47v, Rasband, Wayne, NIH, USA) to quantitatively measure the protein’s band
intensity. Essentially, the intensity of the band was measured and this value was used for the analysis of
the small and large-scale expression results. The gel results for the expression (2.3.1 and 3.3.1) and
purification (3.3.2) were quantified through a normalized intensity ratio value. The bands that
demonstrated the low intensity ratio represented a low expression in correspondence to the dark pixels
![Table 1.1 Comparing the advantages and disadvantages of current imaging techniques [2-5]](https://thumb-us.123doks.com/thumbv2/123dok_us/9129434.987518/22.612.73.535.186.634/table-comparing-advantages-disadvantages-current-imaging-techniques.webp)
![Figure 1.1 A timeline history leading to the establishment of clinical MRI applications [6]](https://thumb-us.123doks.com/thumbv2/123dok_us/9129434.987518/27.612.127.490.121.592/figure-timeline-history-leading-establishment-clinical-mri-applications.webp)
![Figure 1.2 Variations of the clinically used gadolinium-based contrast agents (GBCAs) for MRI application system [15]](https://thumb-us.123doks.com/thumbv2/123dok_us/9129434.987518/28.612.77.524.179.572/figure-variations-clinically-gadolinium-contrast-agents-gbcas-application.webp)
![Figure 3.4 The commercially available pGEX-2T plasmid vector [55] has a GST promoter site before the Eco RI site](https://thumb-us.123doks.com/thumbv2/123dok_us/9129434.987518/83.612.83.533.194.501/figure-commercially-available-pgex-plasmid-vector-gst-promoter.webp)