ScholarWorks @ Georgia State University
ScholarWorks @ Georgia State University
Computer Science Dissertations Department of Computer Science
Fall 11-16-2012
Algorithms for Transcriptome Quantification and Reconstruction
Algorithms for Transcriptome Quantification and Reconstruction
from RNA-Seq Data
from RNA-Seq Data
Serghei Mangul
Follow this and additional works at: https://scholarworks.gsu.edu/cs_diss
Recommended Citation Recommended Citation
Mangul, Serghei, "Algorithms for Transcriptome Quantification and Reconstruction from RNA-Seq Data." Dissertation, Georgia State University, 2012.
https://scholarworks.gsu.edu/cs_diss/71
This Dissertation is brought to you for free and open access by the Department of Computer Science at
RECONSTRUCTION FROM RNA-SEQ DATA
by
SERGHEI MANGUL
Under the Direction of Dr. Alexander Zelikovsky
ABSTRACT
Massively parallel whole transcriptome sequencing and its ability to generate full
tran-scriptome data at the single transcript level provides a powerful tool with multiple
inter-related applications, including transcriptome reconstruction, gene/isoform expression
esti-mation, also known as transcriptome quantification. As a result, whole transcriptome
se-quencing has become the technology of choice for performing transcriptome analysis, rapidly
pro-ends of randomly generated cDNA fragments. RNA-Seq protocol reduces the sequencing
cost and significantly increases data throughput, but is computationally challenging to
re-construct full-length transcripts and accurately estimate their abundances across all cell
types.
We focus on two main problems in transcriptome data analysis, namely, transcriptome
reconstruction and quantification. Transcriptome reconstruction, also referred to as novel
isoform discovery, is the problem of reconstructing the transcript sequences from the
sequenc-ing data. Reconstruction can be done de novo or it can be assisted by existsequenc-ing genome and
transcriptome annotations. Transcriptome quantification refers to the problem of estimating
the expression level of each transcript. We present a genome-guided and annotation-guided
transcriptome reconstruction methods as well as methods for transcript and gene expression
level estimation. Empirical results on both synthetic and real RNA-seq datasets show that
the proposed methods improve transcriptome quantification and reconstruction accuracy
compared to previous methods.
RECONSTRUCTION FROM RNA-SEQ DATA
by
SERGHEI MANGUL
A Dissertation Submitted in Partial Fulfillment of the Requirements for the Degree of
Doctor of Philosophy
in the College of Arts and Sciences
Georgia State University
RECONSTRUCTION FROM RNA-SEQ DATA
by
SERGHEI MANGUL
Committee Chair: Dr. Alexander Zelikovsky
Committee: Dr. Yi Pan
Dr. Robert Harrison
Dr. Ion Mandoiu
Electronic Version Approved:
Office of Graduate Studies
College of Arts and Sciences
Georgia State University
DEDICATION
I dedicate this dissertation in loving memory of my father Ilia D. Mangul (August 2,
1950 - August 21, 2010). I know how important it was for you to see me graduate. It was you
who inspired me to get my PhD. As a young boy, I remember attending your PhD defense. I
still have the copy of your thesis that you signed for me. What you wrote there has become
ACKNOWLEDGEMENTS
I would like to thank my advisor Dr. Alex Zelikovsky for his encouragement and constant
support over the past four years of my graduate studies at Georgia State University. This
thesis could not been done without his guidelines, patience and motivation. For helping
to guide this research and provide exceptional feedback and encouragement, I thank my
graduate committee members: Dr. Yi Pan, Dr. Robert Harrison and Dr. Ion Mandoiu.
Special thanks to Dr. Ion Mandoiu for sharing his knowledge and giving helpful advice. I
want to express my gratitude to Life Technologies team in Foster City, CA for discovering
exciting world of biotechnology for me. Life Technologies internship changed my life and
opened for me great opportunities. I want to say special thanks to Dumitru Brinza and
Fiona Hyland and to all my friends from Life Technologies.
Special thanks to Computer Science Department of Georgia State University. I express
my special gratitude to Dr. Raj Sunderraman , Mrs. Tammie Dudley and Mr. Shaochieh
Ou. I am also grateful to Moldova State University, which I graduate with my Bachelor in
Applied Mathematics. Special thanks to Dr. D. Lozovanu and Dr. I. Secrieru.
Thanks to my friends and colleagues Abi, Adrian, Bassam, Blanche, Chad, Cristina,
Dinesh, Gulsah, Hamed, Helen, Irina, James, Kelly, Lakshmi, Matt, Marco, Ming, Nick,
Olga, Rudy, Sahar, Vanessa. Thanks also to my new friends from all over the world for all
what I have learned. Thanks to my friends back home who always supported me.
I am most grateful to my parents Ilya Mangul and Nelly Jardan, whose love was my
most important source of strength and determination. I am also grateful to my grandfather
Vasilie Jardan, grandmother Alexandra Jardan, aunt Rita, and aunt Natasha. I would like
to say very special thanks to my Godfather and an amazing friend Michael Robert Sawyer.
Finally, special recognition goes out to my lovely wife Zoia, for her support,
encourage-ment and patience during my academic journey over the past four years. Her support and
TABLE OF CONTENTS
ACKNOWLEDGEMENTS . . . v
LIST OF TABLES . . . viii
LIST OF FIGURES . . . x
LIST OF ABBREVIATIONS . . . xiv
PART 1 INTRODUCTION . . . 1
1.1 RNA-Seq protocol . . . 2
1.2 Applications of RNA-Seq. . . 3
1.3 Contributions and Future Work . . . 6
1.4 Organization . . . 8
1.5 Software Packages . . . 8
1.6 Related Publications . . . 9
PART 2 TRANSCRIPTOME QUANTIFICATION . . . 15
2.1 Introduction . . . 15
2.1.1 Background . . . 15
2.1.2 Previous Work . . . 16
2.1.3 Our contributions . . . 17
2.2 Transcriptome Quantification Algorithms . . . 19
2.2.1 Mapping RNA-Seq Reads . . . 19
2.2.2 Finding read-isoform compatibilities . . . 19
2.2.3 IsoEM :Expectation Maximization Algorithm for Estimation Isoform Frequencies . . . 21
2.2.5 Hexamer and repeat bias corrections . . . 27
2.3 Experimental results . . . 28
2.3.1 Comparison of methods on simulated datasets . . . 28
2.3.2 Comparison of methods on two real RNA-Seq datasets . . . 32
2.3.3 Influence of sequencing parameters and scalability . . . 33
2.4 Conclusions . . . 36
PART 3 TRANSCRIPTOME RECONSTRUCTION . . . 38
3.1 Introduction . . . 38
3.1.1 Background . . . 38
3.1.2 Related Work . . . 38
3.1.3 Our Contribution . . . 40
3.2 Annotation-guided Transcriptome Reconstruction Algorithms . 42 3.2.1 Mapping RNA-Seq Reads and Exon Counts . . . 42
3.2.2 VTEM :Virtual Transcript Expectation Maximization Algorithm 42 3.2.3 DRUT : Method for Discovery and Reconstruction of Unannotated Transcripts . . . 45
3.2.4 Experiment Results. . . 48
3.3 Genome-guided Transcriptome Reconstruction Algorithms . . . 55
3.3.1 Read Mapping . . . 55
3.3.2 TRIP :TranscriptomeReconstruction using Integer Programming 55 3.3.3 MLIP : Maximum Likelihood Integer Programming . . . 59
3.3.4 Experimental Results . . . 67
3.4 Conclusion . . . 77
PART 4 DISCUSSION AND FUTURE WORK . . . 79
LIST OF TABLES
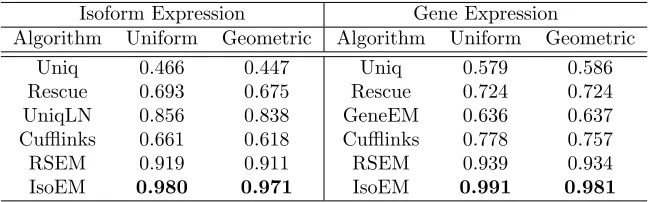
Table 1.1 Classification of transcriptome reconstruction methods . . . 6
Table 2.1 r2 for isoform and gene expression levels inferred from 30M reads of
length 25 from reads simulated assuming uniform, respectively
geo-metric expression of gene isoforms. . . 30
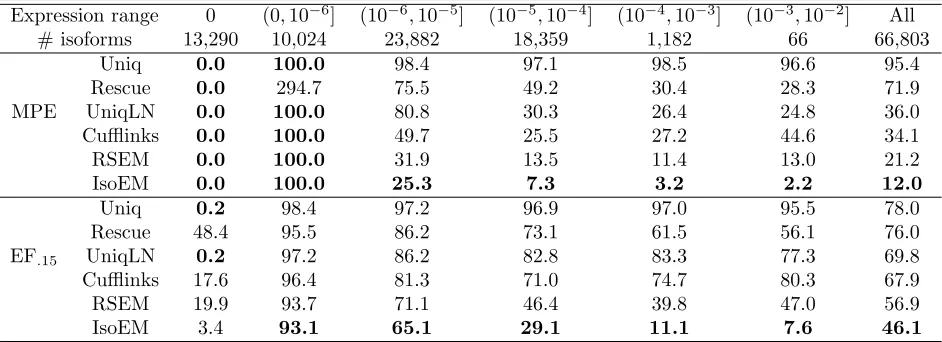
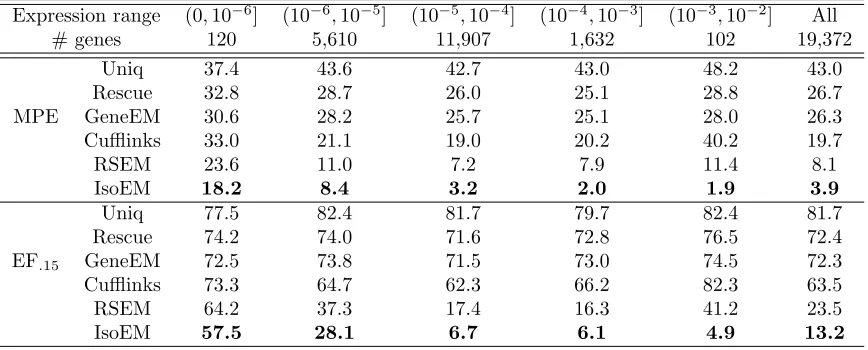
Table 2.2 Median percent error (MPE) and 15% error fraction (EF.15) for
iso-form expression levels inferred from 30M reads of length 25 simulated
assuming geometric isoform expression. . . 32
Table 2.3 Median percent error (MPE) and 15% error fraction (EF.15) for gene
expression levels inferred from 30M reads of length 25 simulated
as-suming geometric isoform expression. . . 33
Table 3.1 Classification of transcriptome reconstruction methods . . . 40
Table 3.2 Median percent error (MPE) and 15% error fraction (EF.15) for isoform
expression levels in Experiment 1. . . 51
Table 3.3 Median percent error (MPE) and 15% error fraction (EF.15) for isoform
expression levels in Experiment 2. . . 52
Table 3.4 Transcriptome reconstruction results for uniform and geometric
frag-ment length distribution. Sensitivity, precision and F-Score for
tran-scriptome reconstruction from reads of length 400bp, mean fragment
length 450bp and standard deviation 45bp simulated assuming
Table 3.5 Transcriptome reconstruction results for various read and fragment
lengths. Sensitivity, precision and F-score for different
combina-tions of read and fragment lengths: (50bp,250bp), (100bp,250bp),
(100bp,500bp), (200bp,250bp), (400bp,450bp). . . 75
Table 3.6 Transcriptome reconstruction results with respect to different
cover-age. Sensitivity, precision and F-Score for transcriptome
reconstruc-tion from reads of length 100bp and 400bp simulated assuming 20X
coverage, respectively 100X coverage per transcript. For read length
100bp fragment length of 250 with 10% standard deviation was used.
For read length 400bp fragment length of 450 with 10% standard
LIST OF FIGURES
Figure 1.1 A schematic representation of the RNA-Seq protocol. . . 3
Figure 2.1 Distribution of compatibility component sizes (defined as the number
of isoforms) for 10 million single reads of length 75 (a) and number of
read classes for 1 to 30 million single reads or pairs of reads of length
75 (b). . . 24
Figure 2.2 The E-Step of IsoEM algorithm based on read classes. . . 24
Figure 2.3 Distribution of isoform lengths (a) and gene cluster sizes (b) in the
UCSC dataset. . . 28
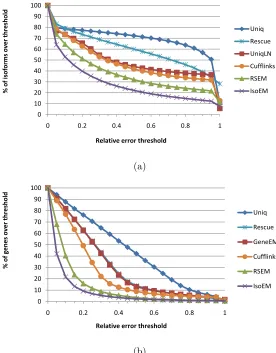
Figure 2.4 Error fraction at different thresholds for isoform (a) and gene (b)
ex-pression levels inferred from 30M reads of length 25 simulated assuming
geometric isoform expression. . . 31
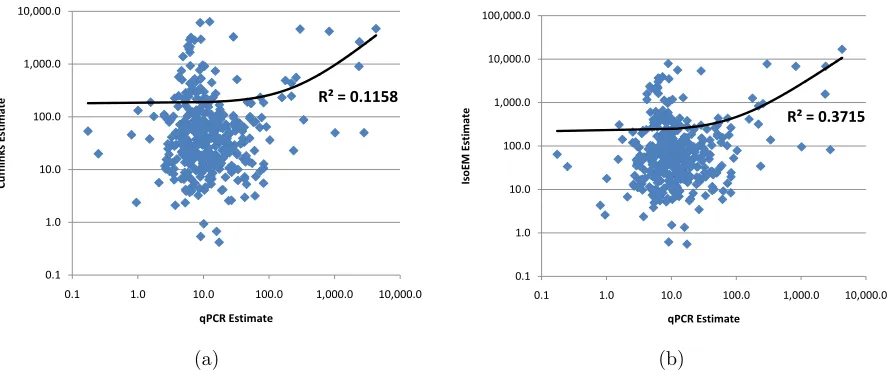
Figure 2.5 Comparison of Cufflinks (a) and IsoEM (b) estimates to qPCR
expres-sion levels reported in [1]. . . 34
Figure 2.6 Comparison of Cufflinks (a) and IsoEM (b) estimates to qPCR
expres-sion levels reported in [2]. . . 35
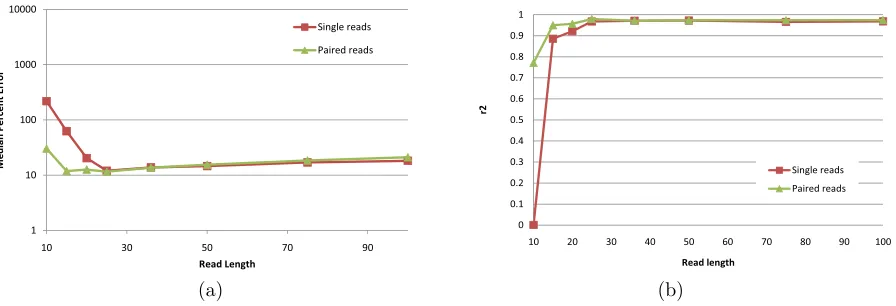
Figure 2.8 IsoEMr2 (a) and CPU time (b) for 1-60 million single/paired reads of
length 75, with or without strand information. . . 35
Figure 2.7 IsoEM MPE (a) and r2 values (b) for 750Mb of simulated data
gen-erated using single and paired-end reads of length varying between 10
and 100. . . 36
Figure 3.2 Flowchart for DRUT. . . 47
Figure 3.3 Error fraction at different thresholds for isoform expression levels
in-ferred from 30 millions reads of length 25bp simulated assuming
ge-ometric isoform expression. Black line corresponds to IsoEM/VTEM
with the complete panel, red line is IsoEM with the incomplete panel,
blue line is rVTEM and the green line is eVTEM. . . 50
Figure 3.4 Comparison between DRUT, RABT, Cufflinks for groups of genes with
n transcripts (n=1,...,9) : (a) Sensitivity (b) Positive Predictive Value
(PPV) . . . 54
Figure 3.5 Pseudo-exons(white boxes) : regions of a gene between consecutive
transcriptional or splicing events. An example of three transcripts
T ri, i = 1,2,3 each sharing exons(blue boxes). Spsej and Epsej
repre-sent the starting and ending position of pseudo-exon j, respectively. 56
Figure 3.6 Splice graph. The red horizontal lines represent single reads. Reads
interrupted by dashed lines are spliced reads. Each vertex of the splice
graph corresponds to a pseudo-exon and each directed edge
corre-sponds to a (splice) junction between two pseudo-exons. . . 57
Figure 3.7 Model Description. A - Pseudo-exons. Pseudo-exons(green boxes) :
regions of a gene between consecutive transcriptional or splicing events;
B - Splice graph. The red horizontal lines represent single-end reads.
Reads interrupted by dashed lines are spliced reads. Each vertex of
the splice graph corresponds to a pseudo-exon and each directed edge
corresponds to a (spliced) junction between two pseudoexons; C
-Candidate Transcripts. -Candidate transcripts corresponds to maximal
paths in the splice graph, which are enumerated using a
Figure 3.8 Flowchart for MLIP. Input : Splice graph. Output: subset of candidate
transcripts with the smallest deviation between observed and expected
read frequencies. . . 65
Figure 3.9 A. Synthetic gene with 3 transcripts and 7 different exons. B. Mapped
reads are used to construct the splice graph from which we generateT
possible candidate transcripts. C. MLIP. Run IP approach to obtain
N minimum number of transcripts that explain all reads. We
enu-merate N feasible subsets of candidate transcripts.The subsets which
doesn’t cover all junctions and MLIP will be excluded from
consider-ation. The subset with the smallest deviation between expected and
observed read frequencies is selected by the MLIP algorithm. . . . 66
Figure 3.10 Distribution of transcript lengths (a) and gene cluster sizes (b) in the
UCSC dataset . . . 68
Figure 3.11 Comparison between methods for groups of genes with n transcripts
(n=1,...,7) on simulated dataset with mean fragment length 500,
stan-dard deviation 50 and read length of 100x2: (a) Sensitivity (b) Positive
Predictive Value (PPV) and (c) F-Score. . . 71
Figure 3.12 Comparison between methods for groups of genes with n transcripts
(n=1,...,7) on simulated dataset with different sequencing parameters
and distribution assumptions: (a) Sensitivity (b) Positive Predictive
Value (PPV) and (c) F-Score. . . 72
Figure 3.13 Overall Sensitivity, PPV and F-Score on simulated dataset with
Figure 3.14 Transcriptome reconstruction results with respect to number of
tran-scripts per gene. Comparison between 5 methods (Cufflinks, IsoLasso,
MLIP - medium stringency settings, M LIP −L - low stringency
set-tings, M LIP −H - high stringency settings) for groups of genes with
n transcripts(n=1,..., ≥ 5) on simulated dataset with mean fragment
LIST OF ABBREVIATIONS
• NGS - Next Generation Sequencing
• GE - Gene Expression Level Estimation
PART 1
INTRODUCTION
Massively parallel whole transcriptome sequencing and its ability to generate full
tran-scriptome data at the single transcript level provides a powerful tool with multiple
inter-related applications, including transcriptome reconstruction ([3], [4], [5], [6]), gene/isoform
expression estimation ([7], [8], [5], [9], also known as transcriptome quantification, studying
trans- and cis-regulatory effect [10], studying parent-of origin effect [10], [11], [12], and
call-ing expressed variants ([13]). As a result, whole transcriptome sequenccall-ing has become the
technology of choice for performing transcriptome analysis, rapidly replacing array-based
technologies ([14]).
The most commonly used transcriptome sequencing protocol, referred to as RNA-Seq,
generates short (single or paired) sequencing tags from the ends of randomly generated cDNA
fragments. Using transcriptome sequencing data, most current research employs methods
that depend on existing transcriptome annotations. Unfortunately, as shown by recent
stud-ies ([15]), existing transcript librarstud-ies still miss large numbers of transcripts. The
incomplete-ness of annotation libraries poses a serious limitation to using this powerful technology since
accurate normalization of data critically requires knowledge of expressed transcript sequences
([7], [8], [16]. [9]. Another challenge in transcriptomic analysis comes from the ambiguities in
read/tag mapping to the reference. My dissertation research focuses on two main problems
in transcriptome data analysis, namely, transcriptome reconstruction and quantification, and
we show how these challenges are handled. Transcriptome reconstruction, also referred to
as novel isoform discovery, is the problem of reconstructing the transcript sequences from
the sequencing data. Reconstruction can be done de novo or it can be assisted by existing
genome and transcriptome annotations. Transcriptome quantification refers to the problem
1.1 RNA-Seq protocol
History of DNA sequencing is rich and diverse. The majority of DNA protocols relied on
Sanger capillary-based semi-automated sequencing technology. Sanger biochemistry allows
to achieve up to 1,000 bp read length, and per-base “raw” accuracies as high as 99.999%.
Due to high accuracy, genomes sequenced by Sanger technology currently are used in modern
databases.
Second-generation of DNA sequencing technologies are more parallelizable and have
higher throughput compared to Sanger protocol. These technologies are collectively called
Next Generation Sequencing (NGS). Many NGS technologies have been realised as a
commer-cial product (e.g., the Illumina HiSeq Systems (marketed by Illumina, San Diego, CA, USA),
the SOLiD Systems (marketed by Applied Biosystems by Life Technologies; San Diego, CA,
USA), 454 Genome Sequencers (Roche Applied Science; Penzberg, Upper Bavaria,
Ger-many), the HeliScope Single Molecule Sequencer technology (Helicos; Cambridge, MA, USA),
Ion Personal Genome Machine Sequencer(marketed by Ion Torrent by Life Technologies, San
Diego, CA, USA). These technologies produce reads of length 50 - 500bp and up to 600 Gb
of throughput.
Recent advances in DNA sequencing have made it possible to sequence the whole
tran-scriptome by massively parallel sequencing, commonly referred as RNA-Seq [7]. RNA-Seq
is quickly becoming the technology of choice for transcriptome research and analyses [14].
RNA-Seq allows reduction of the sequencing cost and significantly increases data
through-put, but it is computationally challenging to use such RNA-Seq data for reconstructing of
full length transcripts and accurately estimate their abundances across all cell types.
RNA-Seq, uses next generation sequencing technologies, such as SOLiD ([17]), 454 ([18]),
Illumina ([19]), or Ion Torrent ([20]). Figure 1.1 depicts the steps in an RNA-Sequencing
experiment, including the first step of analysis which is typically mapping the data to a
reference. After extracting the RNA sample, it is converted to cDNA fragments. The
Figure 1.1 A schematic representation of the RNA-Seq protocol.
be useful in downstream analysis. This is usually followed by an amplification step; then
one or both ends of the cDNA fragments are sequenced producing either single or
paired-end reads. Sequencing can be either directional, meaning that all reads come from the
coding strand for single reads. For paired end read, directional sequencing implied that
the first read in the pair comes from the coding strand, while the second comes from the
non-coding strands. This strand specificity is not maintained in non-directional sequencing.
The specifics of the sequencing protocols vary from one technology to the other. Similarly,
the length of produced reads varies depending on the technology with newer technologies
producing longer reads.
1.2 Applications of RNA-Seq
Ubiquitous regulatory mechanisms such as the use of alternative transcription start and
polyadenylation sites, alternative splicing, and RNA editing result in multiple messenger
RNA (mRNA) isoforms being generated from a single genomic locus. Most prevalently,
alternative splicing is estimated to take place for over 90% of the multi-exon human genes
across diverse cell types [8], with as much as 68% of multi-exon genes expressing multiple
reconstruct full length transcript sequences and accurately estimate their expression levels
is widely believed to be critical for unraveling gene functions and transcription regulation
mechanisms [22].
The common applications of RNA-seq are gene expression level estimation, isoform
expression level estimation, novel transcript discovery, and transcriptome reconstruction. A
variety of new methods and tools have been recently developed to tackle these problems.
Estimating transcript and gene expression levels has long been an important application
for RNA-Seq analyses. Estimation of isoform expression level is not a trivial task .There
is yet no standard protocol for measuring isoforms abundances from RNA-Seq data. The
key challenge in transcriptome quantification is accurate assignment of ambiguous reads to
isoforms. Most RNA-Seq studies to date still ignore alternative splicing or, similar to splicing
array studies, restrict themselves to surveying the expression levels of exons and exon-exon
junctions. The main difficulty in inferring expression levels for full-length transcripts lies in
the fact that current sequencing technologies generate short reads (from few tens to hundreds
of bases), many of which cannot be unambiguously assigned to individual transcripts.
Inferring expression at isoform level provides information for finer-resolution biological
studies, and also leads to more accurate estimates of expression at the gene level by allowing
rigorous length normalization. Genome-wide gene expression level estimates derived from
isoform level estimates are significantly more accurate than those obtained directly from
RNA-Seq data using isoform-oblivious GE methods such as the widely used counting of
unique reads, the rescue method of [7], or the EM algorithm of [23].
Identifying of all transcripts expressed in a particular sample require the assembly of
reads into transcription units. This process is collectively called transcriptome
reconstruc-tion. A number of recent works have addressed the problem of transcriptome reconstruction
from RNA-Seq reads. These methods fall into three categories: guided”,
“genome-independent” and “annotation-guided” methods [24]. Genome-independent methods such
as Trinity [25] or transAbyss [26] directly assemble reads into transcripts. A commonly used
genome-independent methods becomes essential when there is no trusted genome reference that can
be used to guide reconstruction. On the other end of the spectrum, annotation guided
meth-ods [28, 29] make use of available information in existing transcript annotations to aid in the
discovery of novel transcripts. RNA-Seq reads can be mapped onto reference genome,
ref-erence annotations, exon-exon junction libraries, or combinations thereof, and the resulting
alignments are used to reconstruct transcripts.
Many transcriptome reconstruction methods fall in the genome-guided category. They
typically start by mapping sequencing reads onto the reference genome,using spliced
align-ment tools, such as TopHat [30] or SpliceMap [31]. The spliced alignalign-ments are used to identify
exons and transcripts that explain the alignments. While some methods aim to achieve the
highest sensitivity, others work to predict the smallest set of transcripts explaining the given
input reads. Furthermore, some methods aim to reconstruct the set of transcripts that would
insure the highest quantification accuracy. Scripture [4] construct a splicing graph from the
mapped reads and reconstructs isoforms corresponding to all possible paths in this graph. It
then uses paired-end information to filter out some transcripts. Although scripture achieves
very high sensitivity, it may predict a lot of incorrect isoforms. The method of Trapnell et
al. [3, 32], referred to as Cufflinks, constructs a read overlap graph and generates candidate
transcripts by finding a minimal size path cover via a reduction to maximum matching in
a weighted bipartite graph. Cufflinks and Scripture do not target the quantification
accu-racy. IsoLasso [5] uses the LASSO [33] algorithm, and it aims to achieve a balance between
quantification accuracy and predicting the minimum number of isoforms. It formulates the
problem as a quadratic programming one, with additional constraints to ensure that all
ex-ons and junctiex-ons supported by the reads are included in the predicted isoforms. CLIIQ
[34] uses an integer linear programming solution that minimizes the number of predicted
isoforms explaining the RNA-Seq reads while minimizing the difference between estimated
and observed expression levels of exons and junctions within the predicted isoforms.
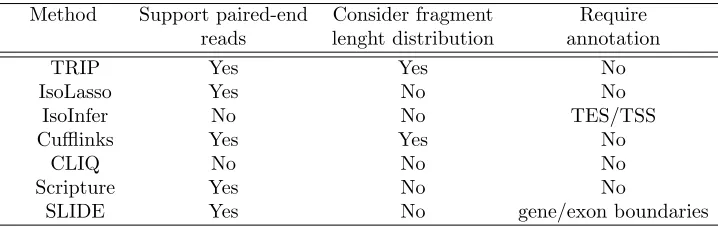
Table 3.1 includes classification of the available methods for genome-guided
Table 1.1 Classification of transcriptome reconstruction methods Method Support paired-end Consider fragment Require
reads lenght distribution annotation
TRIP Yes Yes No
IsoLasso Yes No No
IsoInfer No No TES/TSS
Cufflinks Yes Yes No
CLIQ No No No
Scripture Yes No No
SLIDE Yes No gene/exon boundaries
1.3 Contributions and Future Work
We present a general framework that includes the genome-guided and annotation-guided
transcriptome reconstruction methods as well as methods for transcript and gene expression
level estimation.
We propose a novel expectation-maximization algorithm to solve the problem of
tran-script and gene expression level estimation from RNA-Seq data. Our algorithm, referred
to as IsoEM [9], is based on disambiguating of information provided by the distribution of
insert sizes generated during sequencing library preparation, and takes advantage of base
quality scores, strand and read pairing information when available. To solve the problem
of transcriptome quantification in the context of partially annotated genomes we propose
enhancement of EM algorithm, “Virtual Transcript Expectation Maximization(VTEM)”
[35]. VTEM detects overexpressed reads and/or exons corresponding to the unannotated
transcripts and estimates annotated transcript frequencies.
To address the problem of transcriptome reconstruction we suggest genome-guided and
annotation-guided methods. We present a novel annotation-guided method for transcriptome
discovery and reconstruction in partially annotated genomes and compare it with existing
annotation-guided and genome-guided transcriptome assembly methods. Our method,
re-ferred as “Discovery andReconstruction ofUnannotatedTranscripts” (DRUT) [36], can be
Cufflinks enhanced by DRUT has superior quality of reconstruction and frequency estimation
of transcripts.
To solve transcitome reconstruction problem assisted by existing genome annotations
we propose a novel method called “TransciptomeReconstruction usingIntegerPrograming”
(TRIP [6] ). The method incorporates information about fragment length distribution of
RNA-Seq paired-end reads to reconstruct novel transcripts. The first step is to infer exon
boundaries from spliced genome alignments of the reads. Then, create a splice graph based
on inferred exon boundaries. Third step enumerates all maximal paths in the splice graph
corresponding to putative transcripts. The problem of selecting true transcripts is formulated
as an integer program (IP) which minimizes the set of selected transcripts subject to a good
statistical fit between the fragment length distribution (empirically determined during library
preparation) and fragment lengths implied by mapped read pairs.
Recent advances in sequencing technologies made it possible to produce longer single-end
reads with the length comparable to length of fragment for paired-end technology[20] . Novel
method was developed to address transcriptome reconstruction problem from single
RNA-Seq reads. This method, called “ Maximum Likelihood Integer Programming ” (MLIP),
aims is to predict the minimum number of transcripts explaining the set of input reads with
the highest quantification accuracy. This is achieved by coupling a integer programming
formulation with an expectation maximization model for isoform expression estimation.
Empirical results on both synthetic and real RNA-seq datasets show that the proposed
methods improve transcriptome quantification and reconstruction accuracy compared to
previous methods.
In ongoing work we are exploring possibility of integrating transcriptome
quantifica-tion and transcriptome reconstrucquantifica-tion that will possibly lead to quantificaquantifica-tion based
recon-struction method. Currently, Next Generation Sequencing technologies allow to run library
preparation step multiple times varying the fragment length distribution for every step.
Ad-ditionally, it is possible to perform read barcoding for every library preparation step, which
we plan to develop the method able to handle reads from multiple libraries. We expect to
improve reconstruction accuracy by integrating different fragment length distributions into
transcriptome reconstruction algorithm. Also we are planning to release software tool for
transcriptome quantification and reconstruction that will include all our methods.
1.4 Organization
Dissertation is organized as follows. Chapter 1 gives a brief description of the
RNA-Seq technology and discuss application of this technology for transcriptome quantification
and reconstruction problems. Chapter 2 presents the transcriptome quantification problem
and motivation behind it. Then two approaches are described: first approach for completely
annotated genomes and second one for partially annotated genomes. We finalize this chapter
with application of our method to human RNA-Seq data.
Chapter 3 introduces transcriptome reconstruction problem and gives classification of
existing methods. Transcriptome reconstruction, also referred to as novel isoform discovery,
can be done de novo or it can be assisted by existing genome and transcriptome annotations.
We present algorithms for reconstruction of organisms transcriptome from RNA-Seq data
assisted by existing genome and transcriptome annotations. Discussion and future directions
are provided in the Chapter 4.
1.5 Software Packages
• IsoEM- Inferring Alternative Splicing Isoform Frequencies from High-Throughput
RNA-Seq Data http://dna.engr.uconn.edu/?pageid= 105
• VSEM- Inferring Unannotated Haplotypes Frequencies in Partially Annotated Genomes.
Enhacement Tool for IsoEM and ViSpA.http://www.cs.gsu.edu/ serghei/?q =vsem
• DRUT - Discovery and Reconstruction of Unannotated Transcripts in Partially
Anno-tated Genomes from High-Throughput RNA-Seq Data. http://www.cs.gsu.edu/ serghei/?q=
• TRIP - Novel Transcript Reconstruction from Paired-End RNA-Seq Reads.
http://www.cs.gsu.edu/ serghei/?q=trip
1.6 Related Publications
Refereed Journal Articles and Book Chapters
• S. Al Seesi, S. Mangul, A. Caciula, I. Mandoiu and A. Zelikovsky ”Transcriptome
re-construction and quantification from RNA sequencing data”(to appear), book chapter,
Genome Analysis: Current Procedures and Applications, 2013
• S. Mangul, A. Caciula, O. Glebova, I. Mandoiu and A. Zelikovsky, ”Improved
Tran-scriptome Quantication and Reconstruction from RNA-Seq Reads using Partial
Annota-tions”(to appear), In Silico Biology(ISB) : An International Journal on Computational
Molecular Biology, 2012
• S. Mangul, A. Caciula, I. Mandoiu and A. Zelikovsky ”RNA-Seq based transcriptome
quantification and reconstruction guided by protein coding gene annotation”(to appear),
book chapter, Algorithmic and AI Methods for Protein Bioinformatics, 2012
• M. Nicolae,S. Mangul, I. Mandoiu and A. Zelikovsky, ”Estimation of alternative splicing
isoform frequencies from RNA-Seq data”,Algorithms for Molecular Biology, 2011
• I. Astrovskaya, B. Tork, S. Mangul, K. Westbrooks, I. Mandoiu, P. Balfe and A.
Ze-likovsky, ”Inferring Viral Spectrum from 454 Pyrosequencing Reads”,BMC
Bioinformat-ics, 2011
Refereed Conference Articles
• S. Mangul, A. Caciula, S. Al Seesi, D. Brinza, A. Banday, R. Kanadia, I. Mandoiu and A.
Zelikovsky, ”Flexible Approach for Novel Transcript Reconstruction from RNA-Seq Data
using Maximum Likelihood Integer Programming”(submitted), Proc. 5th International
Conference on Bioinformatics and Computational Biology (BICoB 2013)
• S. Mangul, A. Caciula, S. Al Seesi, D. Brinza, A. Banday, R. Kanadia, I. Mandoiu
and A. Zelikovsky, ”An Integer Programming Approach to Novel Transcript
Computational Biology and Biomedicine (ACM-BCB 2012)
• S. Mangul, A. Caciula, I. Mandoiu and A. Zelikovsky, ”Novel Transcript
Reconstruc-tion from Paired-End RNA-Seq Reads Using Fragment Length DistribuReconstruc-tion”,Proc. 2nd
IEEE International Conference on Computational Advances in Bio and Medical Sciences
(ICCABS 2012)
• S. Mangul, A. Caciula, I. Mandoiu and A. Zelikovsky, ”RNA-Seq based discovery and
re-construction of unannotated transcripts in partially annotated genomes”,Proc. of
Work-shop on Computational Advances in Molecular Epidemiology (CAME 2011)
• S. Mangul, I. Astrovskaya, M. Nicolae, B. Tork, I. Mandoiu and A. Zelikovsky,
”Max-imum Likelihood Estimation of Incomplete Genomic Spectrum from HTS Data”, Proc.
11th Workshop on Algorithms in Bioinformatics (WABI 2011), Lecture Notes in
Bioin-formatics, pp.
• M. Nicolae,S. Mangul, I. Mandoiu and A. Zelikovsky, ”Estimation of Alternative
Splic-ing isoform Frequencies from RNA-Seq Data”, Proc. 10th Workshop on Algorithms in
Bioinformatics (WABI 2010), Lecture Notes in Bioinformatics 6293, pp. 202-214
Posters and Presentations
• S. Mangul, A. Caciula, S. Al Seesi, D. Brinza, I. Mandoiu and A. Zelikovsky, ”TRIP : A
Method for Novel Transcript Reconstruction from Paired-End RNA-Seq Reads”, Poster
at 11th European Conference on Computational Biology(ECCB 2012), Basel, Switzerland,
travel award
• S. Mangul, A. Caciula, S. Al Seesi, O. Sakarya, I. Mandoiu and A. Zelikovsky, ”An
Inte-ger Programming Approach to Novel Transcript Reconstruction from Paired-End
RNA-Seq Reads”, Poster at 20th Annual International Conference on Intelligent Systems for
Molecular Biology(ISMB 2012), Long Beach, CA, travel award
• S. Mangul, ”An Integer Programming Approach to Novel Transcript
Reconstruc-tion from Paired-End RNA-Seq Reads”, invited talk, Student Council Symposium
2012/ISMB 2012, Long Beach, CA
Ap-proach to Novel Transcript Reconstruction from Paired-End RNA-Seq Reads”, Poster
at 8th International Symposium on Bioinformatics Research and Applications (ISBRA
2012), Dallas, TX,best poster award
• S. Mangul, ”Computational Methods for Transcriptome Reconstruction and
Quantifi-cation using RNA-seq”, public lecture, Center of Molecular Biology, University of
Academy of Sciences of Moldova(2012), Chisinau, Moldova
• S. Mangul, ”Mathematical and Computational Approaches in High- Throughput
Ge-nomics”, public lecture, Center of Molecular Biology, University of Academy of
Sci-ences of Moldova(2012), Chisinau, Moldova
• S. Mangul, ”Its a DNA World: An introduction to Next Generation Sequencing”,
public lecture, Center of Molecular Biology, University of Academy of Sciences of
Moldova(2012), Chisinau, Moldova
• S. Mangul, A. Caciula, I. Mandoiu and A. Zelikovsky, ”An Integer Programming
Ap-proach to Novel Transcript Reconstruction from Paired-End RNA-Seq Reads”, Poster at
Workshop on Biostatistics and Bioinformatics, Department of Mathematics and
Statis-tics, Georgia State University (2012), Atlanta, GA
• S. Mangul, A. Caciula, N. Mancuso, I. Mandoiu and A. Zelikovsky, ”An Integer
Program-ming Approach to Novel Transcript Reconstruction from Paired-End RNA-Seq Reads”,
Poster at 16th Annual International Conference on Research in Computational Molecular
Biology (RECOMB 2012), Barcelona, Spain
• S. Mangul, ”Novel Transcript Reconstruction from Paired-End RNA-Seq Reads Using
Fragment Length Distribution”,invited talk,2nd Workshop on Computational Advances
for Next Generation Sequencing (CANGS 2012), Las Vegas, NV, US
• S. Mangul, ”The Next, Next Generation Sequencing - From Semiconductor to Single
Molecule”, Life Technologies UCLA Embassy Info Session(2011), UCLA ISPE,
Univer-sity of California, Los Angeles, CA
• S. Mangul, A. Caciula, I. Mandoiu and A. Zelikovsky, ”RNA-Seq based novel transcripts
Bioinformatics ”From Genomics to Synthetic Biology”(2011), Atlanta, GA
• S. Mangul, A. Caciula, I. Mandoiu and A. Zelikovsky, ”RNA-Seq based discovery and
reconstruction of unannotated transcripts in partially annotated genomes”, Poster at
Workshop on Next-generation Sequencing Technology and Algorithms for Primary Data
Analysis(2011), Institute for Pure and Applied Mathematics, University of California, Los
Angeles, CA
• S. Mangul, I. Astrovskaya, M. Nicolae, B. Tork, I. Mandoiu and A. Zelikovsky,
”Max-imum Likelihood Estimation of Incomplete Genomic Spectrum from HTS Data”,
Math-ematical and Computational Approaches in High-Throughput Genomics(2011), Institute
for Pure and Applied Mathematics, University of California, Los Angeles, CA
• S. Mangul, A. Caciula, I. Mandoiu and A. Zelikovsky, ”RNA-Seq based discovery and
reconstruction of unannotated transcripts in partially annotated genomes”, Poster at
Workshop on Next-generation Sequencing Technology and Algorithms for Primary Data
Analysis(2011), Institute for Pure and Applied Mathematics, University of California, Los
Angeles, CA
• S. Mangul, D. Brinza, F. Hyland, ”Orthogonal Error Correction Codes in Next
Gener-ation Sequencing”,Poster at Life Technologies Intern Poster Session(2011), Foster City,
CA, USA,best poster award
• S. Mangul, I. Astrovskaya, M. Nicolae, B. Tork, I. Mandoiu and A. Zelikovsky (to
appear), ”Maximum Likelihood Estimation of Incomplete Genomic Spectrum from HTS
Data”,Poster at Georgia Life Sciences Summit : Innovation for a Healthier World (2011),
Atlanta, GA, USA
• S. Mangul, I. Astrovskaya, B. Tork, I. Mandoiu and A. Zelikovsky (to appear), ”Viral
Quasispecies Reconstruction Based on Unassembled Frequency Estimation”,Poster at 7th
International Symposium on Bioinformatics Research and Applications (ISBRA 2011),
Changsha, China
• S. Mangul and A. Zelikovsky, ”Haplotype Discovery Based on Unassembled Sequences
Sequencing (RECOMBseqCCB 2011), Vancouver, BC, Canada
• S. Mangul and A. Zelikovsky, ”Haplotype discovery from high-throughput sequencing
data”, Poster at 1st IEEE International Conference on Computational Advances in Bio
and medical Sciences (ICCABS 2011), Orlando, FL, USA
• I. Astrovskaya, B. Tork, S. Mangul, I. Mandoiu, P. Balfe and A. Zelikovsky, ”VISPA:
Viral Spectrum Assembling Method”, Poster at 1st IEEE International Conference on
Computational Advances in Bio and medical Sciences (ICCABS 2011), Orlando, FL, USA,
best poster award
• M. Nicolae,S. Mangul, I. Mandoiu and A. Zelikovsky, ”Estimation of Alternative
Splic-ing Isoform Frequencies From RNA-Seq Data”, INFORMS Annual Meeting (2010) ,
Austin, TX,
• I. Astrovskaya, B. Tork, S. Mangul, K. Westbrooks, I. Mandoiu, P. Balfe and A.
Ze-likovsky, ”HCV Quasispecies Spectrum Reconstruction from 454 Pyrosequencing Reads”,
Poster at Georgia Life Sciences Summit : Innovation for a Healthier World (2010),
At-lanta, GA, USA
• S. Mangul and A. Zelikovsky, ”Haplotype discovery from RNA-Seq data”, Poster at
Georgia Life Sciences Summit : Innovation for a Healthier World (2010), Atlanta, GA,
USA
• M. Nicolae,S. Mangul, I. Mandoiu and A. Zelikovsky, ”Estimation of alternative splicing
isoform frequencies from RNA-Seq data”, Dagstuhl seminar on Structure Discovery in
Biology: Motifs, Networks and Phylogenies (2010), Dagstuhl, Germany
• M. Nicolae,S. Mangul, I.I. Mandoiu and A. Zelikovsky, ”Estimation of alternative
splic-ing isoform frequencies from RNA-Seq data”, Poster at 6th International Symposium on
Bioinformatics Research and Applications (ISBRA 2010), Storrs, CT, USA
• S. Mangul and A. Zelikovsky, ”Haplotype spectrum reconstruction from sequencing
reads”,Poster at 6th International Symposium on Bioinformatics Research and
Applica-tions (ISBRA 2010), Storrs, CT, USA
Symposium on Bioinformatics Research and Applications (ISBRA 2009), Fort Lauderdale,
PART 2
TRANSCRIPTOME QUANTIFICATION
2.1 Introduction
Massively parallel whole transcriptome sequencing, commonly referred as RNA-Seq, is
quickly becoming the technology of choice for gene expression profiling. However, due to the
short read length delivered by sequencing technologies, estimation of expression levels for
alternative splicing gene isoforms remains challenging.
2.1.1 Background
Ubiquitous regulatory mechanisms such as the use of alternative transcription start and
polyadenylation sites, alternative splicing, and RNA editing result in multiple messenger
RNA (mRNA) isoforms being generated from a single genomic locus. Most prevalently,
alternative splicing is estimated to take place for over 90% of the multi-exon human genes
across diverse cell types [8], with as much as 68% of multi-exon genes expressing multiple
isoforms in a clonal cell line of colorectal cancer origin [21]. Not surprisingly, the ability
to reconstruct full length isoform sequences and accurately estimate their expression levels
is widely believed to be critical for unraveling gene functions and transcription regulation
mechanisms [22].
Two key interrelated computational problems arise in the context of transcriptome
quantification: gene expression level estimation (GE), and isoform expression level
estima-tion (IE). Targeted GE using methods such as quantitative PCR has long been a staple of
genetic studies. The completion of the human genome has been a key enabler for
genome-wide GE performed using expression microarrays. Since expression microarrays have limited
capability of detecting alternative splicing events, specialized splicing arrays have been
However, despite sophisticated deconvolution algorithms [37, 38], the fragmentary
informa-tion provided by splicing arrays is typically insufficient for unambiguous identificainforma-tion of
full-length transcripts [39, 40]. Massively parallel whole transcriptome sequencing,
com-monly referred to as RNA-Seq, is quickly replacing microarrays as the technology of choice
for performing GE due to their wider dynamic range and digital quantitation capabilities
[14]. Unfortunately, most RNA-Seq studies to date still ignore alternative splicing or, similar
to splicing array studies, restrict themselves to surveying the expression levels of exons and
exon-exon junctions. The main difficulty in inferring expression levels for full-length isoforms
lies in the fact that current sequencing technologies generate short reads (from few tens to
hundreds of bases), many of which cannot be unambiguously assigned to individual isoforms.
2.1.2 Previous Work
RNA-Seq analyses typically start by mapping sequencing reads onto the reference
genome, transcript libraries, exon-exon junction libraries, or combinations thereof. Early
RNA-Seq studies have recognized that limited read lengths result in a significant
percent-age of so called multireads, i.e., reads that map equally well at multiple locations in the
genome. A simple (and still commonly used) approach is to discard multireads, and
esti-mate expression levels using only the so called uniquereads. Mortazavi et al. [7] proposed a
multiread “rescue” method whereby initial gene expression levels are estimated from unique
reads and used to fractionally allocate multireads, with final expression levels obtained by
re-estimation based on total counts obtained after multiread allocation. An
expectation-maximization (EM) algorithm that extends this scheme by repeatedly alternating between
fractional read allocation and re-estimation of gene expression levels was recently proposed
in [23].
A number of recent works have addressed the IE problem, namely isoform expression
level estimation from RNA-Seq reads. Under a simplified “exact information” model, [40]
showed that neither single nor paired read RNA-Seq data can theoretically guarantee
deconvolute expression levels for the majority of annotated isoforms. The key challenge in
IE is accurate assignment of ambiguous reads to isoforms. Compared to the GE context,
read ambiguity is much more significant, since it affects not only multireads, but also reads
that map at a unique genome location expressed in multiple isoforms. Estimating isoform
expression levels based solely on unambiguous reads, as suggested, e.g., in [21], results in
splicing-dependent biases similar to the transcript-length bias noted in [41], further
com-plicating the design of unbiased differential expression tests based on RNA-Seq data. To
overcome this difficulty, [42] proposed a Poisson model of single-read RNA-Seq data
ex-plicitly modeling isoform frequencies. Under their model, maximum likelihood estimates
are obtained by solving a convex optimization problem, and uncertainty of estimates is
ob-tained by importance sampling from the posterior distribution. Li et al. [43] introduced
an expectation-maximization (EM) algorithm similar to that of [23] but applied to isoforms
instead of genes. Unlike the method of [42], which estimates isoform frequencies only from
reads that map to a unique location in the genome, the algorithm of [43] incorporates
mul-tireads as well. The IE problem for single reads is also tackled in [1], who propose an
EM algorithm for inferring isoform expression levels from the read coverage of exons (reads
spanning exon junctions are ignored).
2.1.3 Our contributions
In this section we focus on the IE problem, namely estimating isoform expression levels
(interchangeably referred to as frequencies) from RNA-Seq reads, under the assumption
that a complete list of candidate isoforms is available. Projects such as [44] and [45] have
already assembled large libraries of full-length cDNA sequences for humans and other model
organisms, and the coverage of these libraries is expected to continue to increase rapidly
following ultra-deep paired-end transcriptome sequencing projects such as [3, 4] and the
widely anticipated deployment of third-generation sequencing technologies such as [46, 47],
which deliver reads with significantly increased length. Inferring expression at isoform level
estimates of expression at the gene level by allowing rigorous length normalization. Indeed,
as shown in the ‘Experimental results’ section, genome-wide gene expression level estimates
derived from isoform level estimates are significantly more accurate than those obtained
directly from RNA-Seq data using isoform-oblivious GE methods such as the widely used
counting of unique reads, the rescue method of [7], or the EM algorithm of [23].
Our main contribution is a novel expectation-maximization algorithm for isoform
fre-quency estimation from any mixture of single and paired RNA-Seq reads. A key feature of
our algorithm, referred to as IsoEM, is that it exploits information provided by the
distribu-tion of insert sizes, which is tightly controlled during sequencing library preparadistribu-tion under
current RNA-Seq protocols. Such information is not modeled in the “exact” information
models of [39, 40], challenging the validity of their negative results. Guttman et al. [4] take
into account insert lengths derived from paired read data, but only for filtering candidate
isoforms in ID. Trapnell et al. [3] is the only other work we are aware of that exploits this
information for IE, in conjunction with paired read data. We show that modeling insert
sizes is highly beneficial for IE even for RNA-Seq data consisting of single reads. Insert
sizes contribute to increased estimation accuracy in two different ways. On one hand, they
can help disambiguating the isoform of origin for the reads. In IsoEM, insert lengths are
combined with base quality scores, and, if available, read pairing and strand information
to probabilistically allocate reads to isoforms during the expectation step of the algorithm.
As in [43], the genomic locations of multireads are also resolved probabilistically in this
step, further contributing to improved overall accuracy compared to methods that ignore or
fractionally pre-allocate multireads. On the other hand, insert size distribution is used to
accurately adjust isoform lengths during frequency re-estimation in the maximization step
of the IsoEM algorithm.
We also present the results of comprehensive experiments conducted to assess the
per-formance of IsoEM on both synthetic and real RNA-Seq datasets. These results show that
IsoEM consistently outperforms existing methods under a wide range of sequencing
evaluating the effect of sequencing parameters such as read length, read pairing, and strand
information on estimation accuracy. Our experiments confirm the surprising finding of [43]
that, for a fixed total number of sequenced bases, longer reads do not necessarily lead to
better accuracy for estimation of isoform and gene expression levels.
2.2 Transcriptome Quantification Algorithms
2.2.1 Mapping RNA-Seq Reads
As with many RNA-Seq analyses, the first step of IsoEM is to map the reads. Our
ap-proach is to map them onto the library of known isoforms using any one of the many available
ungapped aligners (we used Bowtie [48] with default parameters in our experiments). An
al-ternative strategy is to map the reads onto the genome using a spliced alignment tool such as
TopHat [30], as done, e.g., in [3, 4]. However, preliminary experiments with TopHat resulted
in fewer mapped reads and significantly increased mapping uncertainty, despite providing
TopHat with a complete set of annotated junctions. Since further increases in read length
coupled with improvements in spliced alignment algorithms could make mapping onto the
genome more attractive in the future, we made our IsoEM implementation compatible with
both mapping approaches by always converting read alignments to genome coordinates and
performing all IsoEM read-isoform compatibility calculations in genome space.
2.2.2 Finding read-isoform compatibilities
The candidate set of isoforms for each read is obtained by combining all genome
co-ordinates of reads and isoforms, sorting them and using a line sweep technique to detect
read-isoform compatibilities (see Algorithm 1). As detailed below, during the line sweep
reads are grouped into equivalence classes defined by their isoform compatibility sets; this
speeds up the E-step of the IsoEM algorithm by allowing the processing of an entire read
class at once.
Some of the reads match multiple positions in the genome, which we refer to as
the pair align with the genome). Each alignment a can in turn be compatible with multiple
isoforms that overlap at that position of the genome. During the line sweep, we compute
the relative “weight” of assigning a given read/pair r to isoform j as wr,j = PaQaFaOa,
where the sum is over all alignments of r compatible with j, and the factors of the summed
products are defined as follows:
• Qarepresents the probability of observing the read from the genome locations described
by the alignment. This is computed from the base quality scores as Qa =
Q|r|
k=1[(1−
εk)Mak+ εk
3(1−Mak)], whereMak = 1 if positionk of alignmentamatches the reference
genome sequence and 0 otherwise, while εk denotes the error probability of k-th base
of r.
• For paired end reads, Fa represents the probability of the fragment length needed
to produce alignment a from isoform j; note that the length of this fragment can be
inferred from the genome coordinates of the two aligned reads and the available isoform
annotation. For single reads, we can only estimate an upperbound u on the fragment
length: if the alignment is on the same strand as the isoform then u is the number
of isoform annotated bases between the 50 end of the aligned read and the 30 end of
the isoform, otherwise u is the number of isoform annotated bases between the 50 end
of the aligned read and the 50 end of the isoform. In this case Fa is defined as the
probability of observing a fragment with length of u bases or fewer.
• Oais 1 if alignmentaofris consistent with the orientation of isoformj, and 0 otherwise.
Consistency between the orientations ofr andj depends on whether or not the library
preparation protocol preserves the strand information. For single reads Oa = 1 when
reads are generated from fragment ends randomly or, for directional RNA-Seq, when
they match the known isoform orientation. For paired-end reads, Oa = 1 if the two
reads come from different strands, point to each other, and, in the case of directional
Algorithm 1The algorithm for identifying isoforms compatible with reads.
X = all the coordinates of all the entities (isoforms and reads) sort X (radix sort; for equal values, isoform coordinates come first) for x inX do
e = entityFor(x)
if xis an entity end then sig = signature[e] gap = getLastGap(sig) if x is an isoform end then
currentIsoformsForGap[gap].remove(e) else if x is a read endthen
isoforms = currentIsoformsForGap[gap].keepOnlyMatching(sig) if read e is the second read in the pairthen
isoformsForRead[e] = isoformsForRead[e]∩ isoforms else
isoformsForRead[e] = isoforms end if
readClasses[isoformsForRead[e]].add(e) end if
signature.remove(e) else
signature[e].add(x) end if
if xis an exon start then sig = signature[e]
lastButOneGap = getLastButOneGap(sig)
currentIsoformsForGap[lastButOneGap].remove(e) lastGap = getLastGap(sig)
currentIsoformsForGap[lastGap].add(e, sig) end if
end for
2.2.3 IsoEM : Expectation Maximization Algorithm for Estimation Isoform
Frequen-cies
The IsoEM algorithm starts with the set of N known isoforms. For each isoform we
denote by l(j) its length and by f(j) its (unknown) frequency. If we denote by n(j) the
length k, then
E[n(j)]∝ X k≤l(j)
p(k)(l(j)−k+ 1) (2.1)
since, the number of fragments of length k is expected to be proportional to the number of
valid starting positions for a fragment of that length in the isoform. Thus, if the isoform
of origin is known for each read, the maximum likelihood estimator for f(j) is given by
c(j)/(c(1) +. . .+c(N)), where c(j) = n(j)/P
k≤l(j)p(k)(l(j)−k+ 1) denotes the
length-normalized fragment coverage. Note that the length of most isoforms is significantly larger
than the mean fragment length µ typical of current sequencing libraries; for such isoforms
P
k≤l(j)p(k)(l(j)−k+ 1)≈l(j)−µ+ 1 andc(j) can be approximated byn(j)/(l(j)−µ+ 1).
Since some reads match multiple isoforms, their isoform of origin cannot be established
unambiguously. The IsoEM algorithm (see Algorithm 2) overcomes this difficulty by
simul-taneously estimating the frequencies and imputing the missing read origin within an iterative
framework. After initializing frequenciesf(j) at random, the algorithm repeatedly performs
the next two steps until convergence:
• E-step: Compute the expected numbern(j) of reads that come from isoformjunder the
assumption that isoform frequencies f(j) are correct, based on weights wr,j computed
as described in the previous section
• M-step: For each j, set the new value of f(j) to c(j)/(c(1) + . . .+ c(N)), where
normalized coveragesc(j) are based on expected counts computed in the prior E-step
2.2.4 IsoEM optimizations
Below we describe two implementation optimizations that significantly improve the
performance of IsoEM by reducing both runtime and memory usage.
The first optimization consists of partitioning the input into compatibility components.
The compatibility between reads and isoforms naturally induces a bipartite read-isoform
Algorithm 2The expectation-maximization algorithm used by IsoEM.
assign random values to allf(i) while not convergeddo
E-step:
initialize all n(j) to 0 for each read r do
sum =P
j:wr,j>0wr,jf(j)
for each isoform j with wr,j >0 do n(j)+ =wr,jf(j)/sum
end for end for
M-step:
s=P
jn(j)/(l(j)−µ+ 1)
for each isoform j do
f(j) = n(j)/(l(js)−µ+1) end for
end while
originate from it. Connected components of the compatibility graph can be processed
in-dependently in IsoEM since the frequencies of isoforms in one connected component do not
affect the frequencies of isoforms in any other connected component. Although this
opti-mization can be applied to any EM algorithm, its impact is particularly significant in IsoEM.
Indeed, in this context the compatibility graph decomposes in numerous small components
(see Figure 2.1(a) for a typical distribution of component sizes ). The resulting speed-up
comes from the fact that in each iteration of IsoEM we update frequencies of isoforms in a
single compatibility component, avoiding needless updates for other isoforms.
The second IsoEM optimization consists of partitioning the set of reads within each
compatibility component into equivalence classes. Two reads are equivalent for IsoEM if
they are compatible with the same set of isoforms and their compatibility weights to the
isoforms are proportional. Keeping only a single representative from each read class (with
appropriately adjusted frequency) drastically reduces the number of reads kept in memory
(see Figure 2.1(b)). As the number of reads increases, the number of read classes increases
much slower. Eventually this reaches saturation and no new read classes appear – at which
10,000 1,000 10,000 100 1,000 10,000 C o m p o n e ts 100 1,000 10,000 N u m b e r o f C o m p o n e ts 10 100 1,000 10,000 N u m b e r o f C o m p o n e ts 1 10 100 1,000 10,000
0 20 40 60 80 100 120 140 160 180
N u m b e r o f C o m p o n e ts
Component Size (# isoforms) 1
10 100 1,000 10,000
0 20 40 60 80 100 120 140 160 180
N u m b e r o f C o m p o n e ts
Component Size (# isoforms) 1
10 100 1,000 10,000
0 20 40 60 80 100 120 140 160 180
N u m b e r o f C o m p o n e ts
Component Size (# isoforms)
(a) 0.4 0.6 0.8 1 1.2 C la ss e s (M il li o n s) RandomStrandSingle CodingStrandSingle CodingStrandPairs RandomStrandPairs 0 0.2 0.4 0.6 0.8 1 1.2
0 5 10 15 20 25 30
# C la ss e s (M il li o n s)
#Reads/Pairs(Millions) RandomStrandSingle
CodingStrandSingle CodingStrandPairs RandomStrandPairs
[image:41.612.93.526.82.240.2](b)
Figure 2.1 Distribution of compatibility component sizes (defined as the number of isoforms) for 10 million single reads of length 75 (a) and number of read classes for 1 to 30 million single reads or pairs of reads of length 75 (b).
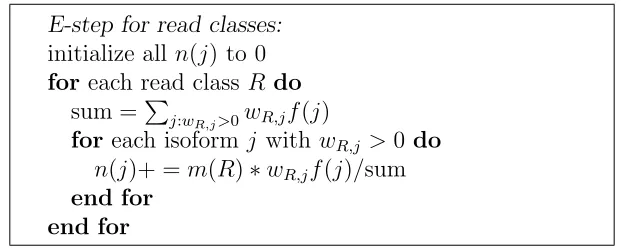
E-step for read classes:
initialize alln(j) to 0 for each read class R do
sum =P
j:wR,j>0wR,jf(j)
for each isoform j with wR,j >0 do n(j)+ =m(R)∗wR,jf(j)/sum
end for end for
Figure 2.2 The E-Step of IsoEM algorithm based on read classes.
in practice the runtime bottlenecks are parsing the reads, computing the compatibility graph
and detecting equivalent reads.
Once read classes are constructed, we only need a small modification of the E-step of
IsoEM to use read classes instead of reads (Figure 2.2). Next we describe the union-find
algorithm used for efficiently finding compatibility components and read classes in IsoEM.
A read class is defined as hm,{(i, w)|i = isoform, w = weight}i, where m is called the
multiplicity of the read class. Given a collection of reads, we want to:
[image:41.612.150.463.329.453.2]• Collapse equivalent reads into read classes with multiplicity indicating the number of
reads in each class.
A straightforward approach is to solve the first problem using a union-find algorithm, then
to take the reads corresponding to each connected component and remove equivalent reads,
e.g., using hashing. However, there are two drawbacks to this approach:
• First, all reads need to be kept in memory until all connected components have been
computed.
• Second, when the number of reads in a connected component is very large the number
of collisions increases, which leads to poor performance.
We overcome the two problems presented above using an online version of the union-find
algorithm which computes connected components and eliminates equivalent reads on the
fly. This way, equivalent reads will never reside too long in memory. Also, we avoid the
problem of large hash tables by using multiple smaller hash tables which are guaranteed to
be disjoint.
We start our modified version of union-find with an empty set of trees. A new
single-node tree is initialized every time a new isoform is found in a read class. In each single-node we
store a hash-table of read classes. Each read is processed as follows:
• If the isoforms compatible with the read correspond to nodes in more than one tree
unite the corresponding trees. The root of the tallest tree becomes the root of the
union tree. Then create a new read class for this read (we can be sure it was not seen
before, otherwise the isoforms would have been in the same tree) and add it to the
hash table of the root node. Notice that at this point the root node is also (trivially)
the Lowest Common Ancestor (LCA) of the nodes corresponding to the isoforms in
the read class
• If the isoforms correspond to nodes in the same tree find the LCA of all these nodes. If
and then drop the read. Otherwise, create a new read class and add it to the LCA’s
hash table.
Notice that in the second case it suffices to look only in the LCA of the isoforms for
an already existing read class. This follows immediately from the fact that we always add
reads to the LCA of the nodes (isoforms) compatible with the read. Note that we cannot use
path compression to speed up ‘find’ operations because this would be altering the structure
of existing trees. Thus, ‘find’ operations will take logarithmic (amortized) time. At the end
of the algorithm, each tree in the union-find forest corresponds to a connected component.
The read classes in each connected component are obtained by traversing the corresponding
tree and collecting all the read classes present in the nodes. At this point we are sure that
all the read classes are distinct, so the collection process performs simple concatenations. To
further speed up the collection process, we can safely use path compression as we traverse
the trees, since we no longer care about the exact topology of the subtrees.
Runtime analysis. Each union operation takesO(1) time, so for a read withkcompatible
isoforms we spend at mostO(k) time doing unions. By always making the root of the taller
tree to be the root of a union, we ensure that the height of any tree is not bigger than
O(logn) where n is the number of nodes in the tree. Thus, finding the root of a node’s
tree takes O(logn). For a read with k compatible isoforms we spend at most O(klogn)
time processing it. The LCA of two nodes can be computed at constant overhead when
performing find operations (by marking the nodes on the paths from isoforms to root).
Collecting all the read classes is sped-up by using path compression. The whole collecting
phase takes O(nα(n)) time where n is the total number of isoforms and α(n) is the inverse
of the Ackermann function. Overall, for q reads with an average of k isoforms per read and
n total distinct isoforms, computing read classes and compatibility components using the
2.2.5 Hexamer and repeat bias corrections
As noted in [49], some commonly used library preparation protocols result in biased
sampling of fragments from isoforms due to the random hexamers used to prime reverse
transcription. To correct for possible hexamer bias, we implemented a simple re-weighting
scheme similar to that proposed in [49]. Each read is assigned a weight b(h) based on its
first six bases and computed as follows. Given a set of mapped reads, let ˆpi be the observed
distribution of hexamers starting at positioni(spanning positionsitoi+ 5) of all the reads.
Thus, ˆpi(h) is the proportion of reads which have hexamer h at position i and ˆp1(h) is the
proportion of reads starting with hexamerh. Letl be the read length. We define the weights
b by:
b(h) =
1 6
Pl/2+3
i=l/2−2pˆi(h) 1
2(ˆp1(h) + ˆp2(h))
Since we already collapse equivalent reads into read classes, we can seamlessly incorporate
hexamer weights in the algorithm by slightly changing the definition of a read class’
multi-plicity to m(R) = P
r∈Rb(h(r)), where h(r) denotes the starting hexamer of r. The effect
of this correction procedure is to reduce (respectively increase) the multiplicity of reads
with starting hexamers that are overrepresented (respectively under-represented) at the
be-ginning of reads compared to the middle of reads. The underlying assumption is that the
average frequency with which a hexamer appears in the middle of reads is not affected by
library preparation biases. Recent methods further target biases in the bases surrounding
the sequenced fragments in addition to those at read ends.
To avoid biases from incorrectly mapped reads originating from repetitive regions,
IsoEM will also discard reads that overlap annotated repeats. When applying this
cor-rection, isoform lengths are automatically adjusted by subtracting the number of positions
5,000 10,000 15,000 20,000 25,000 N u m b e r o f Is o fo rm s 0 5,000 10,000 15,000 20,000 25,000
10 100 1,000 10,000 100,000
N u m b e r o f Is o fo rm s IsoformLength (a) 10000 100000 1000 10000 100000 r o f G e n e s 10 100 1000 10000 100000 N u m b e r o f G e n e s 1 10 100 1000 10000 100000 N u m b e r o f G e n e s 1 10 100 1000 10000 100000
0 5 10 15 20 25 30 35 40 45 50 55
N u m b e r o f G e n e s
NumberofIsoforms
1 10 100 1000 10000 100000
0 5 10 15 20 25 30 35 40 45 50 55
N u m b e r o f G e n e s
NumberofIsoforms
1 10 100 1000 10000 100000
0 5 10 15 20 25 30 35 40 45 50 55
N u m b e r o f G e n e s
NumberofIsoforms
[image:45.612.160.451.84.443.2](b)
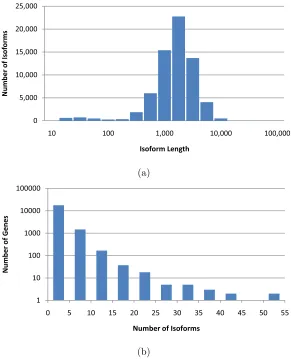
Figure 2.3 Distribution of isoform lengths (a) and gene cluster sizes (b) in the UCSC dataset.
2.3 Experimental results
2.3.1 Comparison of methods on simulated datasets
We tested IsoEM on simulated human RNA-Seq data. The human genome sequence
(hg18, NCBI build 36) was downloaded from UCSC together with the coordinates of the
isoforms in the KnownGenes table. Genes were defined as clusters of known isoforms defined
by the GNFAtlas2 table. The dataset contains a total of 66,803 isoforms pertaining to 19,372
genes. The isoform length distribution and the number of isoforms per genes are shown in
![Figure 2.5 Comparison of Cufflinks (a) and IsoEM (b) estimates to qPCR expression levelsreported in [1].](https://thumb-us.123doks.com/thumbv2/123dok_us/9227714.990560/51.612.85.529.81.265/figure-comparison-cuinks-isoem-estimates-qpcr-expression-levelsreported.webp)