Volume One
State Expenditure on
Science & Technology and
Science and Technology Budget
Review of State Expenditure
on Science & Technology and
Research & Development
2004 and 2005
Prepared by:
Science and Technology Indicators Unit Monica Roche
Andrew Stockman Helena Connellan Alison Brereton
Foreword
Investment in science and technology (S&T), particularly in research and development (R&D) activities, is one of the key pillars of policy under the National Development Plan, which helps drive the Irish economy in its transition to become a more knowledge-driven economy with high value-added activities.
Government departments and agencies have a key role in carrying out and supporting science and technology spending. The largest areas of State expenditure on science and technology identified in this report are:
Supporting R&D performed in the government sector; Assisting businesses that carry out S&T activities; Supporting S&T infrastructure;
Promoting S&T across the education and training systems.
In an ever-evolving and more competitive global economic environment, the Irish economy is already beginning to reap the benefits of previous S&T investments from private and public sources. This increased investment in innovation has helped foster more research and development which is in turn being successfully exploited in commercial terms by Irish-based firms in markets across the world. Looking to the future, the drive to become a truly knowledge-driven and competitive economy can only become more difficult as globalisation increases, firm-level collaboration increases across major competitors and as markets become even more open to trade and more price competitive. Investment in science, technology and innovation will assist firms to stay one step ahead of their global competitors by allowing development and delivery of new products, processes and solutions to markets.
Therefore the role of government in investing in key science and technology areas will remain critical over the coming years. The Irish government must therefore continue the positive trends of previous years, by continuing to place investment in S&T high on its priority list of economic spending. In particular, increasing R&D spending, and improving R&D performance, is one of the key drivers identified which will support efforts to move to a more knowledge-driven and competitive economy. The increased complexity and technology content of most activities offers significant opportunities for innovation-based solutions to complex problems. Therefore the development and delivery of new products and innovative processes to meet market needs, will place firms in a stronger position compared to major competitors.
Contents
Introduction 2
Government Departments and Agencies 3
Definitions of Science and Technology Activities 4
Chapter 1 – Science and Technology 5
1.1 Total State funding of S&T 5
1.2 Funding for S&T in the State sector 6
1.3 Sources of funding for S&T in the State sector, 1995-2005 7
1.4 Public Funding of S&T as a % of GNP 8
1.5 Trends in S&T spending by activity, 2002-2005 9
1.6 S&T funding by activity, 2005 10
1.7 Indicative distribution of government funds for S&T, 2005 11
Chapter 2 – Research and Development 12
2.1 Total State funding of scientific R&D 12
2.2 Total public funding of scientific R&D 14
2.3 Sources of public funding for scientific R&D 15
2.4 Public funding of R&D by departments and offices 16
2.5 Government budget allocations as a % of GNP 18
Chapter 3 – Performance of R&D in the Public Sector 19
3.1 Expenditure on R&D performed in the public sector, 1995-2005 19
3.2 Performance of R&D in the public sector as a % of GNP 20
3.3 Major performers of R&D in the public sector 21
Chapter 4 – Personnel Engaged in R&D 22
4.1 Researchers and research personnel in the State sector 22
4.2 Full-time equivalents devoted to R&D by gender 23
4.3 R&D personnel by qualification 25
Chapter 5 – International Comparisons of Public Sector R&D 27
5.1 Government budget allocated to R&D as a % of GDP 27
5.2 Civil R&D funding by the government sector for selected countries, 1995 and 2004 28
5.3 R&D performance within the government sector for selected countries, 1995 and 2004 29
5.4 Average annual growth of government R&D budget 30
Forfás Publications 2005 31
Functions of Forfás 32
Introduction
Every year Forfás publishes the ‘Science and Technology Budget’, a comprehensive report on State expenditures on science and technology (S&T) and research and development. The ‘Science and Technology Budget’ provides details of the allocations made by Government to all scientific and technological activities, both those undertaken by the public sector and the private sector. The most important of these activities is research and development (R&D). Other activities include training, education and information, technical services (including information and advice) and technology transfer. In all, 46 government departments and agencies are involved in allocating the total S&T budget.
This publication provides details on allocated and actual spending by the State on science and technology (S&T) activities in the period 2004-2005. It includes the final outturn of spending on S&T activity by the State in 2004, alongside proposed spending by the State on S&T in 2005.
As well as examining the overall levels of State spending on S&T, the report measures spending as a proportion of economic activity and of the total government budget. The report also details the S&T activities of individual departments and agencies, changes in spending, and S&T spending by purpose and objective.
Government Departments
and Agencies
Spending by the State on S&T includes: S&T spending by government departments; S&T spending by associated government agencies; S&T spending by government offices.
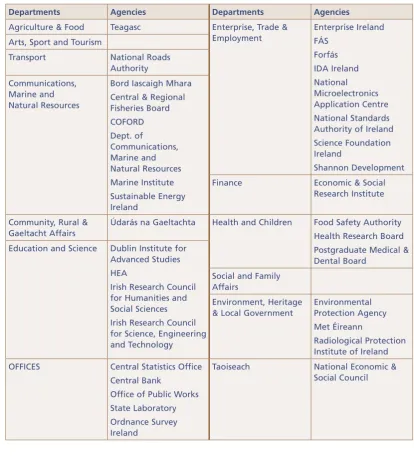
[image:8.595.108.523.272.729.2]Table 1 below is a list of 46 government departments, agencies and offices which are included in the 2004/2005 science budget.
Table 1: Government departments/agencies funding S&T, 2005
Departments Agencies Departments Agencies
Agriculture & Food Teagasc Enterprise, Trade &
Employment Enterprise Ireland FÁS Forfás IDA Ireland National Microelectronics Application Centre National Standards Authority of Ireland Science Foundation Ireland
Shannon Development Arts, Sport and Tourism
Transport National Roads
Authority Communications,
Marine and Natural Resources
Bord Iascaigh Mhara Central & Regional Fisheries Board COFORD Dept. of Communications, Marine and Natural Resources Marine Institute Sustainable Energy Ireland
Finance Economic & Social
Research Institute
Community, Rural & Gaeltacht Affairs
Údarás na Gaeltachta Health and Children Food Safety Authority
Health Research Board Postgraduate Medical & Dental Board
Education and Science Dublin Institute for
Advanced Studies HEA
Irish Research Council for Humanities and Social Sciences Irish Research Council for Science, Engineering and Technology
Social and Family Affairs
Environment, Heritage & Local Government
Environmental Protection Agency Met Éireann
Definitions of Science and
Technology Activities
The total public expenditure on science and technology occurs under five broad headings. These are classified below with a detailed definition of each.
i) Research and development:
Research: Original, experimental or theoretical investigations undertaken to acquire new knowledge, with or without a particular application or use in view.
Development: Systematic work drawing on existing knowledge gained from research and/or practical experience, that is directed to producing new products, processes, systems, services, varieties and breeds and to improving substantially already existing ones. Data collection conducted solely or primarily as part of the research and development (R&D) process included under “research” or “development” as appropriate.
ii) Technical services: Specialised support services of a scientific or technical nature generally provided by centralised laboratories or facilities and can be of a routine or non-routine nature. Essentially they comprise the technical back-up, analytical, diagnostic and data collection/processing services.
iii) Training, education and information:
Training and education: Education and training of third level or equivalent students in science and technology disciplines.
Information: Provision of information via formalised scientific and technical information and documentation (STID) services includes all expenditure (manpower and materials) involved in acquiring, controlling or transmitting information to users with the involvement of staff whose primary function is in formalised STID services e.g. provision of S&T information, advice, liaison, specialist advice, information analysis, libraries, publications and documentation services,
translations, technical seminars and conferences. Provision of information via non-formalised
STID services includes expenditure on providing know how and expertise by members of staff who, while not specifically engaged in formalised STID services, provide specialist advice, liaison, consultancy or other general information services.
iv) Technology transfer: Activities which are directed solely or primarily towards the transfer and adoption of new technology, generally in enterprises. The horizontal transfer of technology, primarily from abroad, but also from colleges to enterprises is included here.
v) Other S&T activities: Activities which cannot be conveniently grouped under the above headings can be included here e.g. grants to international organisations, policy planning units etc.
Other definitions:
Third level education: All universities and institutes of technology. Public funds: Exchequer monies and funds from the EU.
1
Science and Technology
1.1 Total State funding of science and technology
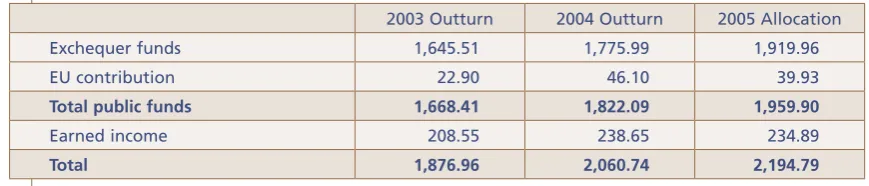
The total State funding of science and technology (S&T) activities from 46 government departments,
[image:10.595.89.524.346.439.2]agencies and offices increased by 9.7% between 2003 and 2004, from E1.88 billion to E2.06 billion
(Table 2). Total State funding of S&T includes expenditure by the exchequer, expenditure by the EU and finally receipts from the earned income of activities. State funding is estimated to have risen by
a further 6.5% in 2005 to total E2.20 billion.
The largest contributor to the overall State S&T budget in 2004 was the exchequer, which accounts for over 86% of the total spend. Exchequer funding for science and technology activities, which includes expenditure on research and development and education and training activities among others,
increased by E130.5 million (7.9%) compared to 2003, to total E1.78 billion in the outturn for 2004.
Earned income from science and technology activities increased by over 14% from the 2003 outturn
to total E239 million in 2004. Finally the contribution from the EU via structural funds increased to
E46.1 million in 2004.
Table 2: Total State funding of S&T, 2003 outturn, 2004 outturn and 2005 allocation Em.
2003 Outturn 2004 Outturn 2005 Allocation
Exchequer funds 1,645.51 1,775.99 1,919.96
EU contribution 22.90 46.10 39.93
Total public funds 1,668.41 1,822.09 1,959.90
Earned income 208.55 238.65 234.89
Total 1,876.96 2,060.74 2,194.79
The 2005 Science Budget, as well as collecting final data for 2004, also captured data from government departments, offices and agencies on estimated spending on S&T activities in 2005. These estimates are made following the allocations to departments outlined in the 2005 budget. Preliminary data shows that State expenditure allocated to science and technology activities is
expected to rise to E2.2 billion in 2005. Although data is subject to final confirmation, this would
1.2 Funding for science and technology in the State sector
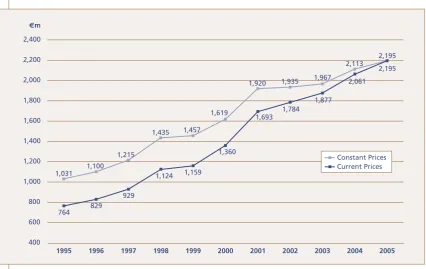
Figure 1 shows the increase in funding of science and technology in the State sector in the ten year
period between 1995 and 2005. The two lines show spending in nominal terms (Em) and also in real
terms (data is deflated by the consumer price index to eliminate the effects of inflation and price rises on the data).
[image:11.595.96.523.243.512.2]The graph shows that funding for S&T activities has increased steadily between 1995 and 2005 in current prices (lower line). Between 1995 and 2000, the rate of increase in S&T spending was 78%. That rate of increase slowed between 2000 and 2005 to 61%. The rate of expansion in State expenditure allocated to S&T activities between 2004 and 2005 is expected to slow to 6.5%, compared to the 9.8% rise posted between 2003 and 2004.
Figure 1: Funding for science and technology in the State sector (real and nominal) (Em)
£]äΣ £]£ää £]Ó£x
£]{Îx £]{xÇ £]È£
£]Óä £]Îx £]ÈÇ
Ó]££Î Ó]£x
ÇÈ{ nÓ
Ó
£]£Ó{ £]£x
£]ÎÈä
£]ÈÎ £]Çn{ £]nÇÇ
Ó]äÈ£ Ó]£x
{ää Èää nää £]äää £]Óää £]{ää £]Èää £]nää Ó]äää Ó]Óää Ó]{ää %
£x £È £Ç £n £ Óäää Óää£ ÓääÓ ÓääÎ Óää{ Óääx ÃÌ>ÌÊ*ÀVià ÕÀÀiÌÊ*ÀViÃ
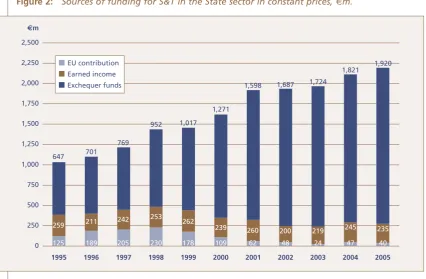
1.3 Sources of funding for science and technology in the State sector 1995-2005
Funding for science and technology in the State sector (fig. 2) comes from the following sources: Direct exchequer funds
EU contributions
Earned income (mostly from fees received by the HEA).
[image:12.595.97.524.281.560.2]The breakdown of the sources of public funding of S&T activities is shown below. It can be seen that there have been steady constant price increases (current spending adjusted for inflation) in the levels of exchequer-sourced funding of State S&T spending over the last ten years. These exchequer-sourced increases have been the main drivers of the overall increase in State S&T spending in that period. In contrast, constant price spending sourced from the net income receipts of S&T activities has remained largely unchanged in the last ten years. A marked drop in real EU-sourced funding of State S&T projects has continued, with EU receipts in 2005 around 17% of their peak total in 1998.
Figure 2: Sources of funding for S&T in the State sector in constant prices, Em.
£Óx £n Óäx ÓÎä £Çn £ä {n Óx
{ä {Ç Ó{ ÈÓ
ÓÎx Ó{x Ó£ Óää ÓÈä ÓÎ ÓÈÓ ÓxÎ Ó{Ó Ó££
È{Ç Çä£
ÇÈ
xÓ £]ä£Ç £]ÓÇ£
£]xn £]ÈnÇ £]ÇÓ{
£]nÓ£ £]Óä
ä Óxä xää Çxä £]äää £]Óxä £]xää £]Çxä Ó]äää Ó]Óxä Ó]xää
£x £È £Ç £n £ Óäää Óää£ ÓääÓ ÓääÎ Óää{ Óääx 1ÊVÌÀLÕÌ
>Ài`ÊVi ÝV iµÕiÀÊvÕ`Ã %
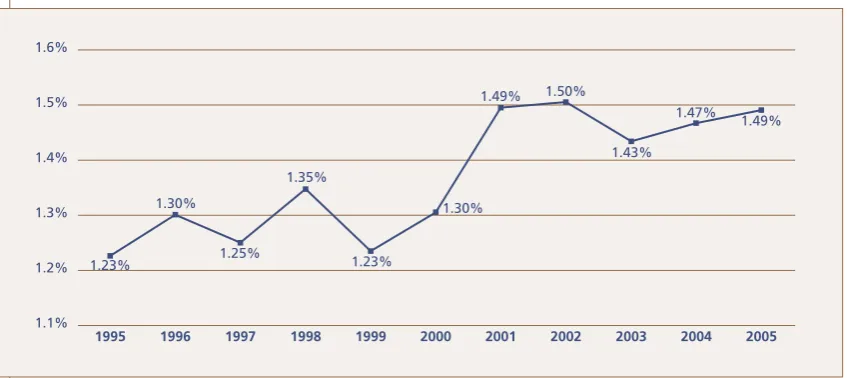
1.4 Public Funding of science and technology as a % of GNP 1995-2005
[image:13.595.100.524.198.387.2]Public funding of science and technology consists of funding directly from the exchequer and funding contributions from the European Union. In figure 3 public funding is shown in relative terms to the wider economy as a percentage of economic activity for the ten years from 1995 to 2005. Gross National Product (GNP) is used as a benchmark for economic activity in Ireland as the usual indicator of relative economic well-being, Gross Domestic Product (GDP) is distorted by profit repatriations from large multinational firms. The difference between GDP and GNP is now estimated to be 22% in Ireland.
Figure 3: Public funding of S&T as a percentage of GNP (current prices)
£°Îä¯
£°Óί
£°{¯ £°xä¯
£°{¯ £°{ǯ
£°{ί
£°Îä¯ £°Îx¯
£°Óx¯ £°Óί
£°£¯ £°Ó¯ £°Î¯ £°{¯ £°x¯ £°È¯
£x £È £Ç £n £ Óäää Óää£ ÓääÓ ÓääÎ Óää{ Óääx
As figure 3 demonstrates, the relative intensity of science and technology spending from public sources to economic activity has fluctuated over the last ten years. The spending intensity moved from 1.23% to 1.30% of GNP between 1995 and 2000, before rising sharply between 2000 and 2002 to 1.50% of GNP.
Following a fall in the ratio of public funding of S&T spending to GNP in 2003, the intensity of spending has climbed once more to reach an estimated 1.49% of GNP in 2005. This increasing intensity has occurred in a period of high economic growth, where increases in public funding in the science budget of between 7% and 9% have outweighed the rate of expansion of the overall
economy. In nominal terms, public funding of S&T activities rose by 7.7% from 2004 to reach E1.96
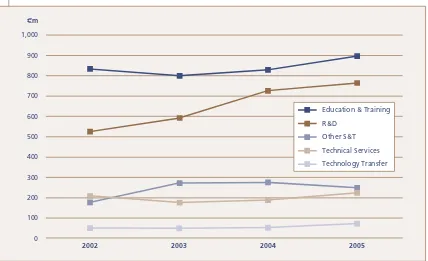
1.5 Trends in S&T spending by activity, 2002 - 2005
[image:14.595.96.524.198.459.2]Between 2002 and 2005, spending on S&T by the State, in the activities of education and training, has continued to be the largest area of investment. That said, the significant increases in the area of research and development, by the State, has allowed a narrowing of the spending gap between this key area and the top investment area. There have been less noticeable spending increases in the areas of technical services and technology transfer. Figure 4 below outlines nominal spending on S&T by activity from 2002 to 2005.
Figure 4: State S&T spending by activity 2002-2005 Em (current prices)
ä £ää Óää Îää {ää xää Èää Çää nää ää £]äää
ÓääÓ ÓääÎ Óää{ Óääx
`ÕV>ÌÊEÊ/À>} ,E
"Ì iÀÊ-E/
/iV V>Ê-iÀÛVià /iV }ÞÊ/À>ÃviÀ
%
In 2004, S&T spending by the State in the area of education and training rose by 3.6 % in nominal terms in comparison to 2003. In contrast, spending on research and development activities funded by the State rose by 22.8% in the same period, mostly as a result of significant increases in R&D funding from Science Foundation Ireland. Other areas of S&T spending also enjoyed strong increases from 2003 to 2004, with spending in the area of S&T technology transfers rising by 10.1% and expenditure on technical services increasing by 7.8%.
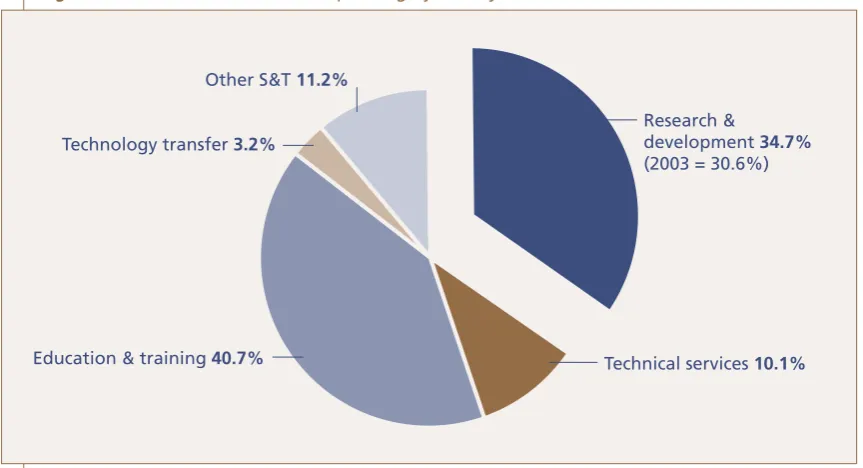
1.6 Science and technology funding by activity, 2005
Total State spending on science and technology activities in 2005 can be further broken down and classified into the following areas (details on how programmes are allocated to various areas are listed in the introduction to this report):
Research and development Technical services
Training, education and information Technology transfer, and
Other S&T activities.
[image:15.595.93.525.284.518.2]Figure 5 below shows the distribution and share of total State allocated funds in the area of science and technology between the various activities for 2005.
Figure 5: 2005 Distribution of S&T spending by activity
"Ì iÀÊ-E/Ê££°Ó¯
/iV }ÞÊÌÀ>ÃviÀÊΰӯ
`ÕV>ÌÊEÊÌÀ>}Ê{ä°Ç¯ /iV V>ÊÃiÀÛViÃʣ䰣¯
,iÃi>ÀV ÊEÊ
`iÛi«iÌÊÎ{°Ç¯ ÓääÎÊrÊÎä°È¯®
The bulk of the funds have been allocated to education and training and research and development,
which between them account for 75.4% of the total or E1,656,360. The share of State spending on
research and development has risen from a share of 31% of the total S&T spend in 2003, to a share of 34.7% in 2005. Additional and targeted R&D funding in the science budget from Science Foundation Ireland and PRTLI programs has contributed to this increased share.
Of the remaining 25%, technical services account for 10.1% of the total S&T budget in 2005
(E221,344), other science and technology activities 11.2% (E246,730) and the remaining 3.2% will
fund technology transfer activities.
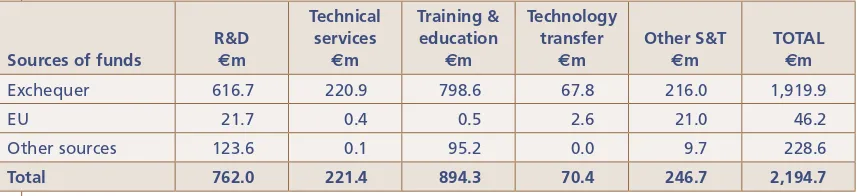
1.7 Indicative distribution of government funds for science and technology, 2005
As well as analysing the levels of funding of the five types of activity in the overall science budget it is possible to examine where each of the scientific areas was able to source its funding from i.e. from exchequer, EU or other sources (which includes businesses and other contributions).
[image:16.595.94.524.177.275.2]Table 3 shows this information for State S&T spending in 2005.
Table 3: Indicative distribution of government funds for S&T, 2005
Sources of funds
R&D Em
Technical services
Em
Training & education
Em
Technology transfer
Em
Other S&T Em
TOTAL Em
Exchequer 616.7 220.9 798.6 67.8 216.0 1,919.9
EU 21.7 0.4 0.5 2.6 21.0 46.2
Other sources 123.6 0.1 95.2 0.0 9.7 228.6
Total 762.0 221.4 894.3 70.4 246.7 2,194.7
Spending on R&D activities within the State S&T budget is mainly sourced, like all other activities, from the exchequer. Nearly 81% of all State R&D spending is financed in this way. Almost 16.2% of spending on R&D is sourced from “other sources” (including Irish industry) and from receipts from net incomes. Finally, 2.8% of State spending on R&D was financed from EU programmes.
Almost 90% of spending on the largest S&T activity “training and education”, comes from the exchequer with around 11% from other sources. Little spending, in this area, is sourced from the EU.
In the area of “technical services” funds are sourced directly from the exchequer. Of the E221.4
million spent by the State in this S&T area in 2005, only E0.5 million was sourced from outside the
exchequer.
Finally, spending in the S&T area of “technology transfer” which enjoyed a 35.8% nominal rise
between 2004 and 2005, is funded mostly from the exchequer. In 2005, E67.8 million of exchequer
2
Research and Development
2.1 Total State funding of scientific R&D
One of the most important areas of focus in the overall science budget is spending dedicated to the area of research and development. Investment in R&D by the State will help drive the Irish economy in its transition to become a more knowledge-driven economy with high value-added activities. The OECD definition of R&D is:
“Research and experimental development (R&D) comprises creative work undertaken on a systematic basis in order to increase the stock of knowledge, including knowledge of man, culture and society, and the use of this stock of knowledge to devise new applications.” (Frascati Manual, OECD, 2002). The State currently invests in a wide range of R&D based programmes including:
Programmes to support research and development performed in the higher education sector e.g. funding given via Science Foundation Ireland, the Higher Education Authority PRTLI, IRCSET and IRCHSS
R&D programmes performed in the government sector by government departments and agencies e.g. Teagasc and the Health Research Board
Projects to assist businesses develop and increase R&D capabilities e.g. via programmes operated by IDA Ireland and Enterprise Ireland
Supporting R&D infrastructure across all sectors of performance.
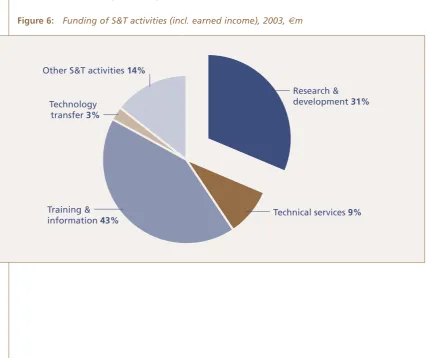
[image:17.595.96.524.435.793.2]As discussed in the previous chapter the share of total State spending dedicated to the key area of R&D has been increasing in recent years.
Figure 6: Funding of S&T activities (incl. earned income), 2003, Em
"Ì iÀÊ-E/Ê>VÌÛÌiÃÊ£{¯
/iV }ÞÊ ÌÀ>ÃviÀÊί
/À>}ÊEÊ
vÀ>ÌÊ{ί /iV V>ÊÃiÀÛViÃʯ
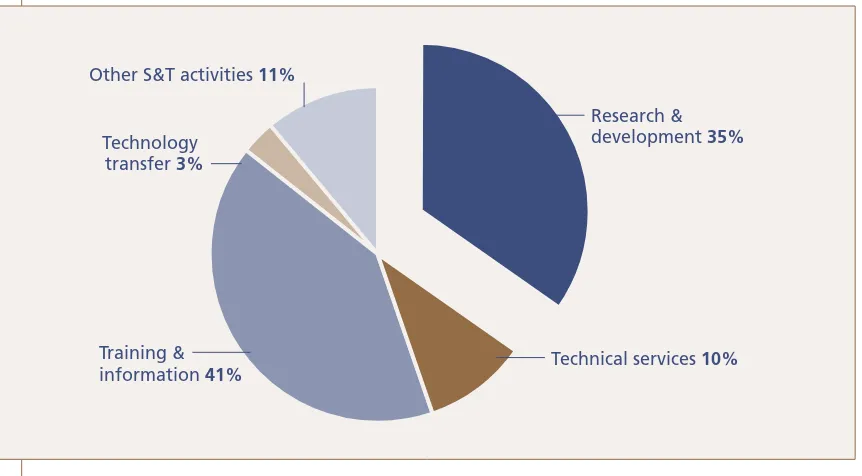
Figure 7: Funding of S&T activities (incl. earned income), 2005, Em
"Ì iÀÊ-E/Ê>VÌÛÌiÃÊ££¯
/iV }ÞÊ ÌÀ>ÃviÀÊί
/À>}ÊEÊ
vÀ>ÌÊ{£¯ /iV V>ÊÃiÀÛViÃÊ£ä¯
,iÃi>ÀV ÊEÊ `iÛi«iÌÊÎx¯
In 2005 the total State budget dedicated to R&D activities totalled E762 million (including receipts
2.2 Total public funding of scientific research and development
The total public funding by government and the EU, from 1995 to 2005, for scientific research and development is shown in Fig. 8. The series is shown in current and constant prices (stripping out inflationary effects). Net income receipts or funding from non government areas toward R&D activities are not included in this series. It can be seen that there have been strong increases in
the last six years in public R&D spending. Since 2003 funding has increased sharply from E446m to
E634.3m in 2005, an increase of 42% in nominal terms and 36% in real terms. That said, there has
[image:19.595.95.520.233.450.2]been a slow down in the strong rate of expansion in public R&D spending which reached 31.1% in 2003-2004, but which eased to 8.4% between 2004 to 2005.
Figure 8: Public funding of R&D (excluding earned income), current and constant prices 1995-2005
££°È £{{°ä £xä°Ó
£È°Ó £nÇ°È
Ó{{°£ Îäx°È
£È£°{ ££°£ £È°{
Óxä°È ÓÎx°Ç Óä°{
Î{È°Ç
{ÎÇ°Î
Èää°Ó ÈÎ{°Î
{äΰÎ
xnx°{
{{È°ä {ÈÇ°{
ä £ää Óää Îää {ää xää Èää Çää
£x £È £Ç £n £ Óäää Óää£ ÓääÓ ÓääÎ Óää{ Óääx
%
ÃÌ>ÌÊ*ÀVià ÕÀÀiÌÊ*ÀViÃ
2.3 Sources of public funding for scientific research and development
The main sources for public research and development funding over the past 10 years have been
via the exchequer and the EU. Total funding has risen in real terms from E161m. in 1995 to E635m.
in 2005. This includes funding for R&D performed in all areas of the economy, including the higher education and State sectors, alongside public money invested in R&D activities, performed in the business sector.
[image:20.595.95.523.247.512.2]The exchequer’s percentage share of total public funding has risen from 60% in 1995 to 97% in 2005. By contrast the EU contribution has dwindled from 40% in 1995 to just 3% in 2005. This corresponds with the trends in the sources of funding for other science and technology activities generally, and is also in line with fall-offs in other EU sourced overall funding since 2000.
Figure 9: Sources of public R&D funding, 1995-2005 (excluding earned income) – 2005 prices Em
159 147 209
311
414 416
579 617
65 78 85
96 113 112
92
81 36
24 26
21 18
89
0 100 200 300 400 500 600 700
1995 1996 1997 1998 1999 2000 2001 2002 2003 2004 2005
161 191
197
251 236
290 347
438 442
600 635 EU
Exchequer %m
Between 2003 and 2004, exchequer sourced funding of R&D activities rose from E416 million in
nominal terms to E579 million (an increase in exchequer sourced funding of 39.2%). Exchequer
sourced funding of public R&D is expected to grow by a more modest 6.6% between 2004 and 2005,
to total E617 million. Details of individual departmental spending on R&D activities in 2004 and 2005
2.4 Public funding of research and development by departments and offices
Table 4: Public funding of research & development
2004 2005
Funding department or office Allocating organisation Exch
E’000 CSF E’000
Total public funding
E’000
Exch
E’000 CSF E’000
Total public funding E’000 Enterprise, Trade & Employment Enterprise, Trade & Employment
11,410 0 11,410 12,279 0 12,279
Enterprise Ireland 47,380 14,308 61,688 58,197 10,940 69,137
HEA 6,747 0 6,747 3,075 0 3,075
IDA Ireland 11,827 2,966 14,793 16,500 3,500 20,000 Shannon Development 1,631 1,854 3,485 1,897 2,000 3,897
NSAI 0 0 0
FÁS 2,996 172 3,168 2,994 0 2,994
Dublin Ins. for Advanced Studies
65 0 65 78 0 78
Economic and Social Research Institute
372 372 358 0 358
Science Foundation Ireland
107,289 107,289 120,550 0 120,550
Forfás 500 0 500 545 0 545
Teagasc 275 0 275 0 0 0
Údarás na Gaeltachta 819 0 819 0 0 0 Nat. Microelectronics
Application Centre
101 0 101 145 0 145
Sub-total 191,412 19,300 210,712 216,621 16,440 233,061
Education and Science
Dept. of Education and Science
57,053 0 57,053 72,689 0 72,689
Higher Education Authority
139,052 139,052 128,882 0 128,882
Dublin Institute For Advanced Studies
2,002 211 2,213 2,200 311 2,511
IRCHSS 7,418 0 7,418 7,400 0 7,400 Economic and Social
Research Institute
341 0 341 152 0 152
IRCSET 13,400 0 13,400 16,350 0 16,350
Sub-total 219,266 211 219,477 227,673 311 227,984
Agriculture and Food
Dept. of Agriculture & Food
7,510 0 7,510 8,029 0 8,029
HEA 7,570 0 7,570 12,570 0 12,570
Teagasc 49,487 0 49,487 48,407 0 48,407
Sub-total 64,567 0 64,567 69,006 0 69,006
Health and Children Dept. of Health & Children
3,312 0 3,312 3,831 0 3,831
Health Research Board 26,036 0 26,036 35,055 0 35,055
ESRI 2,185 0 2,185 2,438 0 2,438
Food Safety Authority 318 0 318 490 0 490
2004 2005 Funding department or office Allocating organisation Exch
E’000 CSF E’000
Total public funding
E’000
Exch
E’000 CSF E’000
Total public funding E’000 Communications, Marine & Natural Resources
Dept. of CM&NR 57 0 57 167 0 167 Marine Institute 15,936 0 15,936 17,221 0 17,221
BIM 902 134 1,036 1,851 194 2,045
COFORD 1,395 0 1,395 1,522 0 1,522
HEA 2,090 0 2,090 4,000 0 4,000
Media Lab. Europe 7,856 0 7,856 0 0 0 Central & Regional
Fisheries Board
972 28 1,000 978 22 1,000
Sustainable Energy Ireland
3,850 677 4,527 4,964 636 5,600
ESRI 42 0 42 0 0 0
Sub-total 33,100 839 33,939 30,703 852 31,555
Environment, Heritage and Local Government
Met Éireann 1,999 0 1,999 2,284 0 2,284
HEA 7,317 0 7,317 7,000 0 7,000
RPII 437 0 437 441 0 441
ESRI 31 0 31 17 0 17
Central & Regional Fisheries Board
60 0 60 18 0 18
Teagasc 705 0 705 0 0 0
Sub-total 10,549 0 10,549 9,760 0 9,760
Social & Family Affairs
Dept. of Social & Family Affairs
4,691 0 4,691 6,139 0 6,139
ESRI 270 0 270 63 0 63
Sub-total 4,961 0 4,961 6,202 0 6,202
Community, Rural & Gaeltacht Affairs
Dept. of CR&GA 0 0 0 0 0 0
Údarás na Gaeltachta 1,734 0 1,734 2,600 0 2,600 Health Research Board 277 0 277 0 0 0
Sub-total 2,011 0 2,011 2,600 0 2,600
Finance ESRI 6,558 0 6,558 5,447 0 5,447
Sub-total 6,558 0 6,558 5,447 0 5,447
Taoiseach NESC 749 0 749 788 0 788
ESRI 0 0 0 0 0 0
Sub-total 749 0 749 788 0 788
Transport NRA 278 0 278 246 0 246
Met Éireann 194 0 194 0 0 0
2.5 Government budget allocations as a percentage of GNP
The GBAORD indicator is the international metric used to measure and compare public funding of research and development. The GBAORD indicator includes all publicly funded R&D spending from the exchequer and from the EU, contained in the Science Budget. In addition, spending on public R&D in the arts and humanities areas is also included.
Between 2004 and 2005, GBAORD in Ireland rose from E625 million to E676 million, representing an
[image:23.595.94.522.204.467.2]8.2% nominal increase. Figure 10 below displays GBAORD as a percentage of GNP since 1995.
Figure 10: GBAORD as % of GNP, 1995-2005
ä°Ó¯ ä°Î£¯
ä°Ó¯ ä°ÎÓ¯
ä°Ón¯ ä°Îä¯
ä°{ä¯ ä°{£¯
ä°xä¯ ä°x£¯
ä°Î{¯
ä°Óx¯ ä°Îä¯ ä°Îx¯ ä°{ä¯ ä°{x¯ ä°xä¯ ä°xx¯
£x £È £Ç £n £Ê Óäää Óää£ ÓääÓ ÓääÎ Óää{ Óääx
Although the relative intensity of GBAORD to GNP fell between 1995 and 1999, this was not as a result of falling spending on public R&D activities. It was caused by the increase in nominal R&D spending being outweighed by the growth of GNP in the same period. During this strong period of economic growth, the GBAORD intensity ratio fell from 0.29% of GNP to 0.28% of GNP.
3
Performance of Research and
Development in the Public Sector
3.1 Expenditure on research and development performed in the public sector 1995-2005
This chapter moves on from the previous chapters which focussed on expenditure on science and technology and research and development, to examine the performance of R&D in the public sector. This includes R&D carried out by State bodies such as Teagasc and the Marine Institute among others, but excludes R&D performed in the higher education sector (this R&D performance is capture in the higher education R&D survey which is also carried out by Forfás).
[image:24.595.95.523.321.540.2]Figure 11 below charts the amount spent on research and development which was performed in the public sector from 1995 to 2005 (GOVERD).
Figure 11: Expenditure on R&D performed in the public sector (current and constant prices) 1995-2005
n£°Ó nx°Ó nx°x n°Î nä°Î
££Î°Ç
£Îx° £Îΰx £{Ó°ä £Îx°£
Èä°Ó È{°Ó Èx°{ Çä°ä
Èΰ
x°È £ä{°£
£Óx°Î £ÓÇ°{
£În°x £Îx°£
ä Óä {ä Èä nä £ää £Óä £{ä £Èä
££n°ä
ÃÌ>ÌÊ*ÀVià ÕÀÀiÌÊ*ÀViÃ
£x £È £Ç £n £ Óäää Óää£ ÓääÓ ÓääÎ Óää{ Óääx
%
Research and development, performed by the public sector rose to E138.5 million in 2004, an increase
of 8.7% compared to the previous year in nominal terms, and a rise of 6.4% in real terms.
GOVERD however, is expected to drop slightly for 2005 to E135.1m. an annual fall of 2.5% in nominal
3.2 Performance of R&D in the public sector as a % of GNP
[image:25.595.107.543.157.424.2]Figure 12 shows performance of research and development in the public sector (GOVERD) as a percentage of Gross National Product since 1995. Again the GNP figure, which excludes net income flows for economic activity, is used to benchmark Irish performance.
Figure 12: GOVERD as a percentage of GNP, 1995-2005
䰣ί
ä°£Ó¯
ä°££¯
ä°£ä¯
ä°än¯
ä°££¯ ä°££¯ ä°£Ó¯
ä°££¯ ä°££¯
ä°£ä¯
ä°ää¯ ä°äÓ¯ ä°ä{¯ ä°äȯ ä°än¯ ä°£ä¯ ä°£Ó¯ ä°£{¯
£x £È £Ç £n £Ê Óäää Óää£ ÓääÓ ÓääÎ Óää{ Óääx
3.3 Major performers of research and development in the public sector
Total expenditure on research and development in the public sector is estimated to amount to
E135.1m. in 2005 as compared with E127.4m. in 2003 (current prices). Table 5 below shows the share
of total GOVERD expenditure per department or agency. As can be seen Teagasc continue to be the largest performer of R&D in the State sector, accounting for 42.4% of the total R&D performance in the sector.
Table 5: GOVERD expenditure per department/agency
Dept./Agency Name R&D Total Allocation
E’000 2005
Teagasc 57,309
Marine Institute 17,221
Economic & Social Research Institute 10,666
Dept. of Agriculture & Food 8,029
Dept. of Social and Family Affairs 6,139
Sustainable Energy Ireland 5,600
Office of Public Works 5,117
Dept. of Health and Children 3,831
Others 21,216
Total GOVERD 135,128
[image:26.595.93.526.398.776.2]The major public sector performers of research and development in 2005 in the State are shown in Figure 13.
Figure 13: Major public sector performers, 2005 (total = 135m)
/i>}>ÃVÊ{Ó¯
>ÀiÊÃÌÌÕÌiʣί "Ì iÀÃʣȯ
i«Ì°ÊvÊi>Ì >`Ê `ÀiÊί
i«Ì°ÊvÊ-V>Ê>`Ê >ÞÊvv>ÀÃÊx¯ i«Ì°ÊvÊ}ÀVÕÌÕÀiÊ
>`Ê`Êȯ VV>Ê>`Ê-V>ÊÊ
,iÃi>ÀV ÊÃÌÌÕÌiÊn¯ "vvViÊvÊ*ÕLVÊ7ÀÃÊ{¯
4
Personnel Engaged in
Research and Development
This chapter focuses on personnel involved in R&D activities performed in the State sector (excluding higher education). For the science and technology budget, questionnaires were sent to State
institutions asking them to detail the number and gender of researchers and support staff involved in R&D activities performed within the State sector.
In addition to collecting data on a headcount basis, the survey also asked for information on the percentage of time spent on research by these personnel. This data was used to convert the headcount data into “full-time equivalence”. Information on the numbers of staff with PhD qualifications was also sought.
4.1 Researchers and research personnel in the State sector
[image:27.595.94.521.402.616.2]Figure 14 below shows a five year trend of personnel employed in R&D activities performed in the State sector (2000-2005). It shows personnel numbers (which includes researchers and support staff) in terms of headcount (HC) and full-time equivalents (FTE). To convert the data to FTE from HC, a time use co-efficient is applied (e.g. if a person spends half their time on R&D activities and half of their time on other non-R&D activities, then they are counted as 0.5 FTE for R&D personnel).
Figure 14: Total R&D personnel in the State sector (2000-2005)
nää £]äää £]Óää £]{ää £]Èää £]nää Ó]äää
Óäää Óää£ ÓääÓ ÓääÎ Óää{ Óääx
i>`VÕÌ ÕÌiÊiµÕÛ>iÌÃ
4.2 Full-time equivalents devoted to research and development by gender
[image:28.595.95.523.187.447.2]“Full-time equivalence” attempts to measure the amount of time actually spent on research and development by any one individual, as opposed to time spent on other non-R&D related work. It is the metric used to compare performance with other countries on a like-for-like basis. Figure 15 below shows total research personnel employed in the State sector in Ireland from 2003-2005, broken down by gender.
Figure 15: Full-time equivalent R&D personnel by gender (2003-2005)
Çäΰä ÇÎÓ°Ç Çx£°
{È{°x {Çä°Ó
{Ón°£
ä £ää Óää Îää {ää xää Èää Çää nää
ÓääÎ Óää{ Óääx
>i i>i
As discussed previously the number of FTE research personnel carrying out activities in the
government sector fell by 4.5% between 2004 and 2005 to stand at 1,167 personnel. The number of male FTE research personnel fell by 6.5% to stand at 703 in 2005, which is ahead of the 1.2% fall in female research personnel in the same period.
[image:28.595.96.524.534.761.2]Figure 17: Total personnel engaged in R&D by gender 2005
>iÊÈ{¯ i>iÊÎȯ
4.3 Research and development personnel by qualification
[image:30.595.93.524.192.413.2]The personnel questions within the 2004/2005 science budget also asked R&D performing units within the Government sector to identify and detail those researchers who had PhD qualifications. In 2005 the number of PhD qualified research scientists and engineers rose to 309 from 304 in headcount terms. Numbers of non-PhD research scientists and engineers fell for the second successive year, falling to 233 well below the 369 counted in 2003. Numbers of technicians and support staff remained virtually unchanged at 575 and 453 respectively in 2005.
Figure 18: Government research personnel by qualification (2002 – 2005)
ä £ää Óää Îää {ää xää Èää Çää
ÓääÓ ÓääÎ Óää{ Óääx
"Ì iÀ Ê* ` * /iV
[image:30.595.95.526.454.775.2]Figures 19 and 20 compare the percentage of total researcher scientists and engineers engaged in research and development activities by qualification. Numbers of others staff and technicians are also included in the graphs.
Figure 19: Total R&D personnel by qualification 2004
"Ì iÀÊÃÌ>vvÊÓn¯
/iV V>ÃÊÎx¯
Figure 20: Total R&D personnel by qualification 2005
"Ì iÀÊÃÌ>vvÊÓ¯
/iV V>ÃÊÎȯ
Ê* Ê£x¯ * ÊÓä¯
5
International Comparisons
of Public Sector Research
and Development
This chapter provides charts and tables which benchmark Ireland’s research and development spending and performance against that of 15 other European countries, the US and Japan. Ireland’s performance is measured as a percentage of GNP as opposed to GDP in the other countries, as it is a more accurate indicator of economic activity.
[image:32.595.94.523.265.631.2]5.1 Government budget allocated to research and development as a % of GDP
Figure 21: Government budget allocated to R&D as a % of GDP (Ireland GNP), 2004 (or latest year available)
ä°Îä¯ ä°{ä¯
ä°xä¯ ä°Èί
ä°È{¯ ä°Èȯ
ä°È¯ ä°ÇÓ¯ ä°ÇÓ¯
ä°Çȯ ä°Çǯ ä°Çǯ ä°Çn¯ ä°Çn¯
ä°x¯ £°äί
£°ä{¯ £°££¯
ä°ä¯ ä°Ó¯ ä°{¯ ä°È¯ ä°n¯ £°ä¯ £°Ó¯
5.2 Civil research and development funding by the government sector for selected countries, 1995 and 2004
[image:33.595.94.521.198.448.2]Ireland’s spending on civil research and development as a percentage of Gross National Product rose to 0.50% in 2004 from 0.37% in 1995. This allowed for a small rise in Ireland’s international ranking to take place, although the country still continues to lag behind the relative spending performance of major competitors on the international stage.
Table 6: Government funding of civil R&D as a % of GDP (Ireland GNP) 1995 and 2004 (or latest available data)
1995 2004
Finland 0.96 1.00
France 0.78 0.80
Netherlands 0.83 0.76
Sweden 0.87 0.74
Norway 0.76 0.73
Germany 0.82 0.72
Denmark 0.66 0.71
Italy 0.55 0.67
Portugal 0.44 0.65
Austria 0.66 0.64
Belgium 0.52 0.63
Spain 0.44 0.59
United Kingdom 0.50 0.52
Ireland (2005) (GNP) 0.37 0.50
United States 0.43 0.49
Greece 0.28 0.30
Finland continued to top the international benchmarking tables concerning relative spending on civil GBAORD in 2004, which reached 1.0% of GDP. Civil GBAORD spending in Spain and Belgium as a percentage of GDP increased considerably since 1995. In Spain relative spending rose from 0.44% of GDP in 1995 to 0.59% of GDP for the latest year for which data were available. In Belgium, civil GBAORD rose from 0.52% of GDP to 0.63% of GDP in the same period.
5.3 Research and development performance within the government sector for selected countries, 1995 and 2004
[image:34.595.94.521.183.434.2]Table 7 attempts to benchmark Ireland’s R&D performance within the State sector (GOVERD) against that of other EU countries and the US. It excludes the performance of R&D activities which are performed within the higher education sector, which are measured by the HERD indicator.
Table 7: R&D performed in the public sector as a % of GDP (Ireland GNP), 1995 and 2004 (or latest available data)
1995 2004
France 0.48 0.37
Finland 0.38 0.34
Germany 0.35 0.34
Netherlands 0.36 0.27
Norway 0.29 0.26
Belgium 0.08 0.16
Denmark 0.31 0.18
Italy 0.21 0.21
Portugal 0.15 0.19
Spain 0.15 0.17
United Kingdom 0.28 0.18
United States 0.24 0.24
Austria 0.13 0.12
Greece 0.12 0.14
Ireland (2004) (GNP) 0.13 0.11
Sweden 0.12 0.12
5.4 Average annual growth of government research and development budget
The following chart benchmarks Ireland’s average annual growth of the overall government budget allocation spent on R&D (GBAORD) activities between 1995 and 2004. The data is captured from the OECD Main Science and Technology Indicators database and converts the data to US$ at Purchasing Power Parity (PPP$) to allow for a better comparison to be made.
[image:35.595.97.523.249.710.2]It can be seen that Ireland recorded the highest average annual growth in GBAORD between 1995 and 2004, with an average annual expansion of 11.86%. Irish GBAORD although growing from a low base in 1995 was able to grow strongly in line with the strong expansion in economic activity recorded during the next ten-year period. Spanish GBAORD growth was the next strongest of the countries benchmarked, with average growth of 11.25% of GBAORD posted between 1995 and 2004.
Figure 22: GBAORD average annual growth rate 1995-2004
££°nȯ ££°Óx¯ ǰί
Ç°ää¯ È°È£¯ È°Îί È°Ó£¯ È°£Î¯ È°äx¯ x°Ç{¯ x°Èί x°£x¯ x°äÓ¯ {°nȯ {°nÓ¯ ΰÇȯ ΰxx¯ ΰ{n¯ ΰ{n¯ £°Ó¯
ä¯ Ó¯ {¯ ȯ n¯ £ä¯ £Ó¯ £{¯
Forfás Publications 2005
From Research to the Marketplace –
Patent Registration and Technology Transfer in Ireland (web only)
March 2005
Making Technological Knowledge Work – A Study of the Absorptive Capacity of Irish SMEs
March 2005
Strategic Technology Platforms
Irish Council for Science, Technology and Innovation
March 2005
Towards the Seventh EU Framework Programme for Research and Technological Development
Irish Council for Science, Technology and Innovation
March 2005
International Trade & Investment Report, 2004 April 2005
An Impact Assessment of the Proposed EU Chemical Policy (REACH) on Irish Industry
April 2005
Annual Employment Survey, 2004 April 2005
Make Consumers Count: A New Direction for Irish Consumers Report of the Consumer Strategy Group
May 2005
Business Expenditure on Research & Development (BERD) Ireland 2003/2004 May 2005 Languages and Enterprise –
The Demand & Supply of Foreign Language Skills in the Enterprise Sector Expert Group on Future Skills Needs
June 2005
Annual Report 2004 June 2005
Annual Competitiveness Report National Competitiveness Council
September 2005
Economic Consequences of the Doha Round For Ireland September 2005
Skills Needs in the Irish Economy: The Role of Migration Expert Group on Future Skills Needs
October 2005
National Skills Bulletin
Expert Group on Future Skills Needs
October 2005
Competitiveness Challenge National Competitiveness Council
November 2005
National Code of Practice for Managing and Commercialising Intellectual Property from Public-Private Collaborative Research
Advisory Council for Science Technology and Innovation
November 2005
Benchmarking Ireland’s Broadband Performance December 2005
Data Analysis of In-Employment Education and Training in Ireland Expert Group on Future Skills Needs
Functions of Forfás
Forfás is the national policy and advisory board for enterprise, trade, science, technology and
innovation. It is the body in which the State’s legal powers for industrial promotion and technological development have been vested. It is also the body through which powers are delegated to Enterprise Ireland for the promotion of indigenous industry and to IDA Ireland for the promotion of inward investment.Science Foundation Ireland was established as a third agency of Forfás in July 2003. The broad functions of Forfás are to:
advise the Minister on matters relating to the development of industry in the State
advise on the development and co-ordination of policy for Enterprise Ireland, IDA Ireland, Science Foundation Ireland and such other bodies (established or under statute) as the Minister may by order designate
encourage the development of industry, science and technology, innovation, marketing and human resources in the State
encourage the establishment and development in the State of industrial undertakings from outside the State, and
advise and co-ordinate Enterprise Ireland, IDA Ireland and Science Foundation Ireland in relation to their functions.
Is é Forfás an bord comhairleach agus polasaí náisiúnta do fhiontar, thráchtáil, eolaíocht, theicneolaíocht agus nuálaíocht. Is é an comhlacht ina bhfuil cumhacht dlíthiúil an Stáit dílsithe i leith tionscail a chur chun cinn agus forbairt teicneolaíochta. Is é an comhlacht freisin trína thiomnaítear cumhachtaí go Enterprise Ireland chun tionscal dúchais a chur chun cinn agus do IDA Ireland chun infheistíocht isteach a chur chun cinn. Bunaíodh Science Foundation Ireland mar thríú gníomhaireacht de Forfás in Iúil 2003. Is iad na feidhmeanna leathana de Forfás ná chun:
comhairle a thabhairt don Aire ó thaobh cúrsaí a bhaineann le forbairt tionscail sa Stát; comhairle a thabhairt maidir leis an bhforbairt agus an gcomhordú de pholasaí do Enterprise Ireland, IDA Ireland, Science Foundation Ireland agus d’aon chomhlacht eile dá leithéid (bunaithe nó faoi reacht) mar a d’fhéadfadh an tAire a thiomnú de réir ordaithe;
an fhorbairt de thionscal, theicneolaíocht, mhargaíocht agus acmhainní daonna a spreagadh sa Stát; an bunú agus an fhorbairt sa Stát de ghnóthais tionsclaíochta a spreagadh ó áiteanna lasmuigh den Stát; agus
Forfás Board Members
Eoin O’Driscoll, Chairman Managing Director, Aderra
Martin Cronin Chief Executive, Forfás
Sean Dorgan
Chief Executive, IDA Ireland
Sean Gorman
Secretary General, Department of Enterprise, Trade and Employment
Dr William Harris
Director General, Science Foundation Ireland
Prof. Michael Hillery
Emeritus Professor of Engineering, University of Limerick
Dr Rosheen McGuckian
Chief Executive Officer, GE Money
Rody Molloy Director General, FÁS
William Murphy
Partner, Tynan Dillon and Company
Feargal O’Rourke
Partner, Taxation, PricewaterhouseCoopers
Frank Ryan
Chief Executive, Enterprise Ireland
Dr Don Thornhill
Appendix 1: Methodology
The information given in this document relates to 46 institutions in receipt of monies from the exchequer for the performance or support of scientific, technological and related activities in every field and is based on the information supplied by these institutions. In general, institutions and information relating to them are listed separately. In a few cases an institution is listed with its parent department or organisation but identified separately. Where practicable the programmes of the various institutions have been separated and categorised in accordance with international practice into relevant scientific and technological activities i.e.:
Research and development (R&D) Technical services
Training, education and information Technology transfer and
Other S&T activities.
However, in many instances, especially in institutions with few staff, institutions operate several programmes jointly, sharing resources in an administratively appropriate unit. In these circumstances the programmes, as described here, do not represent truly independent programmes. Consequently, the data should be interpreted with caution if expansions or contractions are being considered. Expenditure data for specific programmes refer to the 2004 outturn costs of programmes and to the expected costs in 2005. The outturn costs are mainly funded by matching grant-in-aid or voted monies. Where programmes are funded in other ways these monies are noted separately. In these instances the expenditure (cost) data shown includes both exchequer and other income contributions. Expenditures are based on unaudited figures. For convenience, general overheads, where shown, are distributed in proportion to programme expenditures. Programmes are attributed to the institution most directly involved, that is to those actually operating them, but not necessarily funding them. An example of the latter is the Department of Enterprise, Trade and Employment, which funds, but does not operate or manage many programmes. Only their own administrative costs are attributed to the funding institutions in such cases.
Numbers of staff involved in individual S&T programmes are shown only where a reasonable subdivision is possible. Where institutions are involved in funding a large number of external R&D (or similar) personnel, data on these external personnel are not given.
Appendix 2: Index of Acronyms
BIM Bord Iascaigh Mhara - Irish Sea Fisheries Board
CRFB Central and Regional Fisheries Boards
COFORD National Council for Forest Research and Development
CSF Community Support Framework
CSO Central Statistics Office
DIAS Dublin Institute for Advanced Studies
EPA Environmental Protection Agency
ESRI Economic and Social Research Institute
EU European Union
FÁS Foras Áiseanna Saothair – National Training and Employment Authority
Forfás National Policy and Advisory Board for Enterprise, Trade, Science, Technology and Innovation
FSAI Food Safety Authority of Ireland
HEA Higher Education Authority
HRB Health Research Board
IDA Industrial Development Agency
IRCHSS Irish Research Council for the Humanities and Social Sciences IRCSET Irish Research Council for Science, Engineering and Technology
MLE Media Laboratory Europe
NMAC National Microelectronics Applications Centre
NESC National Economic and Social Council
NMRC National Microelectronics Research Centre
NRA National Roads Authority
NSAI National Standards Authority of Ireland
OPW Office of Public Works
OSI Ordnance Survey Ireland
OST Office of Science and Technology - Department of Enterprise, Trade and Employment
Appendix 3: Transfer
Payments Between
Departments and Agencies
[image:41.595.107.496.236.817.2]The science and technology infrastructure is very complex with a range of agencies/departments donating and receiving funds from each other to fund various S&T activities. Table 8 outlines the planned flow of funds for 2005.
Table 8: Planned transfer payments between S&T organisation for S&T activities, 2005, E’000